Navigation

    Netgate Discussion Forum
    • Register
    • Login
    • Search
    • Categories
    • Recent
    • Tags
    • Popular
    • Users
    • Search

    Status / Monitoring does not show correct traffic information

    webGUI
    1
    1
    75
    Loading More Posts
    • Oldest to Newest
    • Newest to Oldest
    • Most Votes
    Reply
    • Reply as topic
    Log in to reply
    This topic has been deleted. Only users with topic management privileges can see it.
    • C
      Crunk_Bass last edited by

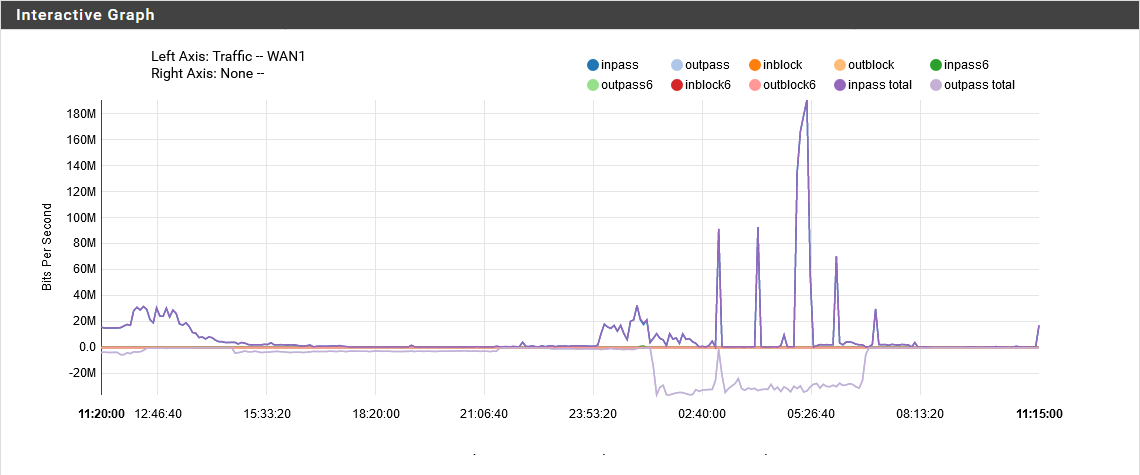
      I am running a multiple WAN setup and noticed the GUI does not show the correct traffic statistics.
      A few hours ago I uploaded files via my WAN2 but it shows the traffic on the WAN1 graph.
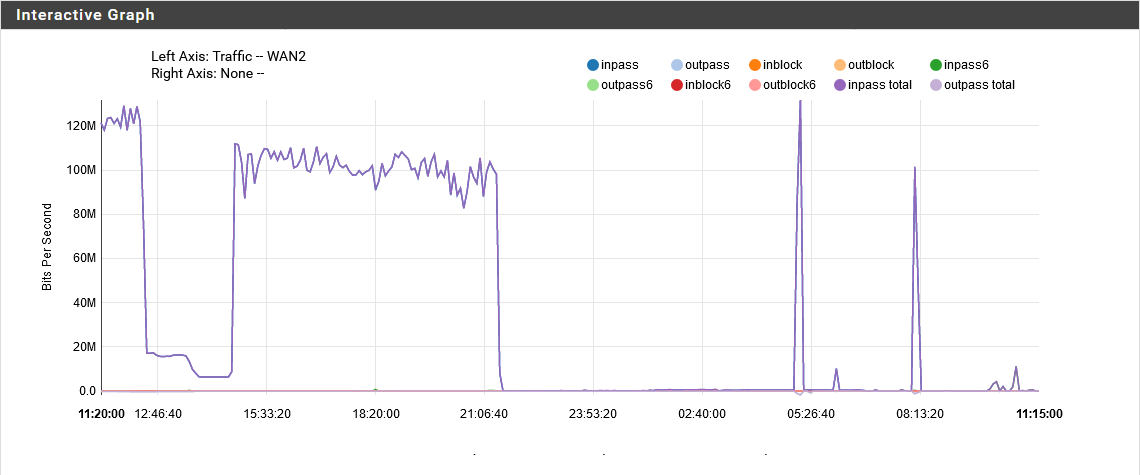
      The Upload from the time WAN2 was downloading with around 100 Mbit/s is also shown on the graph of WAN1.

      WAN1:
      WAN1 Traffic - Upload from WAN2 is shown

      WAN2:
      WAN2 Traffic - No upload is shown

      Vnstat does show the traffic on the correct interfaces.

      Shell Output - /usr/local/bin/vnstat -i igb0 -hg
       WAN1 (igb0)                                                              11:15
        ^                                                     r
        |                                                     r
        |                                                     r
        |                                                     r
        |                                                     r
        |                                                     r
        |  r                                                  r
        |  r                                                  r
        |  r  r                                r              r
        |  r  r                                r  r     r  r  r  r
       -+--------------------------------------------------------------------------->
        |  12 13 14 15 16 17 18 19 20 21 22 23 00 01 02 03 04 05 06 07 08 09 10 11
      
       h  rx (MiB)   tx (MiB)  ][  h  rx (MiB)   tx (MiB)  ][  h  rx (MiB)   tx (MiB)
      12    11453.5      272.1 ][ 20      184.1       74.6 ][ 04     3904.6      411.3
      13     7039.9      198.2 ][ 21      262.6       95.7 ][ 05    26821.9      559.7
      14     2044.4      114.6 ][ 22      528.5      112.7 ][ 06     3556.1      118.3
      15     1003.5      108.1 ][ 23      515.0       93.6 ][ 07     1862.8      117.9
      16      618.2       95.1 ][ 00     7122.6      181.4 ][ 08      257.6       90.9
      17      349.8       79.3 ][ 01     4451.7      133.5 ][ 09      118.4       63.8
      18      169.8       81.6 ][ 02     1557.7      116.0 ][ 10      194.6       81.4
      19      225.0       80.5 ][ 03     3479.7      154.2 ][ 11      655.6       32.2


      Shell Output - /usr/local/bin/vnstat -i igb1 -hg
       WAN2 (igb1)                                                              11:15
        ^           r
        |           r  r  r  r  r
        |           r  r  r  r  r  r
        |           r  r  r  r  r  r
        |           r  r  r  r  r  r
        |  r        r  r  r  r  r  r
        |  r        r  r  r  r  r  r
        |  r     r  r  r  r  r  r  r  r               t
        |  r     r  r  r  r  r  r  r  r            t  t  t  t  t  t
        |  r  r  r  r  r  r  r  r  r  r            t  t  t  t rt  t    r
       -+--------------------------------------------------------------------------->
        |  12 13 14 15 16 17 18 19 20 21 22 23 00 01 02 03 04 05 06 07 08 09 10 11
      
       h  rx (MiB)   tx (MiB)  ][  h  rx (MiB)   tx (MiB)  ][  h  rx (MiB)   tx (MiB)
      12    25026.2      832.6 ][ 20    41273.3     1378.0 ][ 04      331.1    13450.5
      13     5346.4      171.5 ][ 21    18097.4      633.0 ][ 05     8167.4    12963.6
      14    16928.4      638.9 ][ 22       57.8      127.8 ][ 06      585.1     9516.7
      15    45951.0     1631.2 ][ 23       91.5      426.6 ][ 07       65.1       25.7
      16    45490.7     1694.5 ][ 00       83.2      447.3 ][ 08     5470.0      111.1
      17    43936.7     1466.3 ][ 01      262.8     9209.8 ][ 09       65.1       25.0
      18    43905.7     1468.3 ][ 02      379.8    14401.4 ][ 10      862.6       40.3
      19    44302.4     1464.8 ][ 03      268.1    11841.9 ][ 11       24.4       16.1
      

      Does anyone experience the same behaviour?

      1 Reply Last reply Reply Quote 0
      • First post
        Last post

      Products

      • Platform Overview
      • TNSR
      • pfSense Plus
      • Appliances

      Services

      • Training
      • Professional Services

      Support

      • Subscription Plans
      • Contact Support
      • Product Lifecycle
      • Documentation

      News

      • Media Coverage
      • Press
      • Events

      Resources

      • Blog
      • FAQ
      • Find a Partner
      • Resource Library
      • Security Information

      Company

      • About Us
      • Careers
      • Partners
      • Contact Us
      • Legal
      Our Mission

      We provide leading-edge network security at a fair price - regardless of organizational size or network sophistication. We believe that an open-source security model offers disruptive pricing along with the agility required to quickly address emerging threats.

      Subscribe to our Newsletter

      Product information, software announcements, and special offers. See our newsletter archive to sign up for future newsletters and to read past announcements.

      © 2021 Rubicon Communications, LLC | Privacy Policy