Dashboard CPU usage = user util + nice util + system util + interrupt?
-
Hi all,
I am wondering how to read the Status/Monitoring System (CPU) "Interactive Graph". How does it relate to the dashboard CPU usage?Do I need to summarise the user util + nice util + system util + interrupt to get the dashboard CPU usage indicator? E.g. if user util = 7,83%, nice util = 30,99%, system util = 45,67% and interrupt = 0,92%, is the total CPU usage then 85,41%?
Reason I ask is that when I log on to my SG-1100, the dashboard shows a high CPU usage of at least 35%, going up to 45 - 55 while my network is not doing much.
When I log on twice (from 2 different computers), the CPU usage goes almost through the roof, presenting CPU loads between 60 and 90.
When move away from the dashboard and wait 10 minutes and open the Status/Monitoring page, the actual CPU usage appears to be very low.
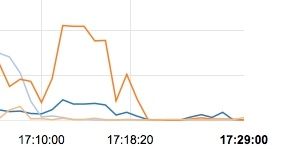
In docs.netgate I read this article about CPU graphs.
Processor Graph
The processor graph shows CPU usage for the firewall using the following data sources:
User Utilization
The amount of processor time consumed by user processes.Nice Utilization
The amount of processor time consumed by processes with a high priority.System Utilization
The amount of processor time consumed by the operating system and kernel.Interrupts
The amount of processor time consumed by interrupt handling, which is processing hardware input and output, including network interfaces.Processes
The number of running processes.