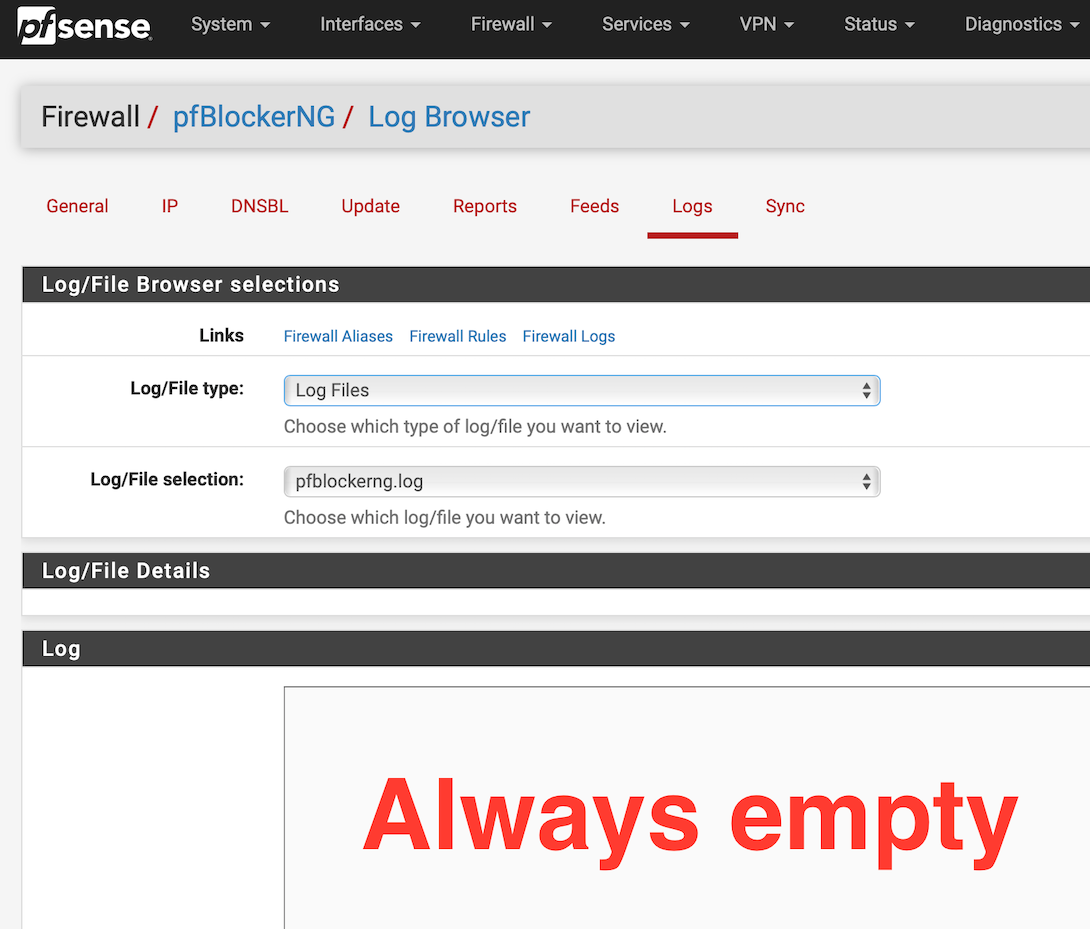
Log Browser always empty
-
@sebm You can view files with Diagnostics / Edit File tab.
You can also download File with the Diagnostics / Command Prompt tab.2.4.5-RELEASE-p1 (amd64)
Intel Core2 Quad CPU Q8400 @ 2.66GHz 8GB
Backup 0.5_5, Bandwidthd 0.7.4_4, Cron 0.3.7_5, pfBlockerNG-devel 3.0.0_16, Status_Traffic_Totals 2.3.1_1, System_Patches 1.2_5 -
@sebm said in Log Browser always empty:
Should I try a reboot?
FYI,
I did the unimaginable after a 120 days uptime: rebooted.
Same problem persists... -
@ronpfs said in Log Browser always empty:
@sebm You can view files with Diagnostics / Edit File tab.
You can also download File with the Diagnostics / Command Prompt tab.That's right my friend: I confirm I was able to open or download any files from the /var/log/pfblockerng/ folder using these two methods.
Is that your subtle way to say "forget about it", use a workaround?

-
@sebm What version of pfsense ? No disk full ?
-
@sebm said in Log Browser always empty:
Is that your subtle way to say "forget about it", use a workaround?
It's a way for you to inspect
 log files until @BBcan177 find time
  to read your post.
 -
@ronpfs said in Log Browser always empty:
@sebm What version of pfsense ? No disk full ?
pfSense 2.4.5-RELEASE-p1 (amd64)
pfBlockerNG-devel 3.0.0_5
I have 450GB of space left@ronpfs said in Log Browser always empty:
It's a way for you inspect
log files until @BBcan177 find time to read your post.It is what it is I suppose. I sure appreciate your time trying to help!
Should I try to install version 3.0.0_6?
-
As stated before, I have exactly the same problem. I am running
2.4.5-RELEASE-p1 (amd64)pfBlockerNG-devel net 3.0.0_3
which obviously needs updating to _5 or is it _6 now?
I can see all the log files in the /var directory and access them directly via the diagnostics / edit file, but not via the pfBlockerNG menus.
I am running on a PC Engines APU2 device with a relatively small SSD but I do not have much used disk space:
Disk usage:
/
8% of 11GiB - zfs
/tmp
0% of 10GiB - zfs
/var
8% of 11GiB - zfs
/zroot
0% of 10GiB - zfs
/var/run
5% of 3.4MiB - ufs in RAMThis is more annoying than anything else. PfBlocker is clearly working and the logs show nothing strange (at least to my eyes).
The tail of my pfblockerng.log reads ....
Database Sanity check [ PASSED ]
Masterfile/Deny folder uniq check
Deny folder/Masterfile uniq checkSync check (Pass=No IPs reported)
Alias table IP Counts
21104 total
21067 /var/db/aliastables/pfB_PRI1_v4.txt
37 /var/db/aliastables/pfB_PRI1_6_v6.txtpfSense Table Stats
table-entries hard limit 400000
Table Usage Count 139282UPDATE PROCESS ENDED [ 12/16/20 10:00:20 ]
-
And your seeing the same blank file section?

If not showing you which log file its trying to open or that is doesn't exist.. Points to reason being blank is its not trying to even open anything.
Could be a browser side problem..
An intelligent man is sometimes forced to be drunk to spend time with his fools
If you get confused: Listen to the Music Play
Please don't Chat/PM me for help, unless mod related
SG-4860 25.07.1 | Lab VMs 2.8.1, 25.07.1 -
@johnpoz said in Log Browser always empty:
Could be a browser side problem..
Note : I'm not seeing any issues.
It's the user, by selecting the "Log/File type" and then "Log/File selection" a fires a POST against the pfSense WebGUI/pfblockerng_log.php - ajax does it's job, and returns the info.
Nothings special, exactly the same thing is happening on the dashboard page (does your auto refresh work ?) , and other pfSense WebGUI pages.edit : even this forum.netgate.com is using ajax heavily, right now, while your reading and typing.
I tried some basic "ajax" debugging with my browser (Firefox) as they all have some 'web development' functionalities integrated.
Hit Shift-Ctrl-E to access the "network" part direcly.
It will show up at the bottom.
Now, open the Firewall > pfBlockerNG > Log Browser page.
Select your file.You will (should) see this at the bottom of the network-log-list-windows :

Clickint twice on this line will show the content being send from the webGUi to the browser (the file itself is base64 encoded).
/maxmind_ver|TWF4TWluZCBHZW9MaXRlMiBEYXRlL1RpbWUgU3RhbXAKTGFzdC1Nb2RpZmllZDogV2VkLCAwOSBEZWMgMjAyMCAxOTo0MDo1NSBHTVQKRHVwbGljYXRlIFJlcHJlc2VudGVkIElQNCBOZXR3b3JrczogNzgyNTUK|You see the same thing ?
-
@gertjan Not seeing any issues here either can not duplicate this problem. So its clearly not some issue in pfblocker that presents itself to everyone.
Since the logs are there.. And they can access them and they have info in them - I would look to see if browser related. Are you seeing the same issue on all browsers? Without any addons, etc.
I can not duplicate the problem - so its something specific to their setup, and since files are there and can be read - I would validate not a browser issue.
-
@johnpoz Yes I have that same blank section that was reported by sebM.
I normally use Safari, but get the same behaviour using Firefox.
-
@stepheng did you saw the 'interaction' I showed above ?
-
@gertjan I looked at the developer mode stuff (on both Safari and Firefox) and didn't see any traffic happening at all on the log page, beyond the initial load of the page.
Interestingly, on my rather old MacBook Pro, it doesn't work under Safari, but it does work correctly under Firefox.
... and as a third data point, it does work although a bit clunky on my iPad (it takes forever to load initially - one seems to need to give it some encouragement my selecting a different log file like the error.log and then it seems to work fine with the reload button.
I really don't know what it different about this iMac (running Catalina - it is probably the "cleanest" of my machines with the fewest add-ons and plug-ins as it is the newest and I've been very ruthless in not adding software that I don't think I actually need whereas my MacBookPro is about 10 years old and full of cruft.
I know that Safari can sometimes be a bit temperamental, but I've not seen anything quite of this nature before - I have seen the odd problem with CSS files being interpreted differently to other browsers. Firefox is my goto for such sites and I tend to use as my reference.
-
@stepheng The only 'native' Safari device I have, is an iPhone.
I used it's build in Safari to access the pfBlokcerNG-devel (3.0.0.6 now) logs and it was .... awkward.Managed to see 3 lines MaxMind logs, but had to change both log type and file somewhat randomly.
It's a browser issue.
-
Very browser related.
I gave up using Safari to read logs.
Firefox on my Mac works, or kind of... The trick is to first select "maxmind_ver" or "wizard" on the list and only then go to "dnsbl" or "ip_block" logs. Going straight to the last one doesn't work generally speaking.
-
@huskerdu said in Log Browser always empty:
Very browser related.
I gave up using Safari to read logs.
Firefox on my Mac works, or kind of... The trick is to first select "maxmind_ver" or "wizard" on the list and only then go to "dnsbl" or "ip_block" logs. Going straight to the last one doesn't work generally speaking.
Hey! I confirm the behavior.
I couldn't get anywhere with Safari.
But with Firefox, if I do that little "back and forth" between selected files as you described, it works... -
@sebm @HuskerDu @Gertjan Thanks for all the replies. It looks like we all have much the same experience that for whatever reason Safari does not play well with this, and even Firefox requires a bit of forward and back playing. I'm glad I'm not the only one!
As an occasional web developer, I'm always looking out for odd behaviours - some of which I can never quite get to the bottom of with some browser versions / OS version combinations, so I'm not entirely surprised.
-
Clicking like a maniac in Firefox is the solution. You can mark the topic as solved ;-).
-
Just bumping this thread to highlight that v3.0.0_7 (despite having changelog saying "2) Fix issues with Safari browser and log file selection") didn't fix my problem with Safari.
-
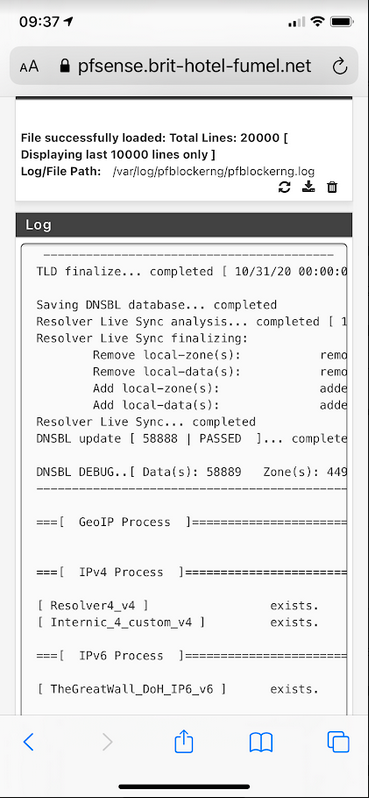
@sebm said in Log Browser always empty:
Safari browser
Desktop or iPad / iPhone (using iOS 14.3 ?)
Using my iPhone and Safari, after changing Log/File selection from "Clixk to select log fie" to, example, "pfblockerng.log", the file is shown :