WebUI hangs when WAN is down
-
pfSense 2.5.1-RELEASE
My WAN gateway/interface has been down most of today (provider issues), but when this happens the WebUI stops working (only exposed internally - not to external)
I can SSH into the console and use option 16 to restart PHP-FPM, and this allows the WebConsole to work for a little while (around 5 mins) and then it 'hangs' again. This is repeatable.
Crash Reporter is showing the following:
Crash report begins.  Anonymous machine information:

amd64
12.2-STABLE
FreeBSD 12.2-STABLE 1b709158e581(RELENG_2_5_0) pfSense

Crash report details:

PHP Errors:
[13-May-2021 13:55:37 Australia/Melbourne] PHP Parse error:  syntax error, unexpected end of file in /usr/local/sbin/pfSsh.php(374) : eval()'d code on line 6

No FreeBSD crash data found.
I can't see anything obvious in any of the logs - the only thing is system.log shows the following when I do the php-fpm restart:
May 13 16:56:27 fw nginx: 2021/05/13 16:56:27 [error] 7668#100167: *114017 kevent() reported about an closed connection (54: Connection reset by peer) while reading response header from upstream, client: 192.168.5.5, server: , request: "GET / HTTP/2.0", upstream: "fastcgi://unix:/var/run/php-fpm.socket:", host: "fw.my.lan:4443", referrer: "https://fw.my.lan:4443/"
May 13 16:56:27 fw nginx: 2021/05/13 16:56:27 [error] 7668#100167: *114017 kevent() reported about an closed connection (54: Connection reset by peer) while reading response header from upstream, client: 192.168.5.5, server: , request: "POST /getstats.php HTTP/2.0", upstream: "fastcgi://unix:/var/run/php-fpm.socket:", host: "fw.my.lan:4443", referrer: "https://fw.my.lan:4443/"
May 13 16:56:27 fw nginx: 2021/05/13 16:56:27 [error] 7668#100167: *114017 kevent() reported about an closed connection (54: Connection reset by peer) while reading response header from upstream, client: 192.168.5.5, server: , request: "GET /widgets/widgets/pfblockerng.widget.php?getNewWidget=1620888985196 HTTP/2.0", upstream: "fastcgi://unix:/var/run/php-fpm.socket:", host: "fw.my.lan:4443", referrer: "https://fw.my.lan:4443/"
May 13 16:56:30 fw rc.php-fpm_restart[96411]: >>> Restarting php-fpm
May 13 16:56:30 fw check_reload_status[97105]: check_reload_status is starting.
I also have a lot (like several per second constantly) of these messages in system.log now:
May 13 17:25:01 fw check_reload_status[97105]: Could not connect to /var/run/php-fpm.socket....and I've confirmed that the socket does still exist:
/root: ls -l /var/run/php-fpm.socket
srw-------  1 root  wheel  0 May 13 16:56 /var/run/php-fpm.socket
Anyone have any ideas where to look next or how to narrow down the cause?
-
@manicmoose WebGUI can be really sluggish when DNS is unavailable but it shouldn't just hang.
-
@kom Yeah, that's what I recall from reading some others' similar situations - but first it hangs, and then it times out with the Nginx "504 Gateway Time-out" error page.

-
What about asking what it's doing ?
You'll be needing the access that works when the GUI doesn't.
That will be be the console, or enable SSH.
Login using the console or SSH.
On the console menu, use option 8.Because you want details, I advise you to use (and install first) 'htop'.
Google tell you what 'htop' is and why it's superiour to 'top', already present on pfSense.
So :pkg install htopBtw : htop is part of the pfSense FreeBSD package build.
It's not a pfSense Package like the ones that 'mod' the GUI. It's just a very lnown command line tool.When done - and yes, WAN should work for this to install, just type
htopNow, with your browser, login to pfSense.
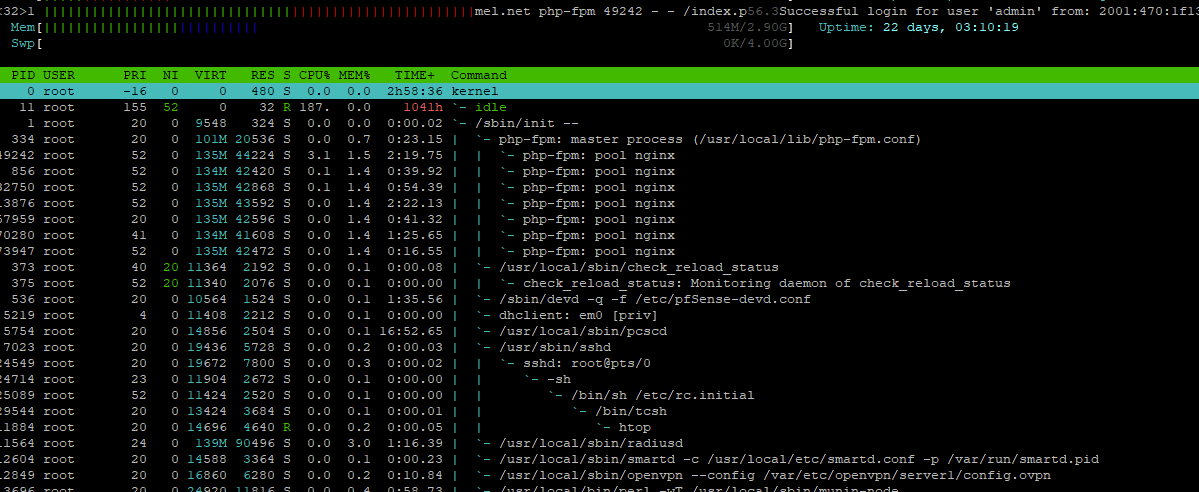
You'll be seeing stuff like this :

Under the top line "/sbin/init -- php-fpm you see several php-fpm instances.
One of them will handle the login, and show quickly what php is doing : what files are used and when.This can help you to determine why it's waiting - and thus for what.
But, as @KOM said, when you login after some time, it will referesh the list with avaible packages, and do some other 'house keeping maintenance stuff'. The GUI will be suing, amongst others, use DNS, and DNS will time out because the uplink is dead.
Eventually, 10 or 20 seconds later, it will continue to the main dashboard page, using older, already cached data. -
@gertjan Sadly I don't have htop installed, and with WAN down that makes it tricky.
However, as mentioned - the dashboard doesn't appear - in fact it doesn't matter which screen I was on beforehand, it still just fails with the Nginx error:
Nothing else on the page but that.

-
The build in 'top' could be used.
Also, while you have the console open, use option 11. -
@gertjan I figured it out with 'ps'
[2.5.1-RELEASE][admin@fw.my.lan]/root: ps -adux | grep php-fpm
root     6327   0.0  0.0   11188   2688  1  S+   23:37       0:00.00 |       `-- grep php-fpm
root    95835   0.0  0.4  104164  33660  -  Ss   22:33       0:00.07 |-- php-fpm: master process (/usr/local/lib/php-fpm.conf) (php-fpm)
root     5848   0.0  0.5  106212  42872  -  I    22:34       0:00.01 | |-- php-fpm: pool nginx (php-fpm)
root    12543   0.0  0.5  106212  42876  -  I    22:36       0:00.01 | |-- php-fpm: pool nginx (php-fpm)
root    15542   0.0  0.5  106212  42876  -  I    22:34       0:00.01 | |-- php-fpm: pool nginx (php-fpm)
root    23468   0.0  0.5  106212  42876  -  I    22:36       0:00.01 | |-- php-fpm: pool nginx (php-fpm)
root    25149   0.0  0.5  106212  42880  -  I    22:36       0:00.01 | |-- php-fpm: pool nginx (php-fpm)
root    31488   0.0  0.5  106212  42876  -  I    22:35       0:00.01 | |-- php-fpm: pool nginx (php-fpm)
root    95858   0.0  0.6  109108  45696  -  I    22:33       0:00.73 | |-- php-fpm: pool nginx (php-fpm)
root    96167   0.0  0.5  106488  44260  -  I    22:33       0:00.28 | `-- php-fpm: pool nginx (php-fpm)
....and yeah - already tried 'option 11'....didn't help, sadly.