SG 1100 runaway memory usage
-
So it spikes suddenly from 25% to 93%?
Check the Status > Monitorng Graphs.
Steve
-
@stephenw10 Processes 131
(But I must confess, I don't know what I'm looking at)
-
Change that graph to System > Memory. Like:
If you have a leak it will be ramping up slowly.
Steve
-
@stephenw10 Ah brilliant! Got it, thanks
-
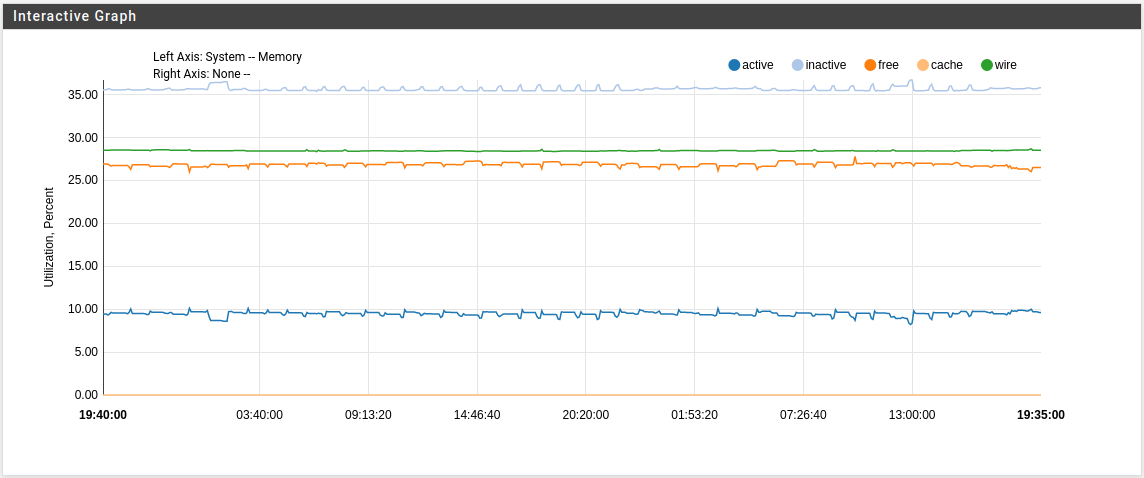
@csfshore This is what I look like, and it was around 9am when I had to reboot as I was at 93% utilized
I'll keep watching this
-
Hmm, not ideal!
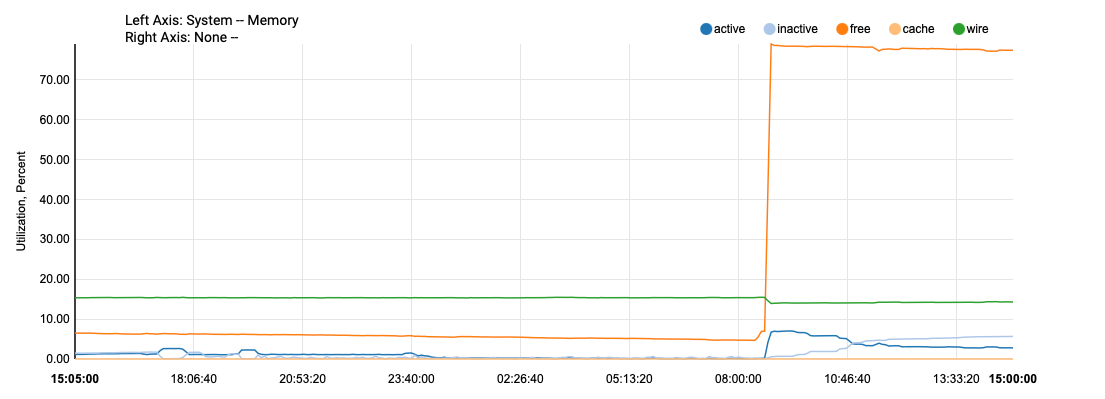
So free memory just drops slowly over some days? You can change the time base to see it more clearly.
And services actually fail when it gets that low? Anything logged?Steve
-
@stephenw10 I don't know what to look for in the logs.
Since my posted graph, free memory is (gently)
trending downward.I'm not sure if any services actually fail. However, once
memory usage gets to 93%, I can't access the network.I will keep an eye on the graph, and as a rough estimate
in about a week, system will be unusable without a reboot.Any guidance as to what to look for most appreciated.
Appreciate your responses. Thanks -
If things stop responding I would expect some pretty obvious errors in the logs.
It could be that it stops logging entirely however.
Steve
-
@stephenw10 OK, I'll look there, thanks
-
@csfshore As this doesn't appear pervasive, it must be something in my config. (Which is vanilla, honest
 )
)When new release 21.09 is out, I will take it down to the bare metal and reinstall, unless I can figure out anything from the logs.