Express VPN setup still says Your IP address is currently exposed
-
PFsense doesn't appear to be routing through the VPN. The status shows online. Any one set this up with success? I want all local traffic to route through the VPN. I tried to post the link to the guide and kept getting flagged for spam
-
How exactly is it reporting your IP address is exposed?
You are routing all traffic over the VPN? Including traffic from the firewall itself?
Steve
-
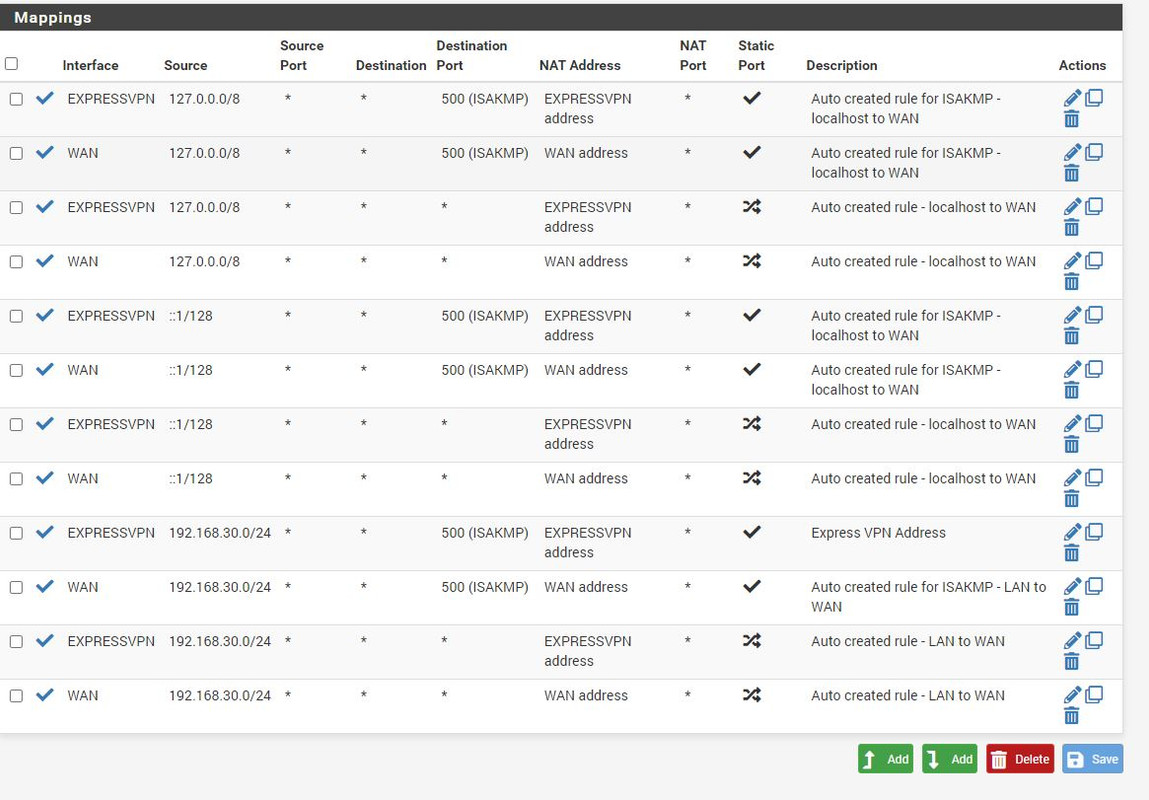
I got it to finally work with this setup Until I reboot the Pfsense and turn turn of "disabled hardware cheksum offload. Is this correct if I want all of my network 192.168.30.x to be routed through the VPN?
Mappings:
Rules:
-
Enabling or disabling checksum offload would not make any difference to the traffic routing.
Those screenshots look OK, assuming your LAN is 192.168.30.0/24 and you don't have any other internal subnets.
Also assuming the 'Local_Subnets' alias contains 192.168.30.0/24.What gateways are in the the 'Express_VPN_Gateway_Group' and what sort of group is it? Failover?
What are clients using for DNS? You are forcing all traffic over the VPN there so I assume you are passing a public DNS server to them or using ExpressVPN's DNS.
Steve
-
@sentinelace said in Express VPN setup still says Your IP address is currently exposed:
PFsense doesn't appear to be routing through the VPN. The status shows online. Any one set this up with success? I want all local traffic to route through the VPN. I tried to post the link to the guide and kept getting flagged for spam
Instructions on how to configure pfSense are wrong on ExpressVPN website.
Go to VPN / OpenVPN / Clients and edit your VPN settings. Make sure that "Don't pull routes" option is unchecked like this:

I wrote to ExpressVPN and told them to make correction to their instructions, but they dont care.
-
Generally you don't want to pull routes from the server because they will be passing a new default route. It's almost always better to route only the traffic you need to over the VPN.
Steve
-
@stephenw10 said in Express VPN setup still says Your IP address is currently exposed:
Generally you don't want to pull routes from the server because they will be passing a new default route. It's almost always better to route only the traffic you need to over the VPN.
Steve
I want to route ALL traffic through VPN, and with this option enabled, my traffic goes around VPN no matter what i do.
-
You can still policy route traffic via the OpenVPN gateway without pulling a new default route from the server. That is the correct way to do it IMO.
Steve
-
@stephenw10 said in Express VPN setup still says Your IP address is currently exposed:
You can still policy route traffic via the OpenVPN gateway without pulling a new default route from the server. That is the correct way to do it IMO.
Steve
Ill go through section 18.8 again to get some more understanding, and then ill try it.
-
@stephenw10 Mine is working but the bandwidth is terrible when I route the traffic through OpenVPN. If I stop the service I get all the bandwidth from my carrier. When on, I get 1/4. Is this a rule or policy issue or is OpenVPN with expressvpn not the best solution here?
-
@sentinelace said in Express VPN setup still says Your IP address is currently exposed:
Is this a rule or policy issue or is OpenVPN with expressvpn not the best solution here?
You will never be able to answer that question.
To be sure what solution = what provider, is best at any moment, it means you have to use all of them. Maybe not the one with a point of presence is 'Singapore', but at least all with a POP nearby to you. And that's very €++/$++.
And complicated to set up.Other factors are : encryption capabilities on both side of the tunnel.
The VPN server you connect to is shared among many users. If, for example, 20 users are connected to a 1Gbits/sec VPN server, at best, every user will get 50 Mbit/sec.
More likely is that this isn't the case, that we are more then 100 for each server .. 'we' can't know that.
Anyway, VPN provider do not communicates who is on what POP and how many etc.$xpr$ssvpn has many POP : take another one ?
And yes, at that moment ,another VPN provider can deliver more bang for the bucks.
And this will changes the next day .... Welcome to the eternal "who is better" game.Use a VPN provider as a 'hide my IP' facility, and not a fast access provider. They can deliver on one promise, rarely both, because, after all, why would they ?
Keep in mind that the VPN provider doesn't control everything. If the datacenter, where the POP is located, has a bad peering at that moment, speed loss wouldn't be there fault.Btw : the perfect solution exist :
Depending on your needs, join up with a small group of people, like 20 or 50.
One for every country.
One or two "tech guys" rent a small VPS in a data center in every country.
A minimal Debian OS and OpenVPN and your good. If between 20 and 50 persons join your club, you will have a very decent VPN provider == yourself ^^ The cost will be like a couple of $ a month, or even less. -
What bandwidth are you actually seeing? What do you see without the VPN?
What hardware are you running it on?
Encrypting/decrypting traffic is usually the most CPU intensive thing a firewall can be asked to do. It's usually a CPU limitation. OpenVPN is single threaded so it can only use CPU core.
There is probably some tuning you could do to increase the speed if that is the case.Steve
-
@stephenw10 Is there a config dump that shows the hardware? I have a Protectli Vault 4 Port which was $320. Could my route be incorrect causing more load?
ON vpn speed: 100/5
Off VPN: 940/30
-
Run at the command line while you are testing:
top -aSHMake sure you are not hitting 100% CPU on one core.
It will say what CPU you have on the dashboard or in the system logs at boot. However you might have the Celeron J1900 which has pretty poor single thread performance.
Steve
-
Run the proposed
top -aSHon the console, during a maximum VPN file upload/download transfer.
-
@gertjan said in Express VPN setup still says Your IP address is currently exposed:
Run the proposed
top -aSHon the console, during a maximum VPN file upload/download transfer.
last pid: 94068; load averages: 0.11, 0.14, 0.10 up 11+05:20:09 19:53:21 CPU: 0.0% user, 0.0% nice, 0.4% system, 0.0% interrupt, 99.6% idle Mem: 18M Active, 331M Inact, 340M Wired, 140K Buf, 1135M Free ARC: 113M Total, 32M MFU, 77M MRU, 32K Anon, 616K Header, 3812K Other 51M Compressed, 126M Uncompressed, 2.47:1 Ratio Swap: 2048M Total, 2048M Free 21 root -16 - 0B 16K pftm 2 4:31 0.03% [pf purge] 12 root -60 - 0B 272K WAIT 1 4:22 0.03% [intr{swi4: clock (0)}] 8012 root 20 0 14M 2656K nanslp 0 0:23 0.01% /usr/local/bin/dpinger -S -r 0 -i WAN_DHCP -B 74.132.83.66 -p /var/run/dpinger_WAN_DHCP~74.132.83.66~74.132.80.1.pid -u /var/run/dpinger_WAN_DHCP~74.132.83.66~74.132 73376 root 20 0 18M 6760K select 2 0:55 0.01% /usr/local/sbin/ntpd -g -c /var/etc/ntpd.conf -p /var/run/ntpd.pid{ntpd} 8012 root 20 0 14M 2656K sbwait 2 0:09 0.00% /usr/local/bin/dpinger -S -r 0 -i WAN_DHCP -B 74.132.83.66 -p /var/run/dpinger_WAN_DHCP~74.132.83.66~74.132.80.1.pid -u /var/run/dpinger_WAN_DHCP~74.132.83.66~74.132 345 root 20 0 102M 27M kqread 3 0:26 0.00% php-fpm: master process (/usr/local/lib/php-fpm.conf) (php-fpm) 13963 _dhcp 20 0 11M 2620K select 1 0:00 0.00% dhclient: em0 (dhclient) 8012 root 20 0 14M 2656K nanslp 1 0:04 0.00% /usr/local/bin/dpinger -S -r 0 -i WAN_DHCP -B 74.132.83.66 -p /var/run/dpinger_WAN_DHCP~74.132.83.66~74.132.80.1.pid -u /var/run/dpinger_WAN_DHCP~74.132.83.66~74.132 27 root -16 - 0B 16K vlruwt 1 0:05 0.00% [vnlru] 25 root -16 - 0B 32K - 1 0:04 0.00% [bufdaemon{bufspacedaemon-0}] 0 root -76 - 0B 704K - 0 0:01 0.00% [kernel{softirq_0}] 29 root -12 - 0B 5120K - 0 6:13 0.00% [zpool-pfSense{zio_write_issue_0}] 12 root -88 - 0B 272K WAIT 0 2:58 0.00% [intr{irq256: ahci0}] 29 root -16 - 0B 5120K - 2 0:56 0.00% [zpool-pfSense{zio_null_issue}] 19 root -8 - 0B 608K - 2 0:32 0.00% [zfskern{dp_sync_taskq_2}] 38157 unbound 20 0 62M 28M kqread 1 0:29 0.00% /usr/local/sbin/unbound -c /var/unbound/unbound.conf{unbound} 29 root -16 - 0B 5120K - 0 0:13 0.00% [zpool-pfSense{zio_write_intr_4_6}] last pid: 94068; load averages: 0.11, 0.14, 0.10 up 11+05:20:11 19:53:23 CPU: 0.0% user, 0.0% nice, 0.6% system, 0.0% interrupt, 99.4% idle Mem: 18M Active, 331M Inact, 340M Wired, 140K Buf, 1135M Free ARC: 113M Total, 32M MFU, 77M MRU, 32K Anon, 616K Header, 3812K Other 51M Compressed, 126M Uncompressed, 2.47:1 Ratio Swap: 2048M Total, 2048M Free 12 root -60 - 0B 272K WAIT 0 4:22 0.03% [intr{swi4: clock (0)}] 6209 root 20 0 211M 199M nanslp 0 4:50 0.03% /usr/local/sbin/pcscd{pcscd} 29 root -8 - 0B 5120K tx->tx 3 4:24 0.01% [zpool-pfSense{txg_thread_enter}] 8012 root 20 0 14M 2656K nanslp 0 0:23 0.01% /usr/local/bin/dpinger -S -r 0 -i WAN_DHCP -B 74.132.83.66 -p /var/run/dpinger_WAN_DHCP~74.132.83.66~74.132.80.1.pid -u /var/run/dpinger_WAN_DHCP~74.132.83.66~74.132 81400 root 20 0 11M 2420K select 0 1:48 0.01% /usr/local/sbin/radvd -p /var/run/radvd.pid -C /var/etc/radvd.conf -m syslog 8012 root 20 0 14M 2656K sbwait 2 0:09 0.00% /usr/local/bin/dpinger -S -r 0 -i WAN_DHCP -B 74.132.83.66 -p /var/run/dpinger_WAN_DHCP~74.132.83.66~74.132.80.1.pid -u /var/run/dpinger_WAN_DHCP~74.132.83.66~74.132 345 root 20 0 102M 27M kqread 1 0:26 0.00% php-fpm: master process (/usr/local/lib/php-fpm.conf) (php-fpm) 32110 root 20 0 12M 3108K bpf 2 1:36 0.00% /usr/local/sbin/filterlog -i pflog0 -p /var/run/filterlog.pid 8012 root 20 0 14M 2656K nanslp 3 0:04 0.00% /usr/local/bin/dpinger -S -r 0 -i WAN_DHCP -B 74.132.83.66 -p /var/run/dpinger_WAN_DHCP~74.132.83.66~74.132.80.1.pid -u /var/run/dpinger_WAN_DHCP~74.132.83.66~74.132 29 root -12 - 0B 5120K - 0 6:13 0.00% [zpool-pfSense{zio_write_issue_0}] 29 root -12 - 0B 5120K - 2 6:13 0.00% [zpool-pfSense{zio_write_issue_2}] 12 root -88 - 0B 272K WAIT 0 2:58 0.00% [intr{irq256: ahci0}] 29 root -16 - 0B 5120K - 2 0:56 0.00% [zpool-pfSense{zio_null_issue}] 54732 root 52 20 11M 2908K wait 1 0:53 0.00% /bin/sh /var/db/rrd/updaterrd.sh 19 root -8 - 0B 608K - 1 0:32 0.00% [zfskern{dp_sync_taskq_1}] 19 root -8 - 0B 608K - 2 0:32 0.00% [zfskern{dp_sync_taskq_2}] 38157 unbound 20 0 62M 28M kqread 1 0:29 0.00% /usr/local/sbin/unbound -c /var/unbound/unbound.conf{unbound} last pid: 94068; load averages: 0.10, 0.14, 0.10 up 11+05:20:13 19:53:25 CPU: 0.0% user, 0.0% nice, 1.1% system, 0.0% interrupt, 98.9% idle Mem: 18M Active, 331M Inact, 340M Wired, 140K Buf, 1135M Free ARC: 113M Total, 32M MFU, 77M MRU, 32K Anon, 616K Header, 3812K Other 51M Compressed, 126M Uncompressed, 2.47:1 Ratio Swap: 2048M Total, 2048M Free 12 root -60 - 0B 272K WAIT 2 4:22 0.03% [intr{swi4: clock (0)}] 6209 root 20 0 211M 199M nanslp 2 4:50 0.03% /usr/local/sbin/pcscd{pcscd} 41094 root 20 0 20M 9244K select 3 0:00 0.01% sshd: root@pts/0 (sshd) 8012 root 20 0 14M 2656K nanslp 1 0:23 0.01% /usr/local/bin/dpinger -S -r 0 -i WAN_DHCP -B 74.132.83.66 -p /var/run/dpinger_WAN_DHCP~74.132.83.66~74.132.80.1.pid -u /var/run/dpinger_WAN_DHCP~74.132.83.66~74.132 23 root -16 - 0B 48K psleep 0 1:00 0.01% [pagedaemon{dom0}] 73376 root 20 0 18M 6760K select 2 0:55 0.01% /usr/local/sbin/ntpd -g -c /var/etc/ntpd.conf -p /var/run/ntpd.pid{ntpd} 8012 root 20 0 14M 2656K sbwait 2 0:09 0.00% /usr/local/bin/dpinger -S -r 0 -i WAN_DHCP -B 74.132.83.66 -p /var/run/dpinger_WAN_DHCP~74.132.83.66~74.132.80.1.pid -u /var/run/dpinger_WAN_DHCP~74.132.83.66~74.132 345 root 20 0 102M 27M kqread 3 0:26 0.00% php-fpm: master process (/usr/local/lib/php-fpm.conf) (php-fpm) 6209 root 20 0 211M 199M select 1 0:15 0.00% /usr/local/sbin/pcscd{pcscd} 8012 root 20 0 14M 2656K nanslp 2 0:04 0.00% /usr/local/bin/dpinger -S -r 0 -i WAN_DHCP -B 74.132.83.66 -p /var/run/dpinger_WAN_DHCP~74.132.83.66~74.132.80.1.pid -u /var/run/dpinger_WAN_DHCP~74.132.83.66~74.132 12 root -88 - 0B 272K WAIT 0 2:58 0.00% [intr{irq256: ahci0}] 81400 root 20 0 11M 2420K select 0 1:48 0.00% /usr/local/sbin/radvd -p /var/run/radvd.pid -C /var/etc/radvd.conf -m syslog 29 root -16 - 0B 5120K - 2 0:56 0.00% [zpool-pfSense{zio_null_issue}] 19 root -8 - 0B 608K - 2 0:32 0.00% [zfskern{dp_sync_taskq_2}] 38157 unbound 20 0 62M 28M kqread 1 0:29 0.00% /usr/local/sbin/unbound -c /var/unbound/unbound.conf{unbound} 38157 unbound 20 0 62M 28M kqread 0 0:24 0.00% /usr/local/sbin/unbound -c /var/unbound/unbound.conf{unbound} 29 root -16 - 0B 5120K - 2 0:13 0.00% [zpool-pfSense{zio_write_intr_7_6}] 29 root -16 - 0B 5120K - 0 0:13 0.00% [zpool-pfSense{zio_write_intr_0_8}] last pid: 94068; load averages: 0.10, 0.14, 0.10 up 11+05:20:14 19:53:26 CPU: 0.1% user, 0.0% nice, 2.2% system, 0.0% interrupt, 97.6% idle Mem: 18M Active, 331M Inact, 340M Wired, 140K Buf, 1135M Free ARC: 113M Total, 32M MFU, 77M MRU, 32K Anon, 616K Header, 3812K Other 51M Compressed, 126M Uncompressed, 2.47:1 Ratio Swap: 2048M Total, 2048M Free 0 root -76 - 0B 704K - 3 8:48 0.06% [kernel{if_config_tqg_0}] 21 root -16 - 0B 16K pftm 2 4:31 0.02% [pf purge] 8012 root 20 0 14M 2656K nanslp 3 0:23 0.01% /usr/local/bin/dpinger -S -r 0 -i WAN_DHCP -B 74.132.83.66 -p /var/run/dpinger_WAN_DHCP~74.132.83.66~74.132.80.1.pid -u /var/run/dpinger_WAN_DHCP~74.132.83.66~74.132 44371 dhcpd 20 0 22M 11M select 1 0:20 0.01% /usr/local/sbin/dhcpd -user dhcpd -group _dhcp -chroot /var/dhcpd -cf /etc/dhcpd.conf -pf /var/run/dhcpd.pid em1 23 root -16 - 0B 48K psleep 3 1:00 0.01% [pagedaemon{dom0}] 8012 root 20 0 14M 2656K sbwait 2 0:09 0.00% /usr/local/bin/dpinger -S -r 0 -i WAN_DHCP -B 74.132.83.66 -p /var/run/dpinger_WAN_DHCP~74.132.83.66~74.132.80.1.pid -u /var/run/dpinger_WAN_DHCP~74.132.83.66~74.132 345 root 20 0 102M 27M kqread 3 0:26 0.00% php-fpm: master process (/usr/local/lib/php-fpm.conf) (php-fpm) 8012 root 20 0 14M 2656K nanslp 0 0:04 0.00% /usr/local/bin/dpinger -S -r 0 -i WAN_DHCP -B 74.132.83.66 -p /var/run/dpinger_WAN_DHCP~74.132.83.66~74.132.80.1.pid -u /var/run/dpinger_WAN_DHCP~74.132.83.66~74.132 19 root -8 - 0B 608K t->zth 1 0:05 0.00% [zfskern{solthread 0xfffffff}] 29 root -12 - 0B 5120K - 0 6:13 0.00% [zpool-pfSense{zio_write_issue_0}] 29 root -12 - 0B 5120K - 2 6:13 0.00% [zpool-pfSense{zio_write_issue_2}] 12 root -88 - 0B 272K WAIT 0 2:58 0.00% [intr{irq256: ahci0}] 29 root -16 - 0B 5120K - 2 0:56 0.00% [zpool-pfSense{zio_null_issue}] 54732 root 52 20 11M 2908K wait 1 0:53 0.00% /bin/sh /var/db/rrd/updaterrd.sh 19 root -8 - 0B 608K - 2 0:32 0.00% [zfskern{dp_sync_taskq_2}] 38157 unbound 20 0 62M 28M kqread 1 0:29 0.00% /usr/local/sbin/unbound -c /var/unbound/unbound.conf{unbound} -
You need to run that exact command at the command line. You should see output like this:
last pid:  8463;  load averages:  0.47,  0.30,  0.26                                                             up 22+11:06:19  01:52:50
209 threads:   5 running, 183 sleeping, 21 waiting
CPU:  0.0% user,  0.3% nice,  0.2% system,  0.0% interrupt, 99.5% idle
Mem: 179M Active, 681M Inact, 529M Wired, 160M Buf, 466M Free
Swap: 978M Total, 978M Free

  PID USERNAME    PRI NICE   SIZE    RES STATE    C   TIME    WCPU COMMAND
   11 root        155 ki31     0B    64K CPU2     2 528.7H 100.00% [idle{idle: cpu2}]
   11 root        155 ki31     0B    64K CPU1     1 529.4H  99.73% [idle{idle: cpu1}]
   11 root        155 ki31     0B    64K RUN      3 527.8H  99.68% [idle{idle: cpu3}]
   11 root        155 ki31     0B    64K CPU0     0 528.7H  99.21% [idle{idle: cpu0}]
74058 root         41   20   468M   420M uwait    2 574:15   1.47% /usr/local/bin/suricata -i igb1 -D -c /usr/local/etc/suricata/suricata
    0 root        -76    -     0B   576K -        3  62:45   0.17% [kernel{if_config_tqg_0}]
74058 root         40   20   468M   420M nanslp   3  48:49   0.16% /usr/local/bin/suricata -i igb1 -D -c /usr/local/etc/suricata/suricata
66889 root         20    0    10M  2320K select   3  17:54   0.14% /usr/sbin/powerd -b hadp -a hadp -n hadp
 8463 root         21    0    13M  4096K CPU3     3   0:00   0.11% top -aSH
   12 root        -60    -     0B   336K WAIT     1  30:35   0.05% [intr{swi4: clock (0)}]
   23 root        -16    -     0B    16K -        3  27:13   0.05% [rand_harvestq]
   20 root        -16    -     0B    16K pftm     2  26:54   0.03% [pf purge]
76315 root         20    0    19M  6532K select   3   6:22   0.02% /usr/local/sbin/ntpd -g -c /var/etc/ntpd.conf -p /var/run/ntpd.pid{ntp
   24 root        -16    -     0B    48K psleep   2   8:21   0.02% [pagedaemon{dom0}]
71016 root         20    0    14M  2812K nanslp   3   6:20   0.02% /usr/local/bin/dpinger -S -r 0 -i WAN_DHCP -B 172.21.16.16 -p /var/run
71248 root         20    0    16M  2848K nanslp   0   6:00   0.02% /usr/local/bin/dpinger -S -r 0 -i VTI0_VTIV4 -B 10.66.11.1 -p /var/run
    0 root        -76    -     0B   576K -        0  10:40   0.01% [kernel{if_io_tqg_0}]
56802 root         20    0    68M    19M uwait    0   0:17   0.01% /usr/local/libexec/ipsec/charon --use-syslog{charon}
70011 dhcpd        20    0    22M    12M select   0   4:33   0.01% /usr/local/sbin/dhcpd -user dhcpd -group _dhcp -chroot /var/dhcpd -cf
 5979 root         20    0    11M  2824K select   2   2:44   0.01% /usr/sbin/syslogd -s -c -c -l /var/dhcpd/var/run/log -P /var/run/syslo
    0 root        -76    -     0B   576K -        2   8:33   0.01% [kernel{if_io_tqg_2}]
   26 root        -16    -     0B    48K qsleep   2   4:57   0.01% [bufdaemon{bufdaemon}]
Specifically you can see the per core idle processes to see how the load is spread.
In your output above there is virtually no load. Were you actually testing the VPN when those were taken?Steve
-
[2.5.2-RELEASE][root@PFrouter.Network.private]/root: top -aSH last pid: 13303; load averages: 0.08, 0.07, 0.04 up 11+06:23:13 20:56:25 523 threads: 5 running, 501 sleeping, 17 waiting CPU: 0.2% user, 0.1% nice, 1.0% system, 0.0% interrupt, 98.7% idle Mem: 17M Active, 331M Inact, 340M Wired, 140K Buf, 1136M Free ARC: 113M Total, 32M MFU, 77M MRU, 184K Anon, 618K Header, 3804K Other 51M Compressed, 126M Uncompressed, 2.48:1 Ratio Swap: 2048M Total, 2048M Free PID USERNAME PRI NICE SIZE RES STATE C TIME WCPU COMMAND 11 root 155 ki31 0B 64K CPU1 1 267.8H 100.00% [idle{idle: cpu1}] 11 root 155 ki31 0B 64K RUN 2 267.3H 100.00% [idle{idle: cpu2}] 11 root 155 ki31 0B 64K CPU0 0 266.5H 100.00% [idle{idle: cpu0}] 11 root 155 ki31 0B 64K CPU3 3 265.8H 100.00% [idle{idle: cpu3}] 0 root -76 - 0B 704K - 3 215:50 1.46% [kernel{if_io_tqg_3}] 0 root -76 - 0B 704K - 1 81:29 0.29% [kernel{if_io_tqg_1}] 0 root -76 - 0B 704K - 0 10:28 0.00% [kernel{if_io_tqg_0}] 0 root -76 - 0B 704K - 2 8:51 0.00% [kernel{if_config_tqg_0}] 0 root -76 - 0B 704K - 2 7:53 0.00% [kernel{if_io_tqg_2}] 22 root -16 - 0B 16K - 3 6:49 0.00% [rand_harvestq] 29 root -12 - 0B 5120K - 2 6:15 0.00% [zpool-pfSense{zio_write_issue_0}] 29 root -12 - 0B 5120K - 0 6:15 0.00% [zpool-pfSense{zio_write_issue_1}] 29 root -12 - 0B 5120K - 1 6:14 0.00% [zpool-pfSense{zio_write_issue_2}] 6209 root 20 0 212M 199M nanslp 2 4:51 0.00% /usr/local/sbin/pcscd{pcscd} 21 root -16 - 0B 16K pftm 0 4:32 0.00% [pf purge] 29 root -8 - 0B 5120K tx->tx 0 4:25 0.00% [zpool-pfSense{txg_thread_enter}] 12 root -60 - 0B 272K WAIT 0 4:23 0.00% [intr{swi4: clock (0)}] 12 root -88 - 0B 272K WAIT 0 2:58 0.00% [intr{irq256: ahci0}] 81400 root 20 0 11M 2420K select 0 1:48 0.00% /usr/local/sbin/radvd -p /var/run/radvd.pid -C /var/etc/radvd.conf -m syslog 32110 root 20 0 12M 3108K bpf 2 1:36 0.00% /usr/local/sbin/filterlog -i pflog0 -p /var/run/filterlog.pid 77899 root 20 0 11M 2620K select 1 1:24 0.00% /usr/sbin/syslogd -s -c -c -l /var/dhcpd/var/run/log -P /var/run/syslog.pid -f /etc/syslog.conf 23 root -16 - 0B 48K psleep 2 1:00 0.00% [pagedaemon{dom0}] 29 root -16 - 0B 5120K - 2 0:56 0.00% [zpool-pfSense{zio_null_issue}] 73376 root 20 0 18M 6760K select 2 0:55 0.00% /usr/local/sbin/ntpd -g -c /var/etc/ntpd.conf -p /var/run/ntpd.pid{ntpd} 54732 root 52 20 11M 2908K wait 1 0:53 0.00% /bin/sh /var/db/rrd/updaterrd.sh 25 root -16 - 0B 32K qsleep 1 0:36 0.00% [bufdaemon{bufdaemon}] 19 root -8 - 0B 608K - 0 0:32 0.00% [zfskern{dp_sync_taskq_1}] 19 root -8 - 0B 608K - 3 0:32 0.00% [zfskern{dp_sync_taskq_0}] 19 root -8 - 0B 608K - 2 0:32 0.00% [zfskern{dp_sync_taskq_2}] 38157 unbound 20 0 62M 28M kqread 2 0:30 0.00% /usr/local/sbin/unbound -c /var/unbound/unbound.conf{unbound} 345 root 20 0 102M 27M kqread 2 0:26 0.00% php-fpm: master process (/usr/local/lib/php-fpm.conf) (php-fpm) 38157 unbound 20 0 62M 28M kqread 0 0:24 0.00% /usr/local/sbin/unbound -c /var/unbound/unbound.conf{unbound} 8012 root 20 0 14M 2656K nanslp 0 0:23 0.00% /usr/local/bin/dpinger -S -r 0 -i WAN_DHCP -B 74.132.83.66 -p /var/run/dpinger_WAN_DHCP~74.132.83.66~74.132.80.1.pid -u /var/run/dpinger_WAN_DHCP~74.132.83.66~74.132 0 root -16 - 0B 704K swapin 0 0:21 0.00% [kernel{swapper}] 44371 dhcpd 20 0 22M 11M select 1 0:21 0.00% /usr/local/sbin/dhcpd -user dhcpd -group _dhcp -chroot /var/dhcpd -cf /etc/dhcpd.conf -pf /var/run/dhcpd.pid em1 19 root -8 - 0B 608K spa->s 1 0:19 0.00% [zfskern{trim pfSense}] 6209 root 20 0 212M 199M select 2 0:15 0.00% /usr/local/sbin/pcscd{pcscd} 29 root -16 - 0B 5120K - 1 0:14 0.00% [zpool-pfSense{zio_write_intr_5_6}] 29 root -16 - 0B 5120K - 3 0:14 0.00% [zpool-pfSense{zio_write_intr_6_9}] 29 root -16 - 0B 5120K - 0 0:13 0.00% [zpool-pfSense{zio_write_intr_7_6}] 29 root -16 - 0B 5120K - 2 0:13 0.00% [zpool-pfSense{zio_write_intr_1_9}] 29 root -16 - 0B 5120K - 1 0:13 0.00% [zpool-pfSense{zio_write_intr_4_6}] 29 root -16 - 0B 5120K - 0 0:13 0.00% [zpool-pfSense{zio_write_intr_0_8}] 29 root -16 - 0B 5120K - 3 0:13 0.00% [zpool-pfSense{zio_write_intr_0_3}] 29 root -16 - 0B 5120K - 1 0:13 0.00% [zpool-pfSense{zio_write_intr_2_7}] 29 root -16 - 0B 5120K - 0 0:13 0.00% [zpool-pfSense{zio_write_intr_6_8}] 29 root -16 - 0B 5120K - 3 0:12 0.00% [zpool-pfSense{zio_write_intr_7_8}] 29 root -16 - 0B 5120K - 3 0:12 0.00% [zpool-pfSense{zio_write_intr_3_11}] 29 root -16 - 0B 5120K - 2 0:12 0.00% [zpool-pfSense{zio_write_intr_5_4}] 29 root -16 - 0B 5120K - 3 0:12 0.00% [zpool-pfSense{zio_write_intr_7_10}] 29 root -16 - 0B 5120K - 0 0:12 0.00% [zpool-pfSense{zio_write_intr_0_6}] 29 root -16 - 0B 5120K - 3 0:12 0.00% [zpool-pfSense{zio_write_intr_7_7}] 29 root -16 - 0B 5120K - 2 0:12 0.00% [zpool-pfSense{zio_write_intr_2_11}] 29 root -16 - 0B 5120K - 1 0:12 0.00% [zpool-pfSense{zio_write_intr_3_7}] 29 root -16 - 0B 5120K - 2 0:12 0.00% [zpool-pfSense{zio_write_intr_3_10}] 29 root -16 - 0B 5120K - 1 0:12 0.00% [zpool-pfSense{zio_write_intr_6_7}] 29 root -16 - 0B 5120K - 3 0:12 0.00% [zpool-pfSense{zio_write_intr_0_5}] 29 root -16 - 0B 5120K - 3 0:12 0.00% [zpool-pfSense{zio_write_intr_5_10}] 29 root -16 - 0B 5120K - 3 0:12 0.00% [zpool-pfSense{zio_write_intr_1_11}] 29 root -16 - 0B 5120K - 0 0:12 0.00% [zpool-pfSense{zio_write_intr_2_9}] last pid: 13303; load averages: 0.08, 0.07, 0.04 up 11+06:23:15 20:56:27 Mem: 17M Active, 331M Inact, 340M Wired, 140K Buf, 1135M Free ARC: 113M Total, 32M MFU, 77M MRU, 184K Anon, 618K Header, 3804K Other 51M Compressed, 126M Uncompressed, 2.48:1 Ratio Swap: 2048M Total, 2048M Free 0 root -76 - 0B 704K - 1 81:29 0.91% [kernel{if_io_tqg_1}] 29 root -16 - 0B 5120K - 1 0:09 0.03% [zpool-pfSense{zio_write_intr_4_7}] 12 root -60 - 0B 272K WAIT 1 4:23 0.03% [intr{swi4: clock (0)}] 81400 root 20 0 11M 2420K select 0 1:48 0.03% /usr/local/sbin/radvd -p /var/run/radvd.pid -C /var/etc/radvd.conf -m syslog 29 root -16 - 0B 5120K - 1 0:14 0.02% [zpool-pfSense{zio_write_intr_5_6}] 85175 root 20 0 20M 9244K select 0 0:00 0.02% sshd: root@pts/0 (sshd) 29 root -16 - 0B 5120K - 3 0:11 0.01% [zpool-pfSense{zio_write_intr_1_5}] 29 root -16 - 0B 5120K - 3 0:11 0.01% [zpool-pfSense{zio_write_intr_3_4}] 29 root -16 - 0B 5120K - 3 0:09 0.01% [zpool-pfSense{zio_write_intr_1_6}] 8012 root 20 0 14M 2656K nanslp 0 0:23 0.01% /usr/local/bin/dpinger -S -r 0 -i WAN_DHCP -B 74.132.83.66 -p /var/run/dpinger_WAN_DHCP~74.132.83.66~74.132.80.1.pid -u /var/run/dpinger_WAN_DHCP~74.132.83.66~74.132 77899 root 20 0 11M 2620K select 0 1:24 0.01% /usr/sbin/syslogd -s -c -c -l /var/dhcpd/var/run/log -P /var/run/syslog.pid -f /etc/syslog.conf 29 root -16 - 0B 5120K - 2 0:02 0.01% [zpool-pfSense{zio_free_issue_0_6}] 32110 root 20 0 12M 3108K bpf 3 1:36 0.01% /usr/local/sbin/filterlog -i pflog0 -p /var/run/filterlog.pid 8012 root 20 0 14M 2656K sbwait 2 0:09 0.00% /usr/local/bin/dpinger -S -r 0 -i WAN_DHCP -B 74.132.83.66 -p /var/run/dpinger_WAN_DHCP~74.132.83.66~74.132.80.1.pid -u /var/run/dpinger_WAN_DHCP~74.132.83.66~74.132 last pid: 13303; load averages: 0.08, 0.07, 0.04 up 11+06:23:17 20:56:29 Mem: 18M Active, 331M Inact, 340M Wired, 140K Buf, 1134M Free ARC: 113M Total, 32M MFU, 77M MRU, 184K Anon, 618K Header, 3804K Other 51M Compressed, 126M Uncompressed, 2.48:1 Ratio Swap: 2048M Total, 2048M Free 21 root -16 - 0B 16K pftm 0 4:32 0.02% [pf purge] 8012 root 20 0 14M 2656K nanslp 1 0:23 0.01% /usr/local/bin/dpinger -S -r 0 -i WAN_DHCP -B 74.132.83.66 -p /var/run/dpinger_WAN_DHCP~74.132.83.66~74.132.80.1.pid -u /var/run/dpinger_WAN_DHCP~74.132.83.66~74.132 44371 dhcpd 20 0 22M 11M select 1 0:21 0.01% /usr/local/sbin/dhcpd -user dhcpd -group _dhcp -chroot /var/dhcpd -cf /etc/dhcpd.conf -pf /var/run/dhcpd.pid em1 23 root -16 - 0B 48K psleep 1 1:00 0.01% [pagedaemon{dom0}] 32110 root 20 0 12M 3108K bpf 2 1:36 0.01% /usr/local/sbin/filterlog -i pflog0 -p /var/run/filterlog.pid 8012 root 20 0 14M 2656K sbwait 2 0:09 0.00% /usr/local/bin/dpinger -S -r 0 -i WAN_DHCP -B 74.132.83.66 -p /var/run/dpinger_WAN_DHCP~74.132.83.66~74.132.80.1.pid -u /var/run/dpinger_WAN_DHCP~74.132.83.66~74.132 8012 root 20 0 14M 2656K nanslp 0 0:04 0.00% /usr/local/bin/dpinger -S -r 0 -i WAN_DHCP -B 74.132.83.66 -p /var/run/dpinger_WAN_DHCP~74.132.83.66~74.132.80.1.pid -u /var/run/dpinger_WAN_DHCP~74.132.83.66~74.132 19 root -8 - 0B 608K dbuf_e 0 0:05 0.00% [zfskern{dbuf_evict_thread}] 23 root -16 - 0B 48K umarcl 0 0:04 0.00% [pagedaemon{uma}] 12 root -88 - 0B 272K WAIT 0 2:58 0.00% [intr{irq256: ahci0}] 81400 root 20 0 11M 2420K select 0 1:48 0.00% /usr/local/sbin/radvd -p /var/run/radvd.pid -C /var/etc/radvd.conf -m syslog 29 root -16 - 0B 5120K - 2 0:56 0.00% [zpool-pfSense{zio_null_issue}] 19 root -8 - 0B 608K - 0 0:32 0.00% [zfskern{dp_sync_taskq_2}] 38157 unbound 20 0 62M 28M kqread 2 0:30 0.00% /usr/local/sbin/unbound -c /var/unbound/unbound.conf{unbound} last pid: 13303; load averages: 0.07, 0.06, 0.04 up 11+06:23:19 20:56:31 51M Compressed, 126M Uncompressed, 2.47:1 Ratio Swap: 2048M Total, 2048M Free 12 root -88 - 0B 272K WAIT 0 2:58 0.06% [intr{irq256: ahci0}] 22 root -16 - 0B 16K - 3 6:49 0.04% [rand_harvestq] 29 root -16 - 0B 5120K - 3 0:12 0.04% [zpool-pfSense{zio_write_intr_2_11}] 21 root -16 - 0B 16K pftm 2 4:32 0.03% [pf purge] 29 root -16 - 0B 5120K - 1 0:14 0.03% [zpool-pfSense{zio_write_intr_5_6}] 29 root -16 - 0B 5120K - 3 0:11 0.02% [zpool-pfSense{zio_write_intr_6_11}] 8012 root 20 0 14M 2656K nanslp 0 0:23 0.01% /usr/local/bin/dpinger -S -r 0 -i WAN_DHCP -B 74.132.83.66 -p /var/run/dpinger_WAN_DHCP~74.132.83.66~74.132.80.1.pid -u /var/run/dpinger_WAN_DHCP~74.132.83.66~74.132 19 root -8 - 0B 608K - 3 0:32 0.01% [zfskern{dp_sync_taskq_2}] 44371 dhcpd 20 0 22M 11M select 1 0:21 0.01% /usr/local/sbin/dhcpd -user dhcpd -group _dhcp -chroot /var/dhcpd -cf /etc/dhcpd.conf -pf /var/run/dhcpd.pid em1 23 root -16 - 0B 48K psleep 1 1:00 0.01% [pagedaemon{dom0}] 29 root -16 - 0B 5120K - 3 0:01 0.00% [zpool-pfSense{zio_free_issue_3_6}] 29 root -16 - 0B 5120K - 2 0:09 0.00% [zpool-pfSense{zio_write_intr_3_8}] 8012 root 20 0 14M 2656K sbwait 2 0:09 0.00% /usr/local/bin/dpinger -S -r 0 -i WAN_DHCP -B 74.132.83.66 -p /var/run/dpinger_WAN_DHCP~74.132.83.66~74.132.80.1.pid -u /var/run/dpinger_WAN_DHCP~74.132.83.66~74.132 29 root -16 - 0B 5120K - 1 0:02 0.00% [zpool-pfSense{zio_free_issue_0_9}] 29 root -16 - 0B 5120K - 3 0:02 0.00% [zpool-pfSense{zio_free_issue_4_8}] 29 root -16 - 0B 5120K - 2 0:01 0.00% [zpool-pfSense{zio_free_issue_3_5}] 29 root -16 - 0B 5120K - 3 0:02 0.00% [zpool-pfSense{zio_free_issue_7_4}] last pid: 26122; load averages: 0.07, 0.06, 0.04 up 11+06:23:20 20:56:32 ARC: 113M Total, 33M MFU, 75M MRU, 1898K Anon, 618K Header, 3804K Other 51M Compressed, 126M Uncompressed, 2.47:1 Ratio Swap: 2048M Total, 2048M Free 0 root -76 - 0B 704K - 1 81:29 0.90% [kernel{if_io_tqg_1}] 54732 root 52 20 11M 2908K piperd 2 0:53 0.48% /bin/sh /var/db/rrd/updaterrd.sh 0 root -76 - 0B 704K - 2 8:51 0.05% [kernel{if_config_tqg_0}] 8012 root 20 0 14M 2656K nanslp 0 0:23 0.01% /usr/local/bin/dpinger -S -r 0 -i WAN_DHCP -B 74.132.83.66 -p /var/run/dpinger_WAN_DHCP~74.132.83.66~74.132.80.1.pid -u /var/run/dpinger_WAN_DHCP~74.132.83.66~74.132 8012 root 20 0 14M 2656K sbwait 0 0:09 0.01% /usr/local/bin/dpinger -S -r 0 -i WAN_DHCP -B 74.132.83.66 -p /var/run/dpinger_WAN_DHCP~74.132.83.66~74.132.80.1.pid -u /var/run/dpinger_WAN_DHCP~74.132.83.66~74.132 32110 root 20 0 12M 3108K bpf 3 1:36 0.00% /usr/local/sbin/filterlog -i pflog0 -p /var/run/filterlog.pid 73376 root 20 0 18M 6760K select 3 0:55 0.00% /usr/local/sbin/ntpd -g -c /var/etc/ntpd.conf -p /var/run/ntpd.pid{ntpd} 19 root -8 - 0B 608K spa->s 1 0:19 0.00% [zfskern{trim pfSense}] 8012 root 20 0 14M 2656K nanslp 2 0:04 0.00% /usr/local/bin/dpinger -S -r 0 -i WAN_DHCP -B 74.132.83.66 -p /var/run/dpinger_WAN_DHCP~74.132.83.66~74.132.80.1.pid -u /var/run/dpinger_WAN_DHCP~74.132.83.66~74.132 27 root -16 - 0B 16K vlruwt 2 0:05 0.00% [vnlru] 23 root -16 - 0B 48K umarcl 3 0:04 0.00% [pagedaemon{uma}] 29 root -12 - 0B 5120K - 3 6:15 0.00% [zpool-pfSense{zio_write_issue_0}] 12 root -88 - 0B 272K WAIT 0 2:58 0.00% [intr{irq256: ahci0}] 81400 root 20 0 11M 2420K select 0 1:48 0.00% /usr/local/sbin/radvd -p /var/run/radvd.pid -C /var/etc/radvd.conf -m syslog 19 root -8 - 0B 608K - 3 0:32 0.00% [zfskern{dp_sync_taskq_2}] 38157 unbound 20 0 62M 28M kqread 2 0:30 0.00% /usr/local/sbin/unbound -c /var/unbound/unbound.conf{unbound} 29 root -16 - 0B 5120K - 1 0:13 0.00% [zpool-pfSense{zio_write_intr_1_9}] 29 root -16 - 0B 5120K - 3 0:13 0.00% [zpool-pfSense{zio_write_intr_0_3}] -
Ok, well that shows pretty close to zero load on the system. If you were moving any traffic over the VPN (or anywhere!) it must have been very low throughput to have not shown up at all.
Steve
-
@sentinelace I just upgraded to 2.5.2 and had this exact problem. I use unbound for DNS on the pfSense and the DNS leak test worked ok, i.e. shows it's going through VPN, but "What's my IP" kept showing my WAN interface IP. After doing some digging I found this post: Policy based routing with 2.5.x not working (works in 2.4.5.1). I adjusted the setting of my default route in System > Routing > Gateways to be the Express VPN Gateway, and now my traffic flows properly. I have policy based routing where some traffic goes through the WAN gateway, because it doesn't work properly when using a VPN. If I have the default route set to "Automatic" or "WAN", then no traffic will go through the VPN interface regardless of the rules in the firewall. The one caveat to this is that Unbound DNS will only use the VPN interface (that's what I have it set to in the DNS settings) and therefore can't connect to ExpressVPN on reboot. I need to go in and set the default route to "Automatic" just long enough for the DNS to find the Express VPN server and connect. Once the Express VPN gateway is up, I can reset the default route to "ExpressVPN" gateway and everything routes appropriately.
Update: I just unchecked the "Don't Pull Routes" in the OpenVPN Client settings for ExpressVPN, did a reboot with the Default Route set to Automatic and everything is working appropriately. i.e., DNS found ExpressVPN server on reboot and policy based routing works appropriately.