Periodic TCP retransmission (lagg, openvpn, static routing)
-
Hi folks,
Faced with VPN issue and have no idea why it's happening.Sometime during
curlrequests I'm getting TCP retransmission and connection timed out, but if I will retry curl several times, CTRL+C it before timeout - it will succeed. The same issue applies to ICMP, if I will run for example ping to 1.0.0.1 that have a static route thought VPN there will be the same picture as with curl, first run ofpingcommand will give me 100% loss, but if we will exit from ping and run it couple of times repeating restart sequence (like 2 ping runs with CTRL+C and 3th normal) on 3th will be no issue pinging remote host. Sometimes it works with first try in case of ping command.➜ vpn curl -4Lv rutracker.org * Trying 195.82.146.214:80... * TCP_NODELAY set ^C ➜ vpn curl -4Lv rutracker.org * Trying 195.82.146.214:80... * TCP_NODELAY set ^C ➜ vpn curl -4Lv rutracker.org * Trying 195.82.146.214:80... * TCP_NODELAY set * Connected to rutracker.org (195.82.146.214) port 80 (#0) > GET / HTTP/1.1 > Host: rutracker.org > User-Agent: curl/7.68.0 ...➜ vpn ping 1.0.0.1 PING 1.0.0.1 (1.0.0.1) 56(84) bytes of data. ^C --- 1.0.0.1 ping statistics --- 2 packets transmitted, 0 received, 100% packet loss, time 1010ms ➜ vpn ping 1.0.0.1 PING 1.0.0.1 (1.0.0.1) 56(84) bytes of data. ^C --- 1.0.0.1 ping statistics --- 2 packets transmitted, 0 received, 100% packet loss, time 1020ms ➜ vpn ping 1.0.0.1 PING 1.0.0.1 (1.0.0.1) 56(84) bytes of data. 64 bytes from 1.0.0.1: icmp_seq=1 ttl=58 time=65.5 ms 64 bytes from 1.0.0.1: icmp_seq=2 ttl=58 time=65.6 ms 64 bytes from 1.0.0.1: icmp_seq=3 ttl=58 time=65.9 ms 64 bytes from 1.0.0.1: icmp_seq=4 ttl=58 time=65.9 ms ^C --- 1.0.0.1 ping statistics --- 4 packets transmitted, 4 received, 0% packet loss, time 3005ms rtt min/avg/max/mdev = 65.493/65.719/65.938/0.186 msOverall structure:
PC (NAT)            FW (pfSense)        VPN Server
192.168.X.X ------> 192.168.X.1 ------> X.X.X.X
I have PC that stands behind NAT of pfSense as a primary FW with multiple ISP (WAN's) and OpenVPN client setup on FW, here's
ifconfigoutput that may be useful:ovpnc1: flags=8051<UP,POINTOPOINT,RUNNING,MULTICAST> metric 0 mtu 1500 options=80000<LINKSTATE> inet6 fe80::92e2:baff:fe74:965c%ovpnc1 prefixlen 64 scopeid 0x18 inet 10.71.0.2 --> 10.71.0.1 netmask 0xffffff00 groups: tun openvpn nd6 options=21<PERFORMNUD,AUTO_LINKLOCAL> Opened by PID 70383 lagg0: flags=8843<UP,BROADCAST,RUNNING,SIMPLEX,MULTICAST> metric 0 mtu 1500 description: LAN_LAGG options=c01bb<RXCSUM,TXCSUM,VLAN_MTU,VLAN_HWTAGGING,JUMBO_MTU,VLAN_HWCSUM,TSO4,VLAN_HWTSO,LINKSTATE> ether d4:ae:52:63:7a:67 inet6 fe80::d6ae:52ff:fe63:7a67%lagg0 prefixlen 64 scopeid 0xe inet 192.168.137.1 netmask 0xffffff00 broadcast 192.168.137.255 laggproto failover lagghash l2,l3,l4 laggport: bce0 flags=5<MASTER,ACTIVE> laggport: bce1 flags=0<> laggport: bce2 flags=0<> laggport: bce3 flags=0<> groups: lagg media: Ethernet autoselect status: active nd6 options=21<PERFORMNUD,AUTO_LINKLOCAL> bce0: flags=8843<UP,BROADCAST,RUNNING,SIMPLEX,MULTICAST> metric 0 mtu 1500 options=c01bb<RXCSUM,TXCSUM,VLAN_MTU,VLAN_HWTAGGING,JUMBO_MTU,VLAN_HWCSUM,TSO4,VLAN_HWTSO,LINKSTATE> ether FF:FF:FF:FF:FF:FF media: Ethernet autoselect (1000baseT <full-duplex>) status: active nd6 options=21<PERFORMNUD,AUTO_LINKLOCAL>For LAN I have 4 interfaces merged to LAGG in FAILOVER configuration.
Installing VPN client directly on a PC solves retransmission issues, I don't seeing them that case.
So I've tried to debug VPN on pfSense using tcpdump and it seems like a routing issues fromlagg0interface toovpnc1. Below is example of VPN server ping from PC using private address:# ---- Running on pfSense $ tcpdump -i lagg0 -nnn host 10.71.0.1 tcpdump: verbose output suppressed, use -v or -vv for full protocol decode listening on lagg0, link-type EN10MB (Ethernet), capture size 262144 bytes 13:19:48.449884 IP 192.168.137.5 > 10.71.0.1: ICMP echo request, id 1009, seq 1, length 64 13:19:49.467918 IP 192.168.137.5 > 10.71.0.1: ICMP echo request, id 1009, seq 2, length 64 13:19:50.508149 IP 192.168.137.5 > 10.71.0.1: ICMP echo request, id 1009, seq 3, length 64 13:19:51.548000 IP 192.168.137.5 > 10.71.0.1: ICMP echo request, id 1009, seq 4, length 64 13:19:52.587881 IP 192.168.137.5 > 10.71.0.1: ICMP echo request, id 1009, seq 5, length 64 13:19:53.627933 IP 192.168.137.5 > 10.71.0.1: ICMP echo request, id 1009, seq 6, length 64 13:19:54.667940 IP 192.168.137.5 > 10.71.0.1: ICMP echo request, id 1009, seq 7, length 64 13:19:55.707961 IP 192.168.137.5 > 10.71.0.1: ICMP echo request, id 1009, seq 8, length 64 13:19:56.747791 IP 192.168.137.5 > 10.71.0.1: ICMP echo request, id 1009, seq 9, length 64 13:19:57.787957 IP 192.168.137.5 > 10.71.0.1: ICMP echo request, id 1009, seq 10, length 64 13:19:58.827844 IP 192.168.137.5 > 10.71.0.1: ICMP echo request, id 1009, seq 11, length 64 13:19:59.867908 IP 192.168.137.5 > 10.71.0.1: ICMP echo request, id 1009, seq 12, length 64 13:20:00.907916 IP 192.168.137.5 > 10.71.0.1: ICMP echo request, id 1009, seq 13, length 64 13:20:01.947778 IP 192.168.137.5 > 10.71.0.1: ICMP echo request, id 1009, seq 14, length 64 ^C 14 packets captured 2484 packets received by filter 0 packets dropped by kernel # ---- Running on pfSense $ tcpdump -i bce0 -nnn host 10.71.0.1 tcpdump: verbose output suppressed, use -v or -vv for full protocol decode listening on bce0, link-type EN10MB (Ethernet), capture size 262144 bytes 13:19:48.449882 IP 192.168.137.5 > 10.71.0.1: ICMP echo request, id 1009, seq 1, length 64 13:19:49.467913 IP 192.168.137.5 > 10.71.0.1: ICMP echo request, id 1009, seq 2, length 64 13:19:50.508145 IP 192.168.137.5 > 10.71.0.1: ICMP echo request, id 1009, seq 3, length 64 13:19:51.547996 IP 192.168.137.5 > 10.71.0.1: ICMP echo request, id 1009, seq 4, length 64 13:19:52.587877 IP 192.168.137.5 > 10.71.0.1: ICMP echo request, id 1009, seq 5, length 64 13:19:53.627930 IP 192.168.137.5 > 10.71.0.1: ICMP echo request, id 1009, seq 6, length 64 13:19:54.667937 IP 192.168.137.5 > 10.71.0.1: ICMP echo request, id 1009, seq 7, length 64 13:19:55.707957 IP 192.168.137.5 > 10.71.0.1: ICMP echo request, id 1009, seq 8, length 64 13:19:56.747787 IP 192.168.137.5 > 10.71.0.1: ICMP echo request, id 1009, seq 9, length 64 13:19:57.787954 IP 192.168.137.5 > 10.71.0.1: ICMP echo request, id 1009, seq 10, length 64 13:19:58.827840 IP 192.168.137.5 > 10.71.0.1: ICMP echo request, id 1009, seq 11, length 64 13:19:59.867904 IP 192.168.137.5 > 10.71.0.1: ICMP echo request, id 1009, seq 12, length 64 13:20:00.907913 IP 192.168.137.5 > 10.71.0.1: ICMP echo request, id 1009, seq 13, length 64 13:20:01.947774 IP 192.168.137.5 > 10.71.0.1: ICMP echo request, id 1009, seq 14, length 64 ^C 14 packets captured 2263 packets received by filter 0 packets dropped by kernel # ---- Running on pfSense $ tcpdump -i ovpnc1 -nnn host 10.71.0.1 tcpdump: verbose output suppressed, use -v or -vv for full protocol decode listening on ovpnc1, link-type NULL (BSD loopback), capture size 262144 bytes ^C 0 packets captured 12 packets received by filter 0 packets dropped by kernelBut some of the
pingruns are passing without any issues, packets being captured onovpnc1interface too, like so:$ tcpdump -i bce0 -nnn host 10.71.0.1 tcpdump: verbose output suppressed, use -v or -vv for full protocol decode listening on bce0, link-type EN10MB (Ethernet), capture size 262144 bytes 15:36:14.910464 IP 192.168.137.5 > 10.71.0.1: ICMP echo request, id 1050, seq 1, length 64 15:36:14.972086 IP 10.71.0.1 > 192.168.137.5: ICMP echo reply, id 1050, seq 1, length 64 15:36:15.911838 IP 192.168.137.5 > 10.71.0.1: ICMP echo request, id 1050, seq 2, length 64 15:36:15.973458 IP 10.71.0.1 > 192.168.137.5: ICMP echo reply, id 1050, seq 2, length 64 15:36:16.913082 IP 192.168.137.5 > 10.71.0.1: ICMP echo request, id 1050, seq 3, length 64 15:36:16.974786 IP 10.71.0.1 > 192.168.137.5: ICMP echo reply, id 1050, seq 3, length 64 15:36:17.914650 IP 192.168.137.5 > 10.71.0.1: ICMP echo request, id 1050, seq 4, length 64 15:36:17.976233 IP 10.71.0.1 > 192.168.137.5: ICMP echo reply, id 1050, seq 4, length 64 15:36:18.916055 IP 192.168.137.5 > 10.71.0.1: ICMP echo request, id 1050, seq 5, length 64 15:36:18.977647 IP 10.71.0.1 > 192.168.137.5: ICMP echo reply, id 1050, seq 5, length 64Might be interesting too, entries related to VPN in routing table of PF:
$ netstat -nr
...
1.0.0.1/32         10.71.0.1          UGS      ovpnc1
10.71.0.0/24       10.71.0.1          UGS      ovpnc1
10.71.0.1          link#24            UH       ovpnc1
10.71.0.2          link#24            UHS         lo0
...
As for VPN configuration, I have gateway configured to
10.71.0.1(which is internal address of OpenVPN server), and then I have static routes that lead to this GW where in Destination network I put name of an alias which contains destination hosts like1.0.0.1.Is anyone know what is wrong here?
I had thoughts that this might be caused by MTU, tried to set it to something like 1300 on both sides of VPN configuration (expect NAT'ed PC and case where I checked VPN directly from PC, it works with fine MTU of 1500) but it does not seems to be working either my MTU configuration was not complete or it's not related to MTU at all.
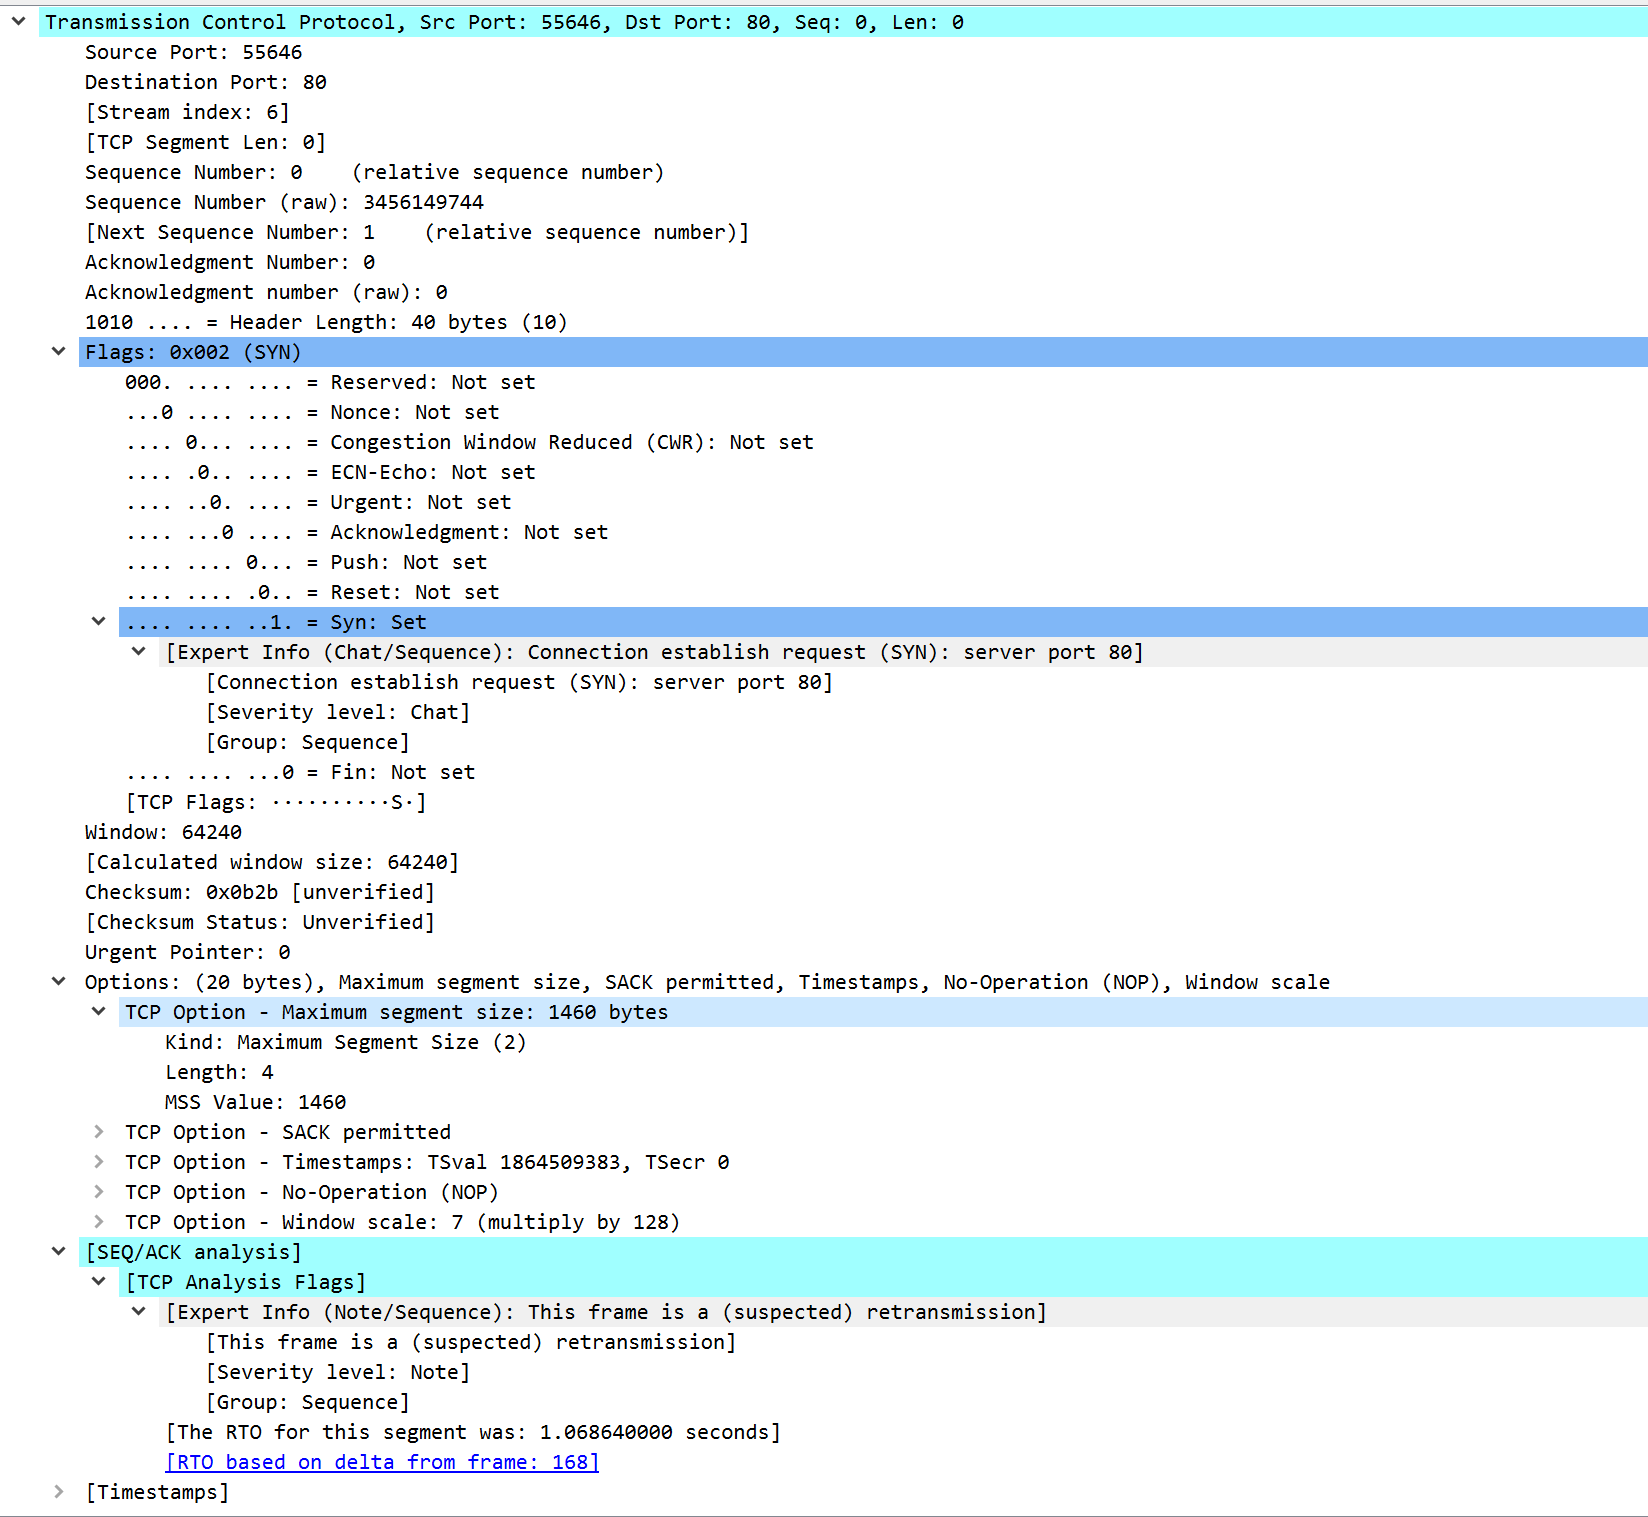
P.S. Example of retransmission in Wireshark:
-
As an another example with
virtualbox.orgthought VPN.
States table:lagg0 tcp 192.168.137.5:55644 -> 137.254.60.32:80 CLOSED:SYN_SENT 5 / 0 300 B / 0 B ovpnc1 tcp 10.70.0.1:23025 (192.168.137.5:55644) -> 137.254.60.32:80 SYN_SENT:CLOSED 5 / 0 300 B / 0 Blagg tcpdump:
$ tcpdump -i lagg0 -nnn host 137.254.60.32
tcpdump: verbose output suppressed, use -v or -vv for full protocol decode
listening on lagg0, link-type EN10MB (Ethernet), capture size 262144 bytes
22:04:59.555001 IP 192.168.137.5.55644 > 137.254.60.32.80: Flags [S], seq 1721928473, win 64240, options [mss 1460,sackOK,TS val 1139199871 ecr 0,nop,wscale 7], length 0
22:05:00.617206 IP 192.168.137.5.55644 > 137.254.60.32.80: Flags [S], seq 1721928473, win 64240, options [mss 1460,sackOK,TS val 1139200933 ecr 0,nop,wscale 7], length 0
22:05:02.697231 IP 192.168.137.5.55644 > 137.254.60.32.80: Flags [S], seq 1721928473, win 64240, options [mss 1460,sackOK,TS val 1139203013 ecr 0,nop,wscale 7], length 0
22:05:06.777117 IP 192.168.137.5.55644 > 137.254.60.32.80: Flags [S], seq 1721928473, win 64240, options [mss 1460,sackOK,TS val 1139207093 ecr 0,nop,wscale 7], length 0
22:05:15.177159 IP 192.168.137.5.55644 > 137.254.60.32.80: Flags [S], seq 1721928473, win 64240, options [mss 1460,sackOK,TS val 1139215493 ecr 0,nop,wscale 7], length 0
^C
5 packets captured
15116 packets received by filter
0 packets dropped by kernel
ovpnc1 - 0 packets captured.
curl:
➜ vpn curl -vL4 virtualbox.org * Trying 137.254.60.32:80... * TCP_NODELAY set * connect to 137.254.60.32 port 80 failed: Connection timed out * Failed to connect to virtualbox.org port 80: Connection timed out * Closing connection 0 curl: (28) Failed to connect to virtualbox.org port 80: Connection timed out -
Might be also a part of the issue, sometimes
curlrequest being sent (according to pfctl) from10.70.0.1(which is local VPN server address, not the client) or it's picking up10.71.0.2(it's VPN client address on interface) which is working.
Doing request to:80with-L(follow redirect) firstly uses10.71.0.2(and completes fine) but second one request to:443using10.70.0.1and fails.$ pfctl -ss | grep 137.254.60.32 lagg0 tcp 137.254.60.32:80 <- 192.168.137.5:55590 FIN_WAIT_2:ESTABLISHED ovpnc1 tcp 10.71.0.2:56376 (192.168.137.5:55590) -> 137.254.60.32:80 ESTABLISHED:FIN_WAIT_2 lagg0 tcp 137.254.60.32:443 <- 192.168.137.5:55628 CLOSED:SYN_SENT ovpnc1 tcp 10.70.0.1:16251 (192.168.137.5:55628) -> 137.254.60.32:443 SYN_SENT:CLOSEDDirect
curlto:443may randomly pick10.71.0.2and it works just fine:$ pfctl -ss | grep 137.254.60.32 lagg0 tcp 137.254.60.32:443 <- 192.168.137.5:55634 ESTABLISHED:ESTABLISHED ovpnc1 tcp 10.71.0.2:59828 (192.168.137.5:55634) -> 137.254.60.32:443 ESTABLISHED:ESTABLISHED$ pfctl -ss | grep 137.254.60.32 lagg0 tcp 137.254.60.32:443 <- 192.168.137.5:55646 FIN_WAIT_2:FIN_WAIT_2 ovpnc1 tcp 10.71.0.2:6254 (192.168.137.5:55646) -> 137.254.60.32:443 FIN_WAIT_2:FIN_WAIT_2Looks like it picking up wrong source address on PF side from time to time, any ideas?
-
Disabling VPN server and it's interface (I have both VPN client and server on PF) solves this issue, is it not supposed to work both of them one time or just something wrong with outbound NAT?