Better way of analyzing Suricata data
-
Hello everyone,
Im looking for a better way of analyzing alerts in Suricata then what is currently presented in pfsense.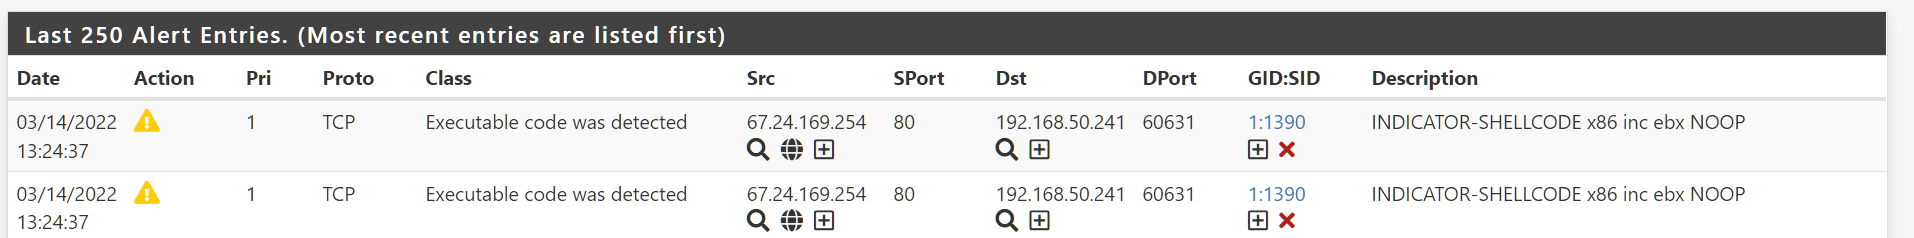
As you can see above, this alert was on my LAN interface about 2hrs ago. I have no way of figuring out if this is really actionable or not. On the surface of course it looks bad but as there is no way to see a pcap of this when the alert was generated I can't do much. Yes, I'm aware of enabling pcaps but that's not as clean as having a built-in mechanism where you can see the copy of the payload within the alert that was generated. Something to go off on.
Its the same problem I have with alerts that state "ET DNS Query for .to TLD". Ok..what am I supposed to do with this if the alert fired off overnight? Hate to be that guy but on the "other" open source firewall their Suricata implementation although not perfect I can see the payload in the GUI for the alert generated. Not perfect but I can see something to begin the process of troubleshooting.Are there any tips or knobs that can be used to make the alerts actionable for troubleshooting. From the picture above I'm not sure if I have an infected PC or not. The firewall is stateful so I assume one of my machines reached out to establish a TCP session and that session is being used for some kind of file transfer to run an executable.
-
Most users export Suricata log data (from the EVE JSON logging subsystem) to a third-party toolset such as an ELK stack hosted on a separate server. One tool available in the FreeBSD ecosystem for exporting logs is
filebeat.There are options for enabling the dumping of packet payloads from alerts via the EVE JSON logging settings on the INTERFACE SETTINGS tab in Suricata. At the moment there is no facility within the pfSense PHP GUI for directly looking at that data, though. The assumption is a third-party non-local SIEM type system is used to vacuum up and analyze the data.
You generally don't want to do all the logging and log analysis directly on the firewall because installing all that extra software increases the attack surface on the firewall, and you don't want CPU cycles and RAM taken up by the analysis. Not to mention the enormous amount of disk space that might be required to keep packet captures on a very busy firewall.
-
@bmeeks Thanks Bill. Although i completely understand not creating a larger attack surface within the PHP GUI, maybe in the future, with the GUI not on PHP a consideration can be made. I imagine a one stop shop for those firewalls that are able to handle the load and a caveat for those that cant.
I have filebeat running but how exactly do I get the logs from pfsense to filebeat. At a lost for this.
More or less followed this guide:
https://www.digitalocean.com/community/tutorials/how-to-build-a-siem-with-suricata-and-elastic-stack-on-ubuntu-20-04 -
I have not done so personally, but the general idea is you install a
filebeatclient on pfSense and configure that client to ingest the EVE JSON logs on the firewall. You will find them under/var/log/suricata/suricata_xxxx/on the firewall where the suricata_xxxx part will be a unique subdirectory for each configured Suricata interface that includes the physical interface name combined with a random UUID number.Here is a general overview link for
filebeat: https://www.elastic.co/guide/en/beats/filebeat/current/filebeat-overview.html.You have to tell the client what kind of logs to ingest and where to pull them from. Here is the documentation for that: https://www.elastic.co/guide/en/beats/filebeat/current/configuration-filebeat-options.html. Unfortunately, many of these packages change their input formatting somewhat frequently, so you will likely have to dig around on Google to find the "current" config parameters needed to ingest Suricata 6.0.x EVE logs.
Here is the documentation for establishing an output destination for
filebeat: https://www.elastic.co/guide/en/beats/filebeat/current/configuring-output.html.The basic process is to install and configure the client on the pfSense firewall, and then configure the client to output (or send) ingested log data from the pfSense firewall over the network to your ELK stack running on the Ubuntu machine.
I added a note to my internal Suricata package issue tracking to investigate a primitive means to at least allow display of the captured payloads in the GUI if that option is enabled. There will be only limited usefulness there, though, because the vast majority of the time the payload is going to be encrypted.