3.1.0.4 high CPU load
-
Hello, never seen this, but on one site my Netate 7100 has high cpu load:
11 root 155 ki31 0B 64K CPU2 2 122.5H 85.69% [idle{idle: cpu2}]
11 root 155 ki31 0B 64K RUN 3 121.8H 84.47% [idle{idle: cpu3}]
11 root 155 ki31 0B 64K RUN 1 121.2H 78.17% [idle{idle: cpu1}]
11 root 155 ki31 0B 64K CPU0 0 121.0H 75.88% [idle{idle: cpu0}]
98435 root 94 0 18M 7840K CPU3 3 882:09 73.10% /usr/local/sbin/lighttpd_pfb -f /var/unbound/pfb_dnsbl_lighty.confHow can I debug this issue?
-
I'm getting similar high CPU usage that was also affecting the bandwidth over several IPSec tunnels by 50% on either HA 7100 unit.
  PID USERNAME    PRI NICE   SIZE    RES STATE    C   TIME    WCPU COMMAND
27957 root         20    0    63M    37M piperd   1   0:00   8.73% /usr/local/bin/php_pfb -f /usr/local/pkg/pfblockerng/pfblockerng.inc filterlog
and I created a cron to run every minute to
killall /usr/local/bin/php_pfbAfter killing that process, my bandwidth was back to normal over the tunnels.
I'm running this on 22.01-Release and this was CPU load was not occurring prior to 3.1.0.4.I'm only doing IP blocking, not DBSBL.
Mine started when I updated pfb this this version 36 hours ago.
-
Do you have a Maxmind license key entered? If you do, try removing it and checking CPU load across a reboot.
-
@dimnovotny I've just recently updated pfb as well, but not on a Netgate device. Using 2.6.0 on a minipc with similar specs to the Netgate 7100. I'm not running IPsec. I am using both DNSBL and IP blocking. I also have Maxmind license key entered.
That said, I'm not seeing this behavior at all from a CPU resource perspective for that process. No change in CPU usage.
-
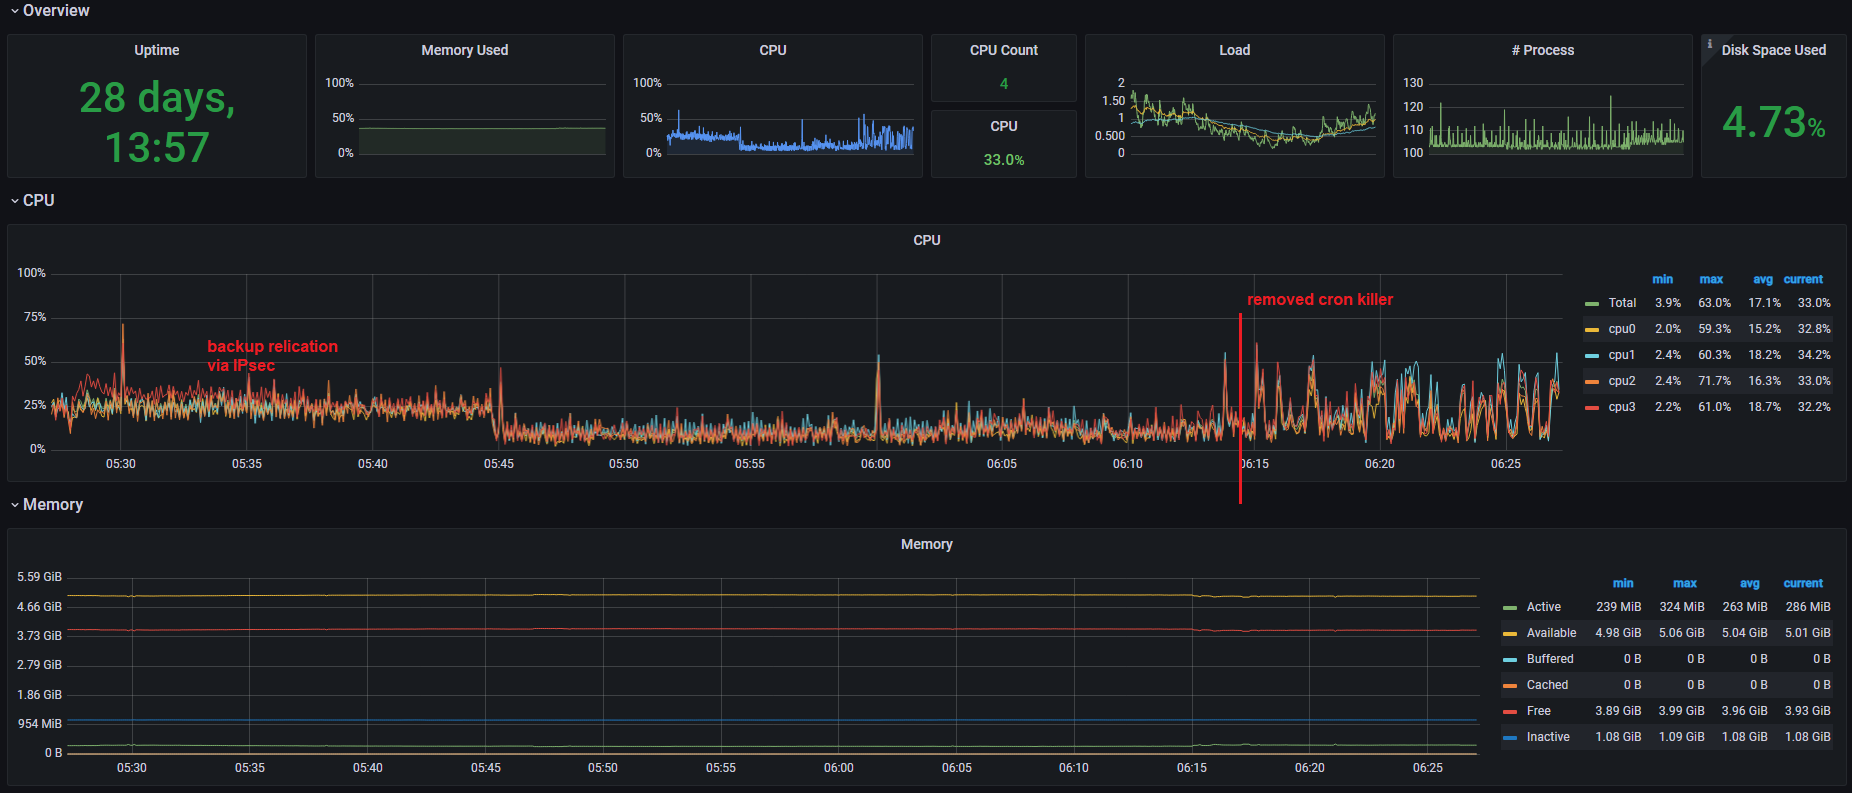
@axsdenied I just disabled those cron on each HA, reloaded the update in pfBlocker and it looks like CPU slowly grows from 1% to around 7.5+% and then back around 1%.
50571 root 52 0 80M 63M piperd 3 0:19 7.76% /usr/local/bin/php_pfb -f /usr/local/pkg/pfblockerng/pfblockerng.inc filterlog.I'll keep it running without my cron and see what it is like. It's about 30 minutes before most of the employees arrive, so we'll see.
-
Yeah... there must be some sort of extra processing going on with pfBlocker. That process was acting like this prior to creating my "killall php_pfb" cronjob. Going from an average CPU of ~15% to 39%.
93221 root 52 0 80M 64M piperd 2 5:16 8.79% /usr/local/bin/php_pfb -f /usr/local/pkg/pfblockerng/pfblockerng.inc filterlog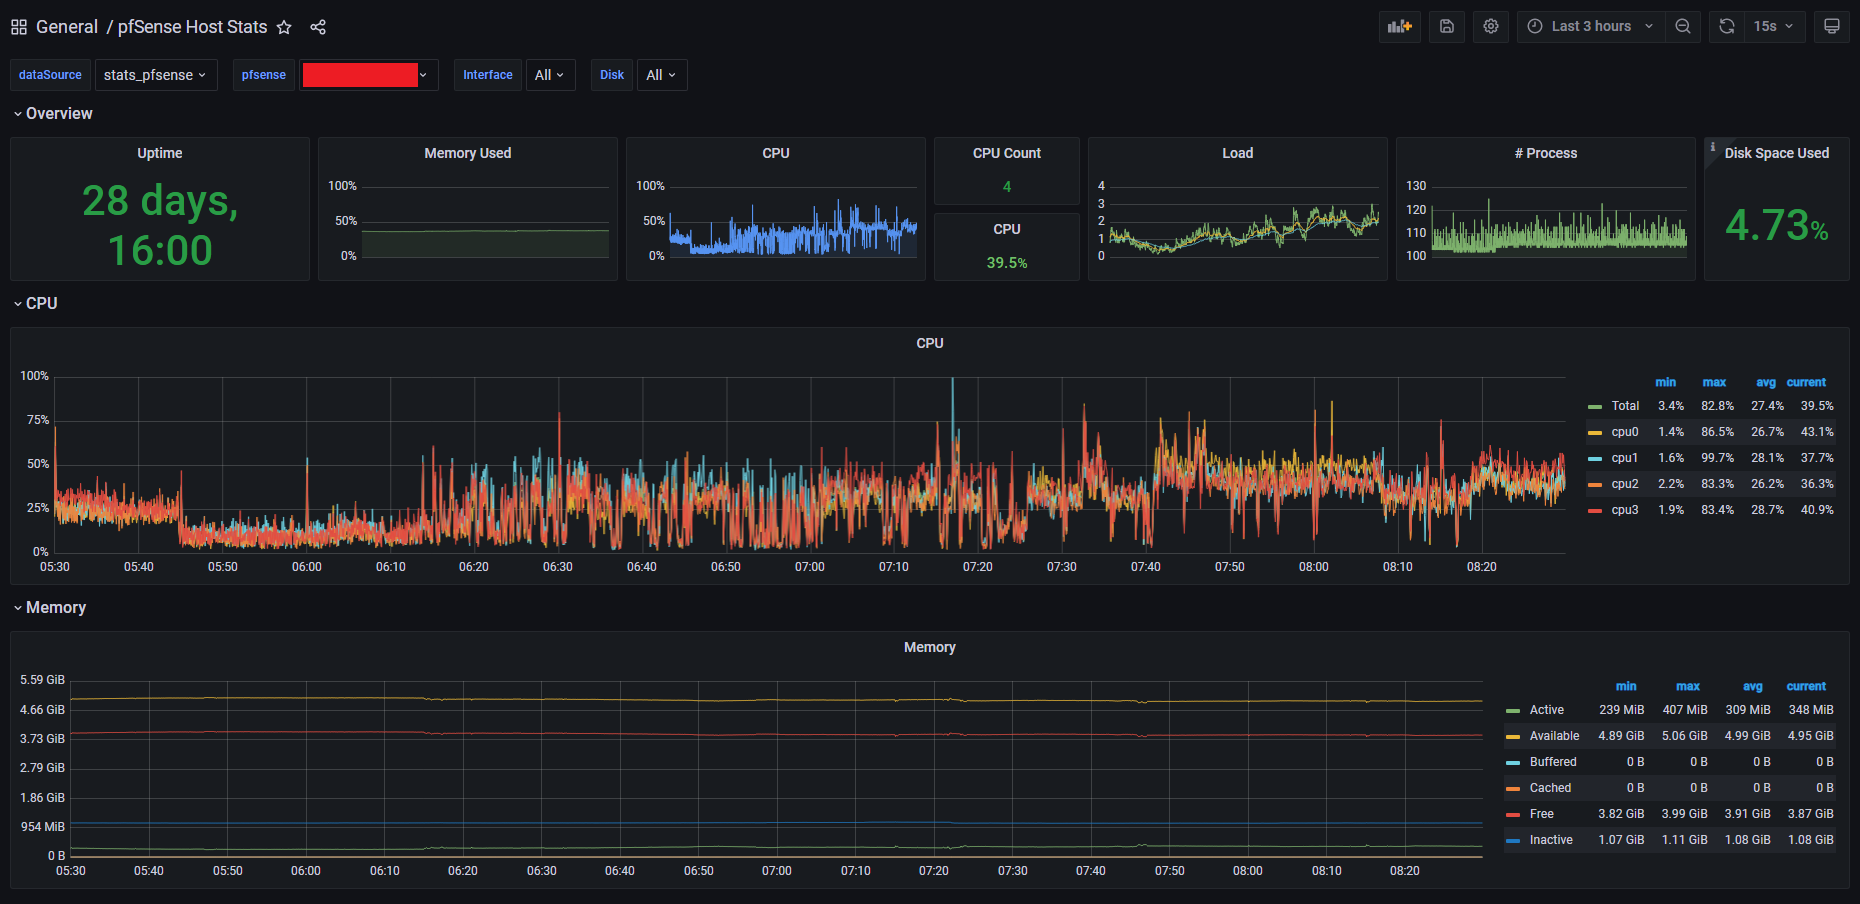
-
@dimnovotny I'm wondering if it's related to some logging "issue". Or rather an issue that was present and then corrected.
I investigated my pfblocker logs I noticed a bit of my historical data is missing prior to the upgrade (i'm not sure if this is expected or not). I also noticed that the day I upgraded the amount of logged blocks had quadrupled which means it has to log more. For IP blocks I went from 1k a day to 4k+.
Not saying there may not still be an issue contributing to your observations, just trying to narrow it down.
-
@axsdenied I submitted a redmine ticket - https://redmine.pfsense.org/issues/13154 but Jim closed it as it appears to be related with my original ticket - https://redmine.pfsense.org/issues/12827 on CPU usage when the filter reloads.
My RSS feed alerted me earlier this morning that 22.05 beta is available - https://www.netgate.com/blog/pfsense-plus-software-beta-version-22.05-now-available-for-testing
I haven't read over their changelog yet, maybe that will fixed some stuff. https://docs.netgate.com/pfsense/en/latest/releases/index.html
-
@dimnovotny said in 3.1.0.4 high CPU load:
It's about 30 minutes before most of the employees arrive
So, are you saying you selected once per day or every 12hrs? If that's the case, you should not experience cpu issue unless you selected too much feed for every hour update.
@lohphat said in 3.1.0.4 high CPU load:
Do you have a Maxmind license key entered? If you do, try removing it and checking CPU load across a reboot.
Sorry, nonsense and not true as another member confirmed.
-
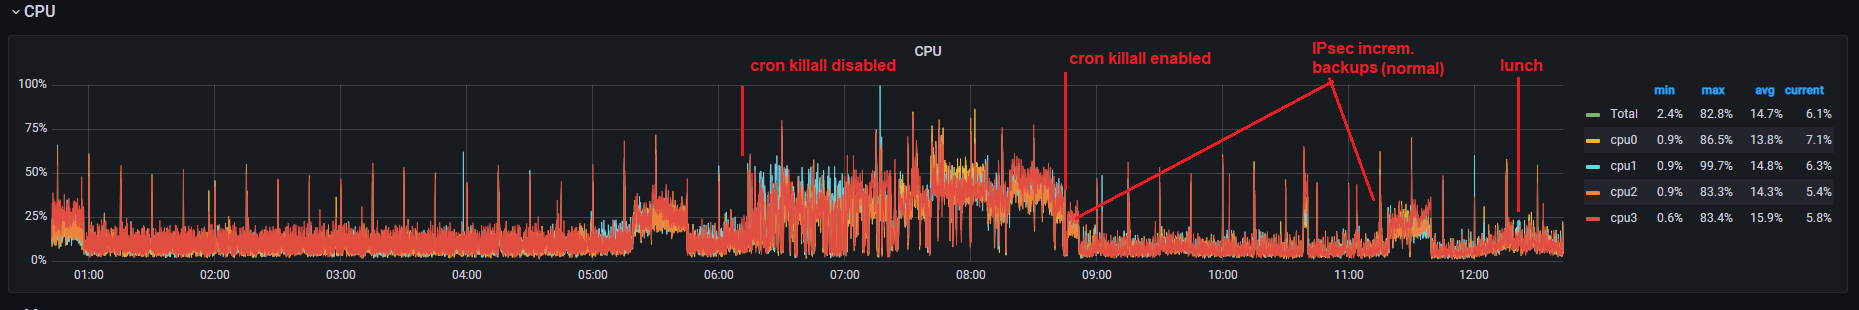
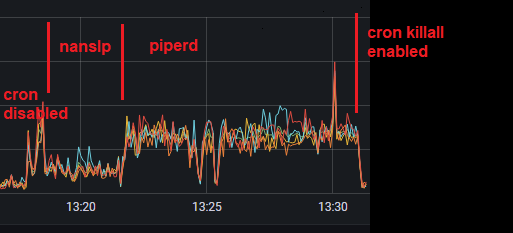
@nollipfsense I was saying it was 30 minutes before most employees were coming into the office and that was when I disabled my every minute cronjob "killall php_pfb" and as you can see the CPU was averaging 39% plus. As soon as I enabled it again, CPU average to less than 15%
"/usr/local/bin/php /usr/local/www/pfblockerng/pfblockerng.php cron >> /var/log/pfblockerng/pfblockerng.log 2>&1" runs every 15 minutes and usually always, if not sooner, "/usr/local/bin/php_pfb -f /usr/local/pkg/pfblockerng/pfblockerng.inc filterlog" comes backup and runs causing exxcessive load, IPsec vpn bandwidth drops from 95Mbps of the 100 Mbps ISP pipe on both ends to less than 50Mbps during backups. That drop is not caused by other traffic from the employees either or external bottlenecks.
-
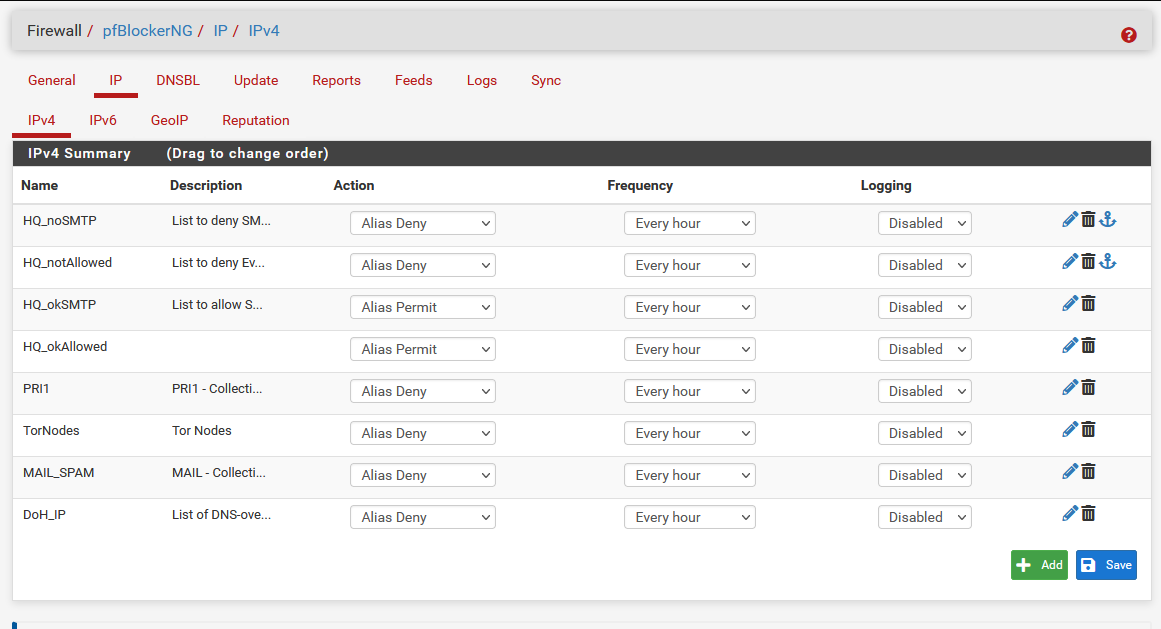
I also tried to disabled all the logging for IPv# and GeoIP and disabled my cron, but the CPU rose up again. I'm using pfBlocker aliases in the filter rules instead of it autorules so I'm already getting logs that way... don't need to double dip logging.
-
I have also noticed that when the CPU stays low, the process state is nanslp but when it goes to piperd, that is when you see the higher CPU.
-
@dimnovotny A cron job of every minute or even every 15mins is grossly unnecessary and is bound to consume cpu cycle...my corporation runs its feed once per day.
-
R renegade referenced this topic on
-
R renegade referenced this topic on
-
S SteveITS referenced this topic on
-
S SteveITS referenced this topic on