Traffic showing on interface, even though all traffic should be VLAN tagged
-
I have an interface, OPT1, that all of my VLAN's are assigned to. OPT1 is connected to my Unifi Switch. All of my traffic is tagged with a VLAN.
OPT1 is enabled as an interface in order for my VLAN interfaces to work. But in the past, I had no firewall rules on OPT1. Because no firewall rules existed on that interface, all traffic that wasn't tagged with a VLAN would be blocked. But I also wouldn't know about any blocked traffic, since I had no rule to block and log that traffic.
I was curious recently, so I created a single rule to allow any to any on that interface, but I also enable logging.
To my surprise, traffic shows up in my logs. There's not a lot of traffic, and it only happens a handful of times per day.
I attempted to do a packet capture on the OPT1 interface, but it's capturing all the VLAN traffic. Enabling a full packet capture for a couple of minutes on that OPT1 interface produced a 500MB PCAP file. Since this only happens a few times per day, I can't leave that running until it happens because I don't have the space for that file on pfSense.
Does anyone know why this would be happening? A bug in Unifi or pfSense maybe, where it's dropping the VLAN header in the packet and then being routed to the OPT1 interface directly instead of the actual VLAN interface?
Any tips on how I can get a PCAP file that only records information from the OPT1 interface that does not include the traffic from the VLAN's so I can actually see what those packets look like?
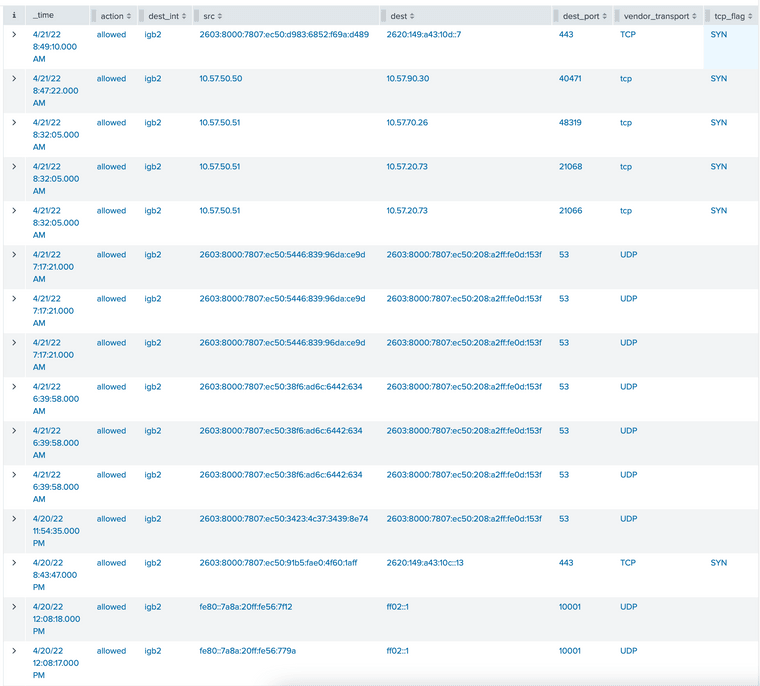
Here's a screenshot of the rules that were allowed on my OPT1 interface (igb2) over the past 24 hours. Note that this mostly appears to be coming from VLAN 50, which is my media VLAN, and the IPv4 address 10.57.50.50-55 are Apple HomePod Minis. There's some link local IPv6 requests in there too... but most everything else appears to be coming from VLAN 50:
-
@offstageroller where are you seeing this? This sure doesn't look like the pfsense firewall log

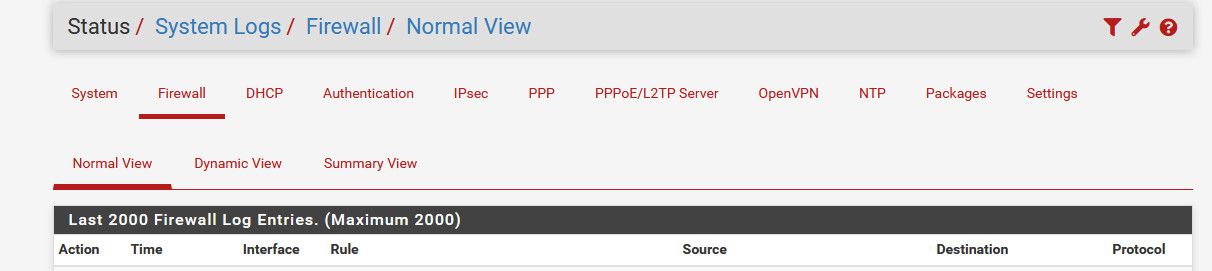
This is the headers from the pfsense web gui firewall log
-
@johnpoz said in Traffic showing on interface, even though all traffic should be VLAN tagged:
@offstageroller where are you seeing this? This sure doesn't look like the pfsense firewall log
This is the headers from the pfsense web gui firewall log
Hey @johnpoz, I ship my logs to Splunk. That screenshot I shared is from the Splunk interface.
-
@offstageroller and what there is not vlan 50? The parent interface will see untagged traffic as well..
If your seeing traffic that is untagged - then you need to figure out what is sending untagged traffic, etc.
-
@johnpoz said in Traffic showing on interface, even though all traffic should be VLAN tagged:
@offstageroller and what there is not vlan 50? The parent interface will see untagged traffic as well..
If your seeing traffic that is untagged - then you need to figure out what is sending untagged traffic, etc.
Correct. VLAN 50 would show as
igb2.50as thedest_intfor any traffic that gets logged.igb2on it's own would be for all untagged traffic, which there should be none (hence my surprise to see some).Do you have any tips on how to collect a PCAP file for only untagged traffic on that interface? Like I said, I'm logging about 100MB/minute if I capture traffic on the OPT1 (igb2) interface. I thought that would only include untagged traffic... but it includes all of the VLAN traffic going across that interface as well.
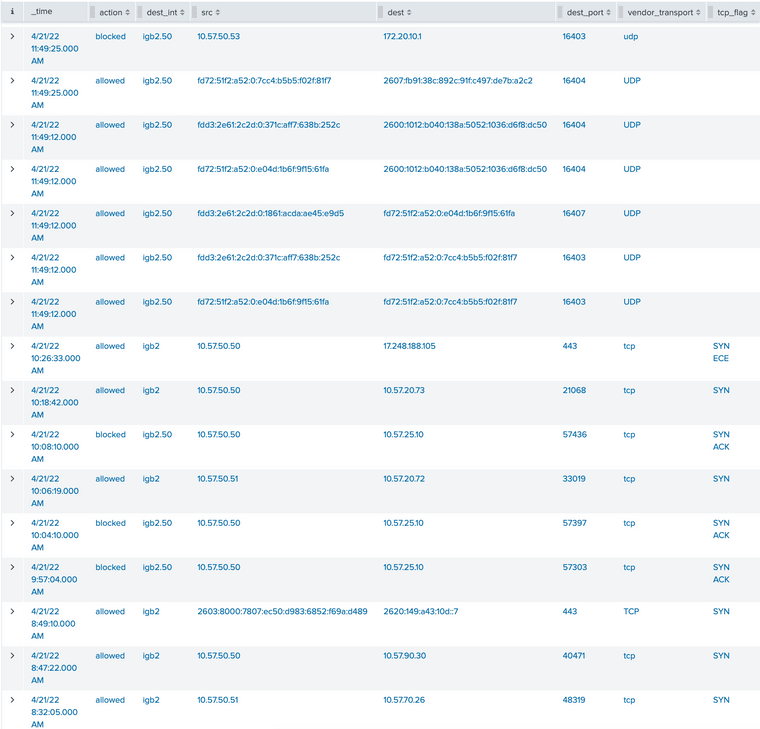
Here's an example of logged traffic that includes
igb2.50in addition toigb2:
-
@offstageroller from the packet capture gui - hmmm no.. But just from console and tcpdump pretty easy...
So I have interface igb2 that has untagged and tagged traffic on it..
So here you can see its seeing my vlan 4 and 6 traffic - and some that is nontagged, the 192.168.2.x network is untagged.
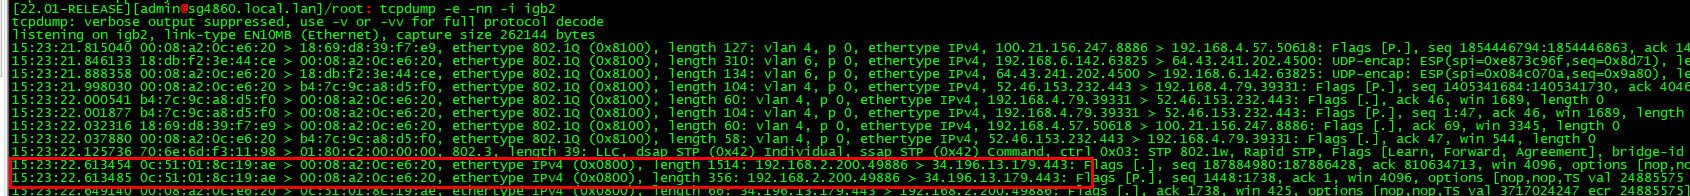
If I just want to see untagged traffic via tcpdump could do this.. Notice the "not vlan"
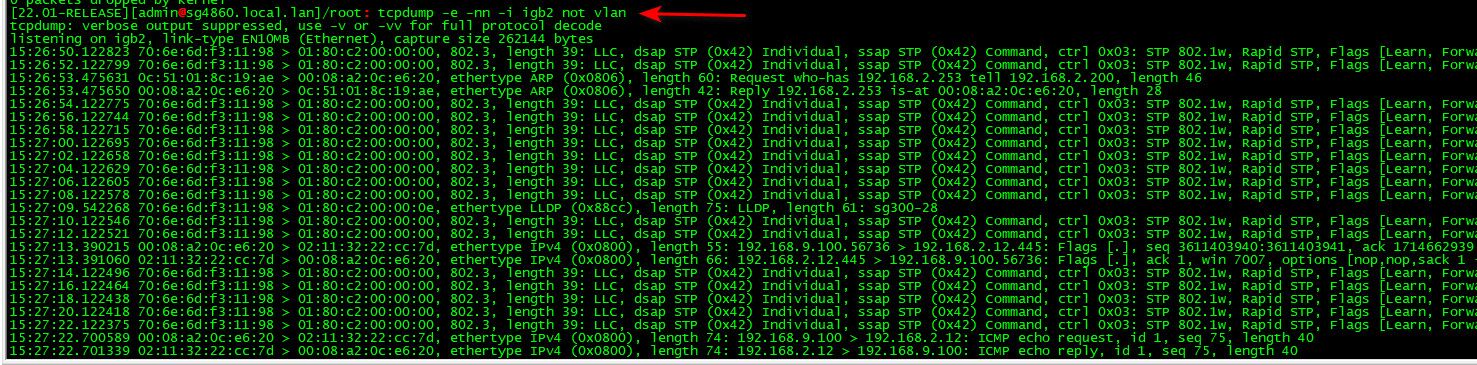
You see just stp traffic, and I see arp traffic from my non tagged network, and also there at the end I started a ping from another vlan so you could see that..
You then can see what mac and IP of what is sending non vlan traffic.
Hope that helps track it down for you.
edit: Reminds me - should really put in a feature request to be able to do some fancier stuff from the packet capture gui.. Some time ago they did add the features of different options in the protocol like just arp, or no arp or carp or no carp, icmp, etc.. But maybe having a option box where you could pass along other filtering options like you can do from cmd line would be slick ;)
There really is so many possible things that someone might want to do, that all of it would be a gargantuan task via gui, but ability to pass options along in say a custom options box would really allow to do some more refined captures via the gui.
-
@johnpoz said in Traffic showing on interface, even though all traffic should be VLAN tagged:
@offstageroller from the packet capture gui - hmmm no.. But just from console and tcpdump pretty easy...
So I have interface igb2 that has untagged and tagged traffic on it..
So here you can see its seeing my vlan 4 and 6 traffic - and some that is nontagged, the 192.168.2.x network is untagged.
If I just want to see untagged traffic via tcpdump could do this.. Notice the "not vlan"
You see just stp traffic, and I see arp traffic from my non tagged network, and also there at the end I started a ping from another vlan so you could see that..
You then can see what mac and IP of what is sending non vlan traffic.
Hope that helps track it down for you.
Thank you @johnpoz for taking the time to help me out! Let me play around with tcpdump and see if I can get any more insight into why this might be happening.
-
@offstageroller happy to help... If you see stuff you have questions on via tcpdump, etc. happy to help.. Happy Hunting..