Prometheus/Grafana Question
-
Hello,
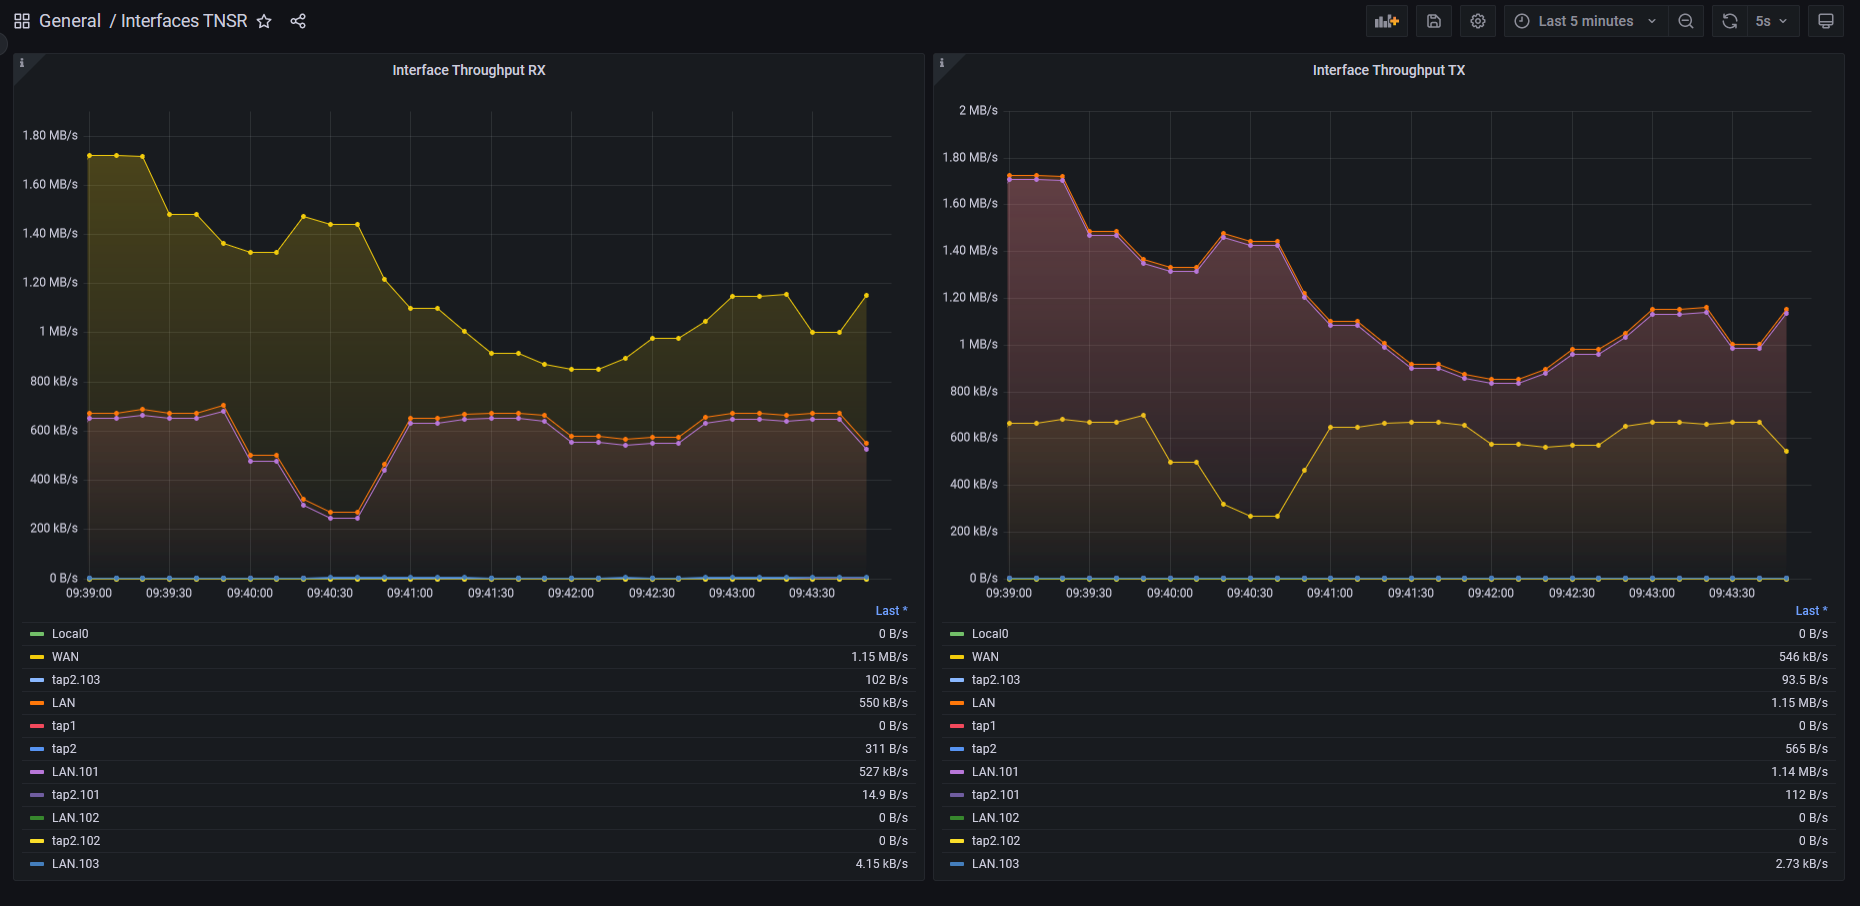
I've recently setup the Prometheus exporter to Grafana and noticed something odd, this may be expected behavior but i figured it would be best to check.
Basic config with just LAN and a few VLAN subinterfaces.
The issue is that the LAN bandwidth also includes all of the subinterfaces bandwidth instead of just the LAN, is this expected?

-
@stevo11811 I’ve noticed this on pfsense as well. I either put the vlans on a separate interface or tag the LAN rather than going untagged. From a security standpoint, for what it’s worth, it is not recommended to use tagged and untagged vlans on the same interface.
-
Hmm, i guess that's a band-aid but running untagged/tagged is required with TNSR i believe.
LAN is an alias for tengigabitethernet1/0 and the VLANs are just subinterfaces.
Ill post config when i'm back home.
-
@stevo11811 nah you just enable the interface and then add the vlans to it. Don’t assign an ip or anything to the interface itself. Been there; done it.
-
My earlier confusion and illumination:
https://forum.netgate.com/topic/152609/question-on-vlans-on-tnsr
-
@gabacho4 Oh man i obviously missed what you were trying to say, I made the config changes this morning, seems to work good. Thanks.
Do you think the untagged interface showing bandwidth for all VLAN's is normal operation?
-
@stevo11811 I think so because the traffic is still transiting that interface physically- if that makes sense.
-
Which metrics are you querying to get the live interface traffic data? I just started setting this up myself and I cannot seem to find the right one, only byte totals used that keeps climbing and never drops. I may be dumb and doing it wrong, though. lol