Firewall log view very slow
-
Initially I thought I had a DNS issue, my main dashboard was really slow to login - around 50 seconds. This would usually points to a DNS issue but I couldn't pin it down as everything seemed correct: diagnostic DNS resolve was quick, I could get to packages quickly, I could get to the system update quickly - internal pfsense functions were seemingly ok.
Then I saw a chance reddit post regarding removing the firewall log widget on the dashboard. This worked, dashboard up in 2 or 3 seconds now.
On to the firewall log and this is very slow to load. All the other logs load up almost instantaneously whereas the firewall log is glacial - 50 seconds for any query or filter. Any idea on how I can begin to fault find this?
The firewall is being run as a VM on dedicated hardware (no other VMS) 8 cores and 10Gb RAM allocated. From the dashboard: Load average 0.41, 1.15, 1.42 with 19% RAM in use so plenty of resources. Backend drive is a set of 4 RAID10 10k SAS dedicated to the firewall. CPU does not go over 20% when I run the firewall log tab, RAM doesnt move at all.
PFsense 2.5.2 "manage log settings" are 2000 GUI log entries, 400000000 bytes with 7 rotations.
-
@jimmychoosshoes said in Firewall log view very slow:
400000000 bytes with 7 rotations.
400MB log files? Those are quite large.. Are you using compression?

-
@jimmychoosshoes Wouldn't you be better off sending the logs to a syslog server and looking at them there?
-
They have been that size since I first installed pfsense waaaay back when. I'll drop them down to 20Mb and see what happens. Im not overly concerned with too much retention, only kept for triage issues.
compression was BZIP2 by the way. IVe cleared the log and everything sped up to instantaneous. So hopefully it was just a case of silly size log file.
-
@jimmychoosshoes depending your retention needs, and how much you are seeing logged, you could prob drop the log size down even further.
For example while not a business or anything, and I don't log a lot of noise anyway.. I have going back like 4 days with my above log settings, 6 log rotation.
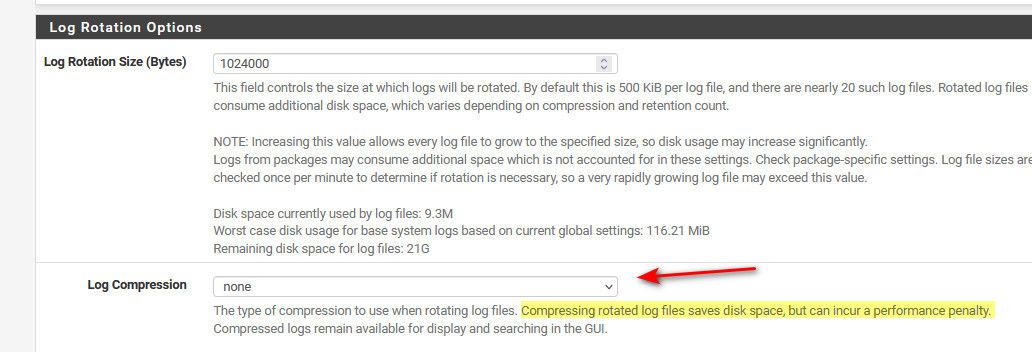
But overall the size might not matter as much as compression.. There have been many a thread about with compression being a performance hit.. They might want to BOLD that performance penalty wording in the note ;)
400MB was never the default, so that must of been set at some time by someone. 512KB has been the default as far back as I can remember.
-
@jimmychoosshoes The UI display and filter only handles 10.000 logentries from the current logfile/rotation. If your current logfile is much larger than 10.000 lines, it becomes REALLY slow to load.
If you want lots of log retention, create a MUCH bigger rotation and use smaller logfiles. This will make the UI much faster since the 10.000 lines does not require loading a 400Mb file. This way you still have a lot of retention.
The only drawback (regardless of which settings you use) is you can’t find older log entries from the UI as that only goes back 10.000 lines in the combined log rotation. So the remaining rotation logs can only be searched from the CLI or som external tool.
I’m still hoping a log analysis/parsing package will be created for pfSense, or that Netgate will create an option for letting the UI filter feature go MUCH further back than 10.000 lines.