Lost WebGui Access after upgrade
-
Scenario: I have recently updated pfsense from 2.5.2 to 2.7.0.
Issue : No WebGui access. SSH is happening.
Step 1 : From 2.5.2 to 2.6.0. This went quite smoothly. I just had to restart webgui on console.
Step 2 : From 2.6.0 to 2.7.0 got struck when using webgui. So I ssh to device and did a manual restart. Update happened without any error except that I lost Gui access. restarting php and webgui is not helping. I can access my box over VPN from WAN. Internet is working fine locally.
SSh is working fine from LAN and via WAN over VPN.Went through the forums but nothing is working. Please help.
Regards, -
Ask your pfSense : SSH or console :
ps ax | grep 'nginx'You should see several lines, and one looks like this :
16541 - Is 0:00.00 nginx: master process /usr/local/sbin/nginx -c /var/etc/nginx-webConfigurator.conf (nginx)Another command to test who is listening on what interface suing what port :
sockstat | grep 'nginx'Using another SSH session :
tail -f /var/log/system.logor
ee /var/log/system.logand see what happened - any errors messages ?
-
@Gertjan Thank you for replying.
- ps ax | grep 'nginx'
379 - I 0:03.19 php-fpm: pool nginx (php-fpm)
380 - I 0:03.28 php-fpm: pool nginx (php-fpm)
19876 - Is 0:00.00 nginx: master process /usr/local/sbin/nginx -c /var/etc/nginx-webConfigurator.conf (nginx)
20113 - I 0:00.01 nginx: worker process (nginx)
20202 - I 0:00.02 nginx: worker process (nginx)
59269 - I 0:03.18 php-fpm: pool nginx (php-fpm)
37150 0 S+ 0:00.00 grep nginx2) **sockstat | grep 'nginx'** ``` root nginx 20202 3 stream -> [20113 10] root nginx 20202 5 tcp4 *:443 *:* root nginx 20202 6 tcp6 *:443 *:* root nginx 20202 7 tcp4 *:80 *:* root nginx 20202 9 tcp6 *:80 *:* root nginx 20202 11 dgram -> /var/run/log root nginx 20202 12 stream -> [20113 3] root nginx 20113 3 stream -> [20202 12] root nginx 20113 5 tcp4 *:443 *:* root nginx 20113 6 tcp6 *:443 *:* root nginx 20113 7 tcp4 *:80 *:* root nginx 20113 9 tcp6 *:80 *:* root nginx 20113 10 stream -> [20202 3] root nginx 20113 13 dgram -> /var/run/log root nginx 19876 3 stream -> [20113 10] root nginx 19876 5 tcp4 *:443 *:* root nginx 19876 6 tcp6 *:443 *:* root nginx 19876 7 tcp4 *:80 *:* root nginx 19876 9 tcp6 *:80 *:* root nginx 19876 10 stream -> [20202 3] root nginx 19876 11 stream -> [20202 12] root nginx 19876 12 stream -> [20113 3]- tail -f /var/log/system.log
No errors
- ps ax | grep 'nginx'
-
Ok so it is running and listening. What error do you get when you try to reach it?
I assume you are trying to connect from the LAN side?
Steve
-
@stephenw10 No errors just a blank page.
It just gives me "Your connection is not private". If I click on proceed, I get pfsense logo on title bar but the page is blank.
I am trying from WAN(over VPN) as well as LAN.
Same result.
-
Hmm, and no errors shown when you restart php and webgui? In the logs?
-
Restarting php n webconfigurator :
In system.log
Restarting php-fpm
check_reload_status is starting
rc.restart_webgui: creating rrd update scriptIs it to do with corrupt rrd.
What should I do ? -
@ashima said in Lost WebGui Access after upgrade:
Is it to do with corrupt rrd.
No. Restarting the rd update script is expected. Even if the rrd files were corrupt it would not stop the gui displaying.
Check for errors in the nginx log: /var/log/nginx.log -
tail /var/log/nginx.log showing following:
Aug 10 18:37:08 NGWBag nginx: 172.16.1.2 - - [10/Aug/2023:18:37:08 +0530] "GET /favicon.ico HTTP/2.0" 200 15086 "https://192.168.37.1/" "Mozilla/5.0 (Windows NT 10.0; Win64; x64; rv:109.0) Gecko/20100101 Firefox/115.0" Aug 10 18:48:36 NGWBag nginx: 172.16.1.2 - - [10/Aug/2023:18:48:36 +0530] "GET / HTTP/1.1" 301 162 "-" "Mozilla/5.0 (Windows NT 10.0; Win64; x64) AppleWebKit/537.36 (KHTML, like Gecko) Chrome/115.0.0.0 Safari/537.36" Aug 10 18:49:02 NGWBag nginx: 172.16.1.2 - - [10/Aug/2023:18:49:02 +0530] "GET / HTTP/2.0" 200 20 "-" "Mozilla/5.0 (Windows NT 10.0; Win64; x64; rv:109.0) Gecko/20100101 Firefox/115.0" Aug 10 18:49:02 NGWBag nginx: 172.16.1.2 - - [10/Aug/2023:18:49:02 +0530] "GET /favicon.ico HTTP/2.0" 200 15086 "https://192.168.37.1/" "Mozilla/5.0 (Windows NT 10.0; Win64; x64; rv:109.0) Gecko/20100101 Firefox/115.0" -
Hmm, no actual requests for pages. have you tested a different client device just to be sure?
-
@ashima said in Lost WebGui Access after upgrade:
It just gives me "Your connection is not private".
That's the "don't use http, use https" message.
Because you are still using http ??
And when you use https, you get another very known message, that tells you that "the certificate (proposed by pfSense) has not been signed by a known trusted authority".Anyway ....
Let continue checking.
Just to be sure :
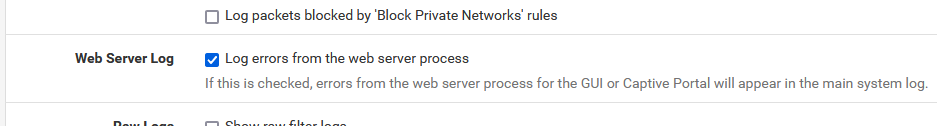
Status > System Logs > Settings
and check
and from now on :
tail -f /var/log/nginx.logFor every page you visit on pfSense (GUI) you will see a log line.
That is, of course, if the request reaches the web server.As we know now that the web server lsuitens on every interface, launch a
curl -k https://127.0.0.1This will show the real pfSense login page. The actual html file that the browser receives.
If your LAN IP is 192.168.1.1, test also :
curl -k https://192.168.1.1Your LAN settings, and LAN firewall rules please.
-
No easy way to set that without access to the gui though....
-
@ashima said in Lost WebGui Access after upgrade:
rc.restart_webgui: creating rrd update script
Is it to do with corrupt rrd.
The message "rc.restart_webgui: creating rrd update script" is normal.
It's not really creating the rrd update script file, it's just assuring that one exists.Why do you think something is corrupt ?
edit : ok, already answered
-
@Gertjan I have no web access. I don't know how to enable Log errors from web server process using command line.
-
@stephenw10 Yes, I tried from different browsers and also from different clients.
-
Is 172.16.1.2 the client you're testing from?
Are the nginx logs you do see current? Do you see new entries each time you try to access the page?
Do you have any port forwards on the firewall for port 443 that might be redirecting requests?
-
- Yes, I am accessing firewall over vpn. 172.16.1.X is tunnel network.
I get the same issue when I try to access from local device.
LAN is 192.168.37.X
- Yes the nginx logs are current with correct time stamp. Yes I see a new entry every time I try to access the webgui.
As suggested by @Gertjan I tried using curl -k -f 127.0.0.1 and curl -k -f 192.168.37,1 I see an entry in nginx log instantly.
- No port forwards. I access the network frome remote only via openvpn.
Is there any other thing that I need to check.
- Yes, I am accessing firewall over vpn. 172.16.1.X is tunnel network.
-
@ashima said in Lost WebGui Access after upgrade:
I don't know how to enable Log errors from web server process using command line.
Of course. Stupid me.
Type
viconfig + enter
/<syslog> + enterNow you'll see the content of the block <syslog> ...... </syslog> which contains the syslog settings.
if there is a line (probably the last in the block) :<nolognginx></nolognginx>then place the cursor on that line, and type
ddand then
ESC (the key on the keyboard, top left) and:wqNow you've existed viconfig.
Exit the command line, your back in the console menu. restart the webConfigurator = option 11.But I presume the web server (webConfigurator) isn't doing anything wrong here, it's working just fine. No need to do this 'viconfig' manipulation.
To check - just to have a look - your firewall rules :
Same thing :viconfigand search for <filter> :
/<filter>if you do not see this :
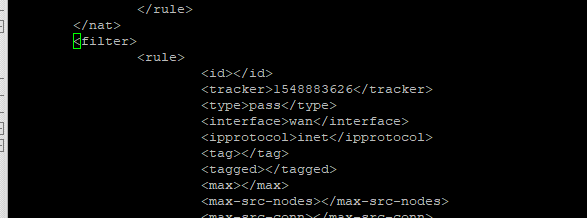
then type n for next :
nNow you see your wan firewall rules lisrted in detail, one by one.
After wan, you have the lan firewall rules.Btw : you can also see the rules here :
cat /tmp/rules.debugMy firewall LAN rules :
...
pass in quick on $LAN inet6 proto udp from fe80::/10 to ff00::/8 port 5352 >< 5356 ridentifier 1607406256 allow-opts keep state label "USER_RULE: Pass link local multicast traffic => 5353/5" label "id:1607406256"
pass in quick on $LAN inet from 192.168.1.0/24 to any ridentifier 1576252665 keep state label "USER_RULE: Years of investigation was needed to find this rule." label "id:1576252665"
pass in quick on $LAN inet6 from 2a01:cb19:907:a6dc::/64 to any ridentifier 1670835584 keep state label "USER_RULE: This one was found faster." label "id:1670835584"
....The GUI identical part :
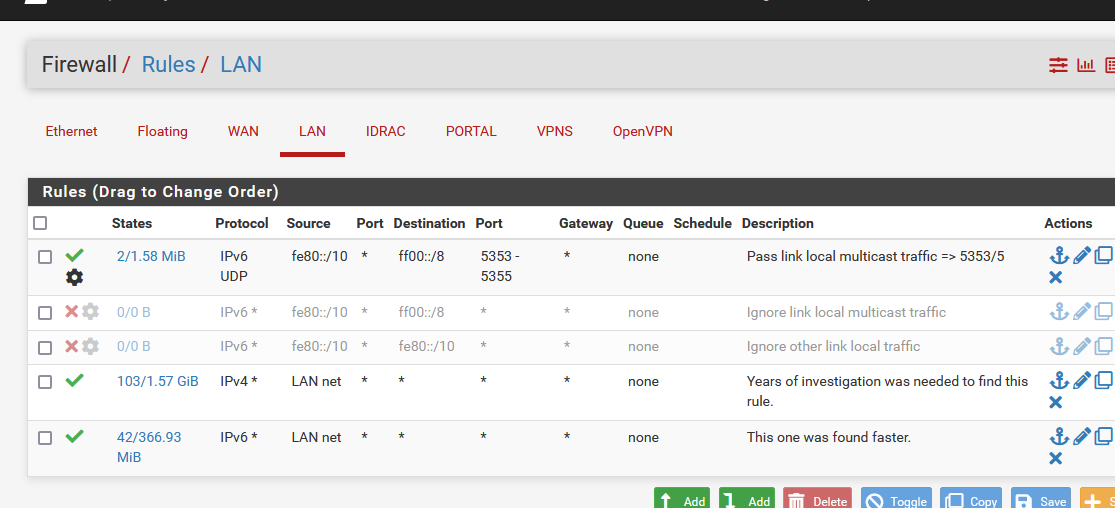
Your issue is : pfSense web gui traffic, http or https, coming from a LAN based device, doesn't arrive, or is blocked at - the LAN interface, so the web server can react on it.
It could be a simple blocking firewall rule.You can't edit the /tmp/rules.debug file, as it is regenerated from the config.xml file.
GUI from OpenVPN works, or not ?
I've been trying to use tcpdump on the command line, with filters for port 80 and destination IP-pfSense and source IP-your-device-on-LAN to check if any web traffic actually reaches your LAN NIC, but I wasn't able to create such a command for myself.
-
Mmm, it seems like the firewall rules must be present since the client here sees the cert error. If it was blocked you would not see anything.
-
@stephenw10
Wow. That's true.
Broken browser ? Device with it's own firewall playing tricks ?@ashima : take your phone, or whatever other device, and use that.