Alert rule triggering Drop rule?


-
And there it is again...
The rule that actually is set to Drop here (ET POLICY PE EXE or DLL Windows file download HTTP) is in the Suppress list since a few days back.
-
@Gblenn said in Alert rule triggering Drop rule?:
And why would the duplicate not have the same properties, like only blocking when Drop?
Because a zombie process will not respond to things the GUI changes. And since certain files are only read once during startup (suppress lists and pass lists being two examples), the zombie process would be totally unaware of anything the user is doing or has previously done in the GUI since the zombie process was started.
-
@Gblenn said in Alert rule triggering Drop rule?:
The rule that actually is set to Drop here (ET POLICY PE EXE or DLL Windows file download HTTP) is in the Suppress list since a few days back.
Is the Suppress List currently actively assigned to the interface where the block is happening?
And is the Suppress List entry for the SID, or was it created for a particular source or destination IP address? There are three methods for filtering suppress list entries: (1) by source IP; (2) by destination IP; or (3) by SID.
-
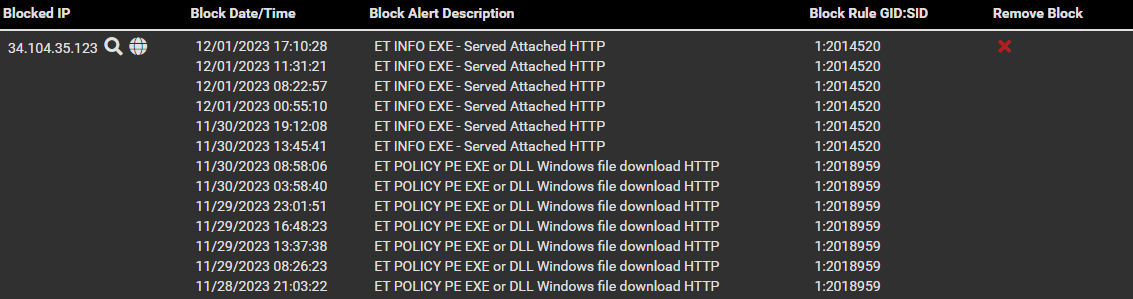
@bmeeks The suppress list is the auto generated list for the only interface which Suricata is running on. The entry is for the SID only.
And that rule (ET POLICY PE EXE or DLL Windows file download HTTP) does not show up since I put it into the suppress list yesterday (30th). You can see it from the time stamps.
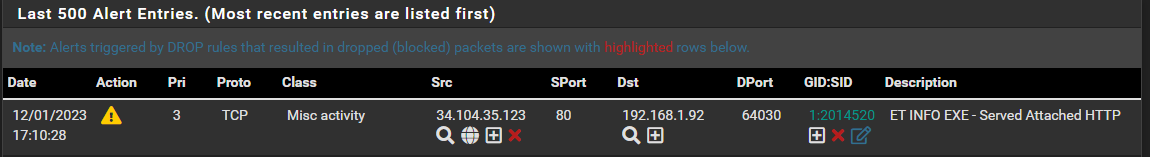
Actually the last time it was "used" was 09:11 on the 30th as in the picture in my first post. There is no listing in the block.log file after that. So as far as I can see, the suppress list is working fine.The block.log file has some 17 entries since this morning. There are a number of ET SCAN, ET CINS, ET POLICY and ET 3CORESec entries. And then there are 7 instances like this one:
12/01/2023-17:10:28.679875 [Block Src] [] [1:2014520:8] ET INFO EXE - Served Attached HTTP [] [Classification: Misc activity] [Priority: 3] {TCP} 34.104.35.123:80
I don't get it... So if it's not a zombie process, what is going on?
-
@Gblenn said in Alert rule triggering Drop rule?:
I don't get it... So if it's not a zombie process, what is going on?
Is the assigned Suppress List (as shown on the INTERFACE SETTINGS tab) actually getting parsed when the instance starts up? Look in the
suricata.logfile after starting the interface and you should see an entry about parsing the Suppress List (I think Suricata calls it "Threshold" or something similar). If I recall correctly, it will tell you home many entries it read and parsed from the assigned list. -
@bmeeks Yes the suppress list is correctly showing up in Interface Settings. And I can see that it has parsed the right number of rules in suricata.log (Threshold)
I just tried commenting out one of the rules in the suppress list and the number correctly changed in the log file, so that appears to be working as well.
-
I think I have seen this as well, Suppress List was not working for some SID.
-
@Bob-Dig But I think the suppress list is actually working.
At least I can't see any references in the Blocks tab, or the block.log list to that SID after I entered it into the suppress list.
The strange thing here is the other rule which has Alert Action, but still triggers a Block. It shows up in both logs and both tabs.
This rule has Alert action and should NOT trigger a bock, yet here it is (again today) from the block.log file.
12/02/2023-12:49:51.351046 [Block Src] [] [1:2014520:8] ET INFO EXE - Served Attached HTTP [] [Classification: Misc activity] [Priority: 3] {TCP} 172.217.21.164:80 -
I'm about to give up on this... having Alert rules triggering Block just doesn't work. I can suppress or disable these Alert rules as well I suppose, But will I have to do that we all Alert rules then? Since any one Alert rule could potentially trigger a Block action...
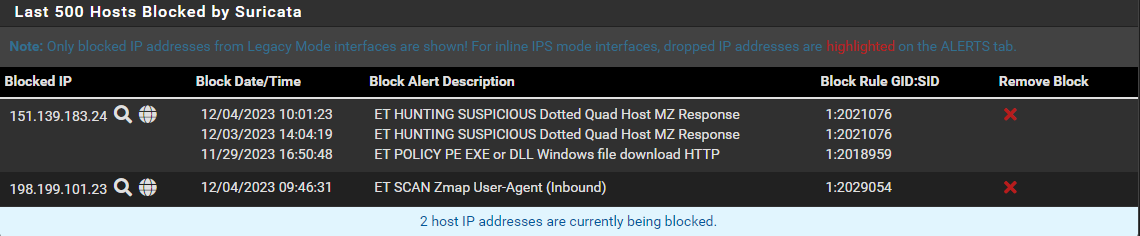
Just now it was SID 1:2021076, showing up in the Blocked list, blocking the IP which originally was blocked by 1:2018959 (which is now in suppress list).
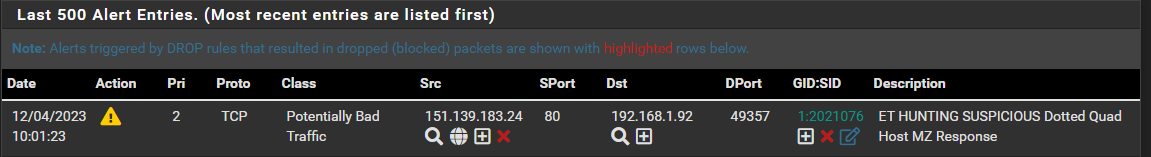
And here it is in the Alert list, the only place it should be...
-
@Gblenn: search for the SID in the active rules file and let's see what the real action verb is set for. Do that as follows:
-
Open a shell prompt on the firewall console either directly (if you have physical access) or via an SSH login from an available client PC (probably easier and what I would suggest).
-
Navigate to the interface's active rules file at
/usr/local/etc/suricata/suricata_xxxx/rules/suricata.rules(wheresuricata_xxxxis a directory name containing the physical interface descriptor along with a UUID). -
Search the active rules file for the target SID as follows:
grep 2021076 suricata.rulesThat should print out the line from the file containg that rule and you can examine the actual action verb Suricata is loading for the rule.
-
-
@bmeeks Thanks, here's what it looks like, and it's set to alert:
alert http $EXTERNAL_NET any -> $HOME_NET any (msg:"ET HUNTING SUSPICIOUS Dotted Quad Host MZ Response"; flow:established,to_client; flowbits:isset,http.dottedquadhost; file_data; content:"MZ"; within:2; content:"PE|00 00|"; distance:0; classtype:bad-unknown; sid:2021076; rev:2; metadata:created_at 2015_05_08, former_category INFO, updated_at 2015_05_08;)
The other rule is as expected set to drop...
drop http $EXTERNAL_NET any -> $HOME_NET any (msg:"ET POLICY PE EXE or DLL Windows file download HTTP"; flow:established,to_client; flowbits:isnotset,ET.http.binary; flowbits:isnotset,ET.INFO.WindowsUpdate; file_data; content:"MZ"; within:2; byte_jump:4,58,relative,little; content:"PE|00 00|"; distance:-64; within:4; flowbits:set,ET.http.binary; classtype:policy-violation; sid:2018959; rev:4; metadata:created_at 2014_08_19, former_category POLICY, updated_at 2017_02_01;)
-
@Gblenn said in Alert rule triggering Drop rule?:
@bmeeks Thanks, here's what it looks like, and it's set to alert:
alert http $EXTERNAL_NET any -> $HOME_NET any (msg:"ET HUNTING SUSPICIOUS Dotted Quad Host MZ Response"; flow:established,to_client; flowbits:isset,http.dottedquadhost; file_data; content:"MZ"; within:2; content:"PE|00 00|"; distance:0; classtype:bad-unknown; sid:2021076; rev:2; metadata:created_at 2015_05_08, former_category INFO, updated_at 2015_05_08;)
The other rule is as expected set to drop...
drop http $EXTERNAL_NET any -> $HOME_NET any (msg:"ET POLICY PE EXE or DLL Windows file download HTTP"; flow:established,to_client; flowbits:isnotset,ET.http.binary; flowbits:isnotset,ET.INFO.WindowsUpdate; file_data; content:"MZ"; within:2; byte_jump:4,58,relative,little; content:"PE|00 00|"; distance:-64; within:4; flowbits:set,ET.http.binary; classtype:policy-violation; sid:2018959; rev:4; metadata:created_at 2014_08_19, former_category POLICY, updated_at 2017_02_01;)
Have you restarted Suricata on this interface since changing the rule action?
Also I'm not clear if you changed the rule action using the icons on the ALERTS tab or if you are doing everything solely through SID MGMT tab features.
The custom blocking module code explicitly checks an internal flag set by the Suricata binary before proceeding with a block. Here is the pertinent code section:
/* Don't block on alerts where SIG_FLAG_NOALERT is set for the Signature */
if (pa->s->flags & SIG_FLAG_NOALERT) {
    continue;
}
SC_ATOMIC_ADD(alert_pf_alerts, 1);

 /* If blocking only DROP rules and alert is not from a DROP rule, ignore it */
if (apft->ctx->block_drops && !(PacketCheckAction(p, ACTION_DROP))) {
    continue;
}
The "continue;" statement above means when the checked condition is true the loop continues to process the next alert from the packet (in case multiple rules triggered on a given packet). But it skips the blocking stuff.
-
@bmeeks About three weeks ago I did some testing with Inline mode but wasn't getting the performance I wanted. So I quickly changed back to legacy mode although this time I set it to Block on Drop Only.
I then started using SID Mgmt and added most of the Emerging Threats rules lists to the drop.conf list.
There were two lists which I did NOT change however, and these were ET INFO and ET HUNTING, which is where these alert rules are found.
I did at one point set all of the ET lists to Drop, when I was still figuring out how SID Mgmt worked... But since then I made a couple of restarts of Suricata as well as pfsense. In addition I did a complete shut down 5 days ago, as well as restarting Suricata 2 days ago... and again just now while writing this.
I use SID Mgmt to Disable QUIC and STREAM lists and a number of individual listings I previously had in the Suppress list, prior to changing to Block on Drop Only.
After having this issue I put sid:2018959 in the Suppress list using the GUI. Meaning I pressed the plus sign in the GID:SID column...
So in the picture above, 2021076 has Alert action and 2018959 is suppressed, yet both show up in the Blocks tab (and block.log).
Greping for any of the rules I currently have in the Suppress list, gives me a result consistent with what I listed above. Meaning I see the info including the expected action Drop or Alert.
Greping for rules which are in the SID Mgmt Disable.conf list, gives me empty result, (not present in suricata.rules).
Yet, none of the other rules which are in the suppress list have generated an Alert or a Block since a week back, or more. And I know at least a few of them would have, since they are related to my sons PC which would trigger both Discord and Minecraft related rules.
-
Was doing some maintenance today and made a complete shutdown of the machine. Nothing seems to have changed though, still having rules with Alert action triggering blocks...

-
@Gblenn said in Alert rule triggering Drop rule?:
Was doing some maintenance today and made a complete shutdown of the machine. Nothing seems to have changed though, still having rules with Alert action triggering blocks...
The only possibilty I know of is that internally the Suricata binary is tagging that packet with DROP for some other reason. If you are running an EVE JSON logging configuration, you can search through the EVE JSON log to find any entries related to that SID. EVE provides detailed logging information including "drop reason". A packet might have been marked as "drop" because it matches a closed flow or triggered some other internal Suricata consistency check.
The custom blocking module is not looking at the actual triggered rule's text when determining if a packet should be dropped. It is instead looking for a flag set in a memory structure of alerts related to that rule (SID). There are other reason's why Suricata's internal engine might set that drop flag. Those should be logged in the matching EVE JSON entry.
Here is a list from the Suricata source of the various reasons a packet might get marked with the "drop" flag: https://github.com/OISF/suricata/blob/13cc49388523ba19d3b5b1e72063ca7f0f444be6/src/decode.c#L827. These reasons should be logged in the EVE JSON log when you find the matching alert entry there.
-
@bmeeks Quite a lot of "stuff" in those files... not 100% sure what to look for except (block, alert, action etc?)
Anyway, first off I see this in the block.log (same SID as before):

And in the Alerts tab I have this with the same time stamp:

And here's from the eve.json file, where I find what I think is the start of what is related to this rule (2021076)? And I believe it ends with ..."bytes 0-1048575/2426344"}]}}
After the first bit of readable info, there's a lot of garbled info, or binary i guess, and possibly hash data, mixed in with text. I think I have figured out that this is actually a MS download of AV data?
But from what I can see it looks like action:allowed ??
{"timestamp":"2023-12-06T14:59:47.731754+0100","flow_id":2024081892321530,"in_iface":"ix1",
"event_type":"alert","src_ip":"151.139.183.24","src_port":80,"dest_ip":"192.168.1.92","dest_port":55069,"proto":"TCP","pkt_src":"wire/pcap","metadata":{"flowbits":["exe.no.referer","http.dottedquadhost","file.exe","ET.http.binary"]},"tx_id":1,"alert":{"action":"allowed","gid":1,"signature_id":2021076,"rev":2,"signature":"ET HUNTING SUSPICIOUS Dotted Quad Host MZ Response","category":"Potentially Bad Traffic","severity":2,"metadata":{"created_at":["2015_05_08"],"former_category":["INFO"],"updated_at":["2015_05_08"]}},"http":{"hostname":"151.139.183.24","url":"/c/msdownload/update/software/defu/2023/12/am_base_patch1_46a562cb0306caf4167e4ca4cf496900c24dd090.exe?cacheHostOrigin=11.au.download.windowsupdate.com","http_user_agent":"Microsoft-Delivery-Optimization/10.0","http_content_type":"application/octet-stream","content_range":{"raw":"bytes 0-1048575/2426344","start":0,"end":1048575,"size":2426344},"http_method":"GET","protocol":"HTTP/1.1","status":206,"length":14052,"http_response_body_printable":"MZ...........@...............................................!..L.!This program cannot be run in DOS mode.\r\r\n......It then goes on with a lot of unintelligible data and something I think I have identified as a MS AV signature download based on text in the middle of all the data: /c/msdownload/update/software/defu/2023/12/am_base_patch1
Not sure what this is though?? It sais mode=block, but could that be info the MS AV??
"payload_printable":"HTTP/1.1 206 Partial Content\r\nServer: nginx\r\nDate: Wed, 06 Dec 2023 13:59:21 GMT\r\nContent-Type: application/octet-stream\r\nContent-Length: 2\r\nConnection: keep-alive\r\nCache-Control: public,max-age=172800\r\nLast-Modified: Tue, 05 Dec 2023 23:30:43 GMT\r\nX-Powered-By: ASP.NET\r\nX-CID: 10003\r\nX-CCC: b16aeb46-c642-459e-b5ae-4d702fbef56e\r\nContent-Security-Policy: default-src 'self' http: https: data: blob: 'unsafe-inline'\r\nX-XSS-Protection: 1; mode=block\r\nX-Frame-Options: SAMEORIGIN\r\nX-Cache-Status: HIT\r\nContent-Range: bytes 0-1/2426344\r\n\r\nMZHTTP/1.1 206 Partial Content\r\nServer: nginx\r\nDate: Wed, 06 Dec 2023 13:59:21 GMT\r\nContent-Type: application/octet-stream\r\nContent-Length: 1048576\r\nConnection: keep-alive\r\nCache-Control: public,max-age=172800\r\nLast-Modified: Tue, 05 Dec 2023 23:30:43 GMT\r\nX-Powered-By: ASP.NET\r\nX-CID: 10003\r\nX-CCC: b16aeb46-c642-459e-b5ae-4d702fbef56e\r\nContent-Security-Policy: default-src 'self' http: https: data: blob: 'unsafe-inline'\r\nX-XSS-Protection: 1; mode=block\r\nX-Frame-Options: SAMEORIGIN\r\nX-Cache-Status: HIT\r\nContent-Range:
-
@Gblenn: here is a link to the official upstream Suricata documentation describing all the EVE JSON logging fields: https://docs.suricata.io/en/latest/output/eve/eve-json-format.html.
Scroll down that page and read the section titled Verdict. My suspicion in your example is that Verdict is being set to "drop" by one of the other criteria listed in the C source code snippet I provided a link to earlier. Suricata can flag a packet to be dropped (by giving a Verdict of "drop") for reasons besides just the rule action keyword.
This is a popular and often-used tool to query JSON logs. I'm not sure it's available for pfSense directly (probably not), but you can download versions for several platforms here: https://jqlang.github.io/jq/download/. You could install
jqon your Windows PC, transfer the EVE JSON logs over using WinSCP, then search and analyze them usingjqto see if my suspicion is correct. -
@bmeeks Thanks a lot for helping me trying to figure this out!!
I have been using an editor to read the .json files and searching for anything I thought could be relevant, like "drop", "alert", "action", "block" etc. It works fine I think, although it doesn't present each event on single rows...
I wonder if there are things I'm not logging still? I can find most or all the different things like event types, action etc.
However, there is nothing in any of my eve.json files relating to what is stated about Verdict (that word does not appear at all, but perhaps it shouldn't?). Neither do the words "drop", "reject" or "reject_target"... nothing...When I search for the IP related to the rule in question, (151.139.183.24) it does show up quite a number of times, starting about 12 seconds before sid 2021076 appears.
I have 7 of these instanses before the blocking occurs, but only two have the same flow id. These two are event_type http and file_info (all of them are in fact).
{"timestamp":"2023-12-06T14:59:47.672461+0100","flow_id":2024081892321530,"in_iface":"ix1","event_type":"fileinfo","src_ip":"151.139.183.24","src_port":80,"dest_ip":"192.168.1.92","dest_port":55069,"proto":"TCP","pkt_src":"wire/pcap","metadata":{"flowbits":["exe.no.referer","http.dottedquadhost","file.exe"]},"http":{"hostname":"151.139.183.24","url":"/c/msdownload/update/software/defu/2023/12/am_base_patch1_46a562cb0306caf4167e4ca4cf496900c24dd090.exe?cacheHostOrigin=11.au.download.windowsupdate.com","http_user_agent":"Microsoft-Delivery-Optimization/10.0","http_content_type":"application/octet-stream","content_range":{"raw":"bytes 0-1/2426344","start":0,"end":1,"size":2426344},"http_method":"GET","protocol":"HTTP/1.1","status":206,"length":2},"app_proto":"http","fileinfo":{"filename":"/c/msdownload/update/software/defu/2023/12/am_base_patch1_46a562cb0306caf4167e4ca4cf496900c24dd090.exe","gaps":false,"state":"CLOSED","stored":false,"size":2,"start":0,"end":1,"tx_id":0}}
Nothing here to indicate this has been evaluated and given any "verdict"?? The following item is the one I pasted above: {"timestamp":"2023-12-06T14:59:47.731754 and so on...
And the only reference to some "action" or evaluation is what you see in bold here, plus those two mode=block I mentioned which I think are not related to suricata?
"alert":{"action":"allowed","gid":1,"signature_id":2021076,"rev":2,"signature":"ET HUNTING SUSPICIOUS Dotted Quad Host MZ Response"
What makes me curious is that greping ALL 7 days worth of eve.json files for "action":"blocked" gives me nothing...
There isn't even one single event with block action in any of those files. To verify I tried greping individual SID's which I know should, and also do generate blocking, as they are set to Drop.Below is the output from greping one sid that doesn't occur too often:
'find /var/log/suricata/suricata_ix128603 -type f -name 'eve.json.' -exec grep '2403379' {} +'*/var/log/suricata/suricata_ix128603/eve.json.2023_1202_0850:{"timestamp":"2023-12-02T08:42:07.457953+0100","flow_id":2248369872475030,"in_iface":"ix1","event_type":"alert","src_ip":"71.6.199.23","src_port":17340,"dest_ip":"192.168.1.18","dest_port":80,"proto":"TCP","pkt_src":"wire/pcap","alert":{"action":"allowed","gid":1,"signature_id":2403379,"rev":87975,"signature":"ET CINS Active Threat Intelligence Poor Reputation IP group 80","category":"Misc Attack","severity":2,"metadata":{"affected_product":["Any"],"attack_target":["Any"],"created_at":["2013_10_08"],"deployment":["Perimeter"],"signature_severity":["Major"],"tag":["CINS"],"updated_at":["2023_12_01"]}},"direction":"to_server","flow":{"pkts_toserver":1,"pkts_toclient":0,"bytes_toserver":58,"bytes_toclient":0,"start":"2023-12-02T08:42:07.457953+0100","src_ip":"71.6.199.23","dest_ip":"192.168.1.18","src_port":17340,"dest_port":80},"payload_printable":"","stream":0,"packet":"prhwJhx8kBsObbeFCABFAAAsCv8AAGMGfPVHBscXwKgBEkO8AFC1fPCEAAAAAGAClb9IgQAAAgQFtA==","packet_info":{"linktype":1}}
/var/log/suricata/suricata_ix128603/eve.json.2023_1130_1700:{"timestamp":"2023-11-30T16:45:15.264026+0100","flow_id":852509610708298,"in_iface":"ix1","event_type":"alert","src_ip":"80.120.241.118","src_port":8080,"dest_ip":"192.168.1.29","dest_port":6881,"proto":"UDP","pkt_src":"wire/pcap","alert":{"action":"allowed","gid":1,"signature_id":2403379,"rev":87927,"signature":"ET CINS Active Threat Intelligence Poor Reputation IP group 80","category":"Misc Attack","severity":2,"metadata":{"affected_product":["Any"],"attack_target":["Any"],"created_at":["2013_10_08"],"deployment":["Perimeter"],"signature_severity":["Major"],"tag":["CINS"],"updated_at":["2023_11_29"]}},"app_proto":"failed","direction":"to_server","flow":{"pkts_toserver":1,"pkts_toclient":0,"bytes_toserver":55,"bytes_toclient":0,"start":"2023-11-30T16:45:15.264026+0100","src_ip":"80.120.241.118","dest_ip":"192.168.1.29","src_port":8080,"dest_port":6881},"payload":"XC5jcVg4VH1vZA4IVQ==","payload_printable":"\.cqX8T}od..U","stream":0,"packet":"yqgP9d0gkBsObbeFCABFAAApOkxAADIRCsRQePF2wKgBHR+QGuEAFYLcXC5jcVg4VH1vZA4IVQ==","packet_info":{"linktype":1}}
-
@Gblenn: you may not have that option enabled. It's relatively new in Suricata.
Look for Engine Verdict in the EVE Output Settings section of the INTERFACES EDIT tab. See if that option is enabled. If not, enable it, save the change, and restart Suricata on the interface so the binary picks up the change.
-
