High CPU usage after upgrading to 2.7.1 Community Edition in XenServer
-
Hi,
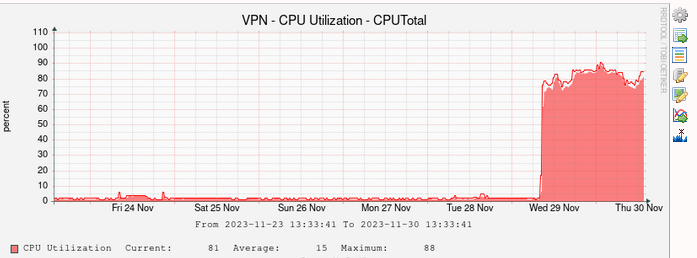
I have three pfSense VM's (running on XenServer). Yesterday I upgraded all of them to 2.7.1 Community Edition. Today I noticed that all of them are showing a high CPU usage. More specifically, ''top' indicates ~75% of CPU used by interrupts, and this started after the upgrade on all of them. A reboot does not solve the problem.
Any ideas on what I should check?
Packages I have installed:
acme (for let's encrypt certificates)
net-snmp
xe-guest-utilities (installed from cli)Each VM has 1GB RAM and 5GB disk.
CPU graph from the last week (upgrade was yesterday):
-
 J jimp moved this topic from Problems Installing or Upgrading pfSense Software on
-
What does
top -HaSPactually show?Steve
-
@stephenw10 said in High CPU usage after upgrading to 2.7.1 Community Edition:
top -HaSP
last pid: 10674; load averages: 1.06, 0.74, 0.67 up 2+02:03:10 10:34:50 254 threads: 2 running, 231 sleeping, 21 waiting CPU: 0.8% user, 0.0% nice, 0.0% system, 79.5% interrupt, 19.8% idle Mem: 30M Active, 86M Inact, 549M Wired, 267M Free ARC: 348M Total, 134M MFU, 140M MRU, 153K Anon, 2630K Header, 71M Other 223M Compressed, 583M Uncompressed, 2.62:1 Ratio Swap: 1024M Total, 62M Used, 962M Free, 6% Inuse PID USERNAME PRI NICE SIZE RES STATE TIME WCPU COMMAND 11 root 187 ki31 0B 16K RUN 49.2H 95.43% [idle] 95375 root 26 0 14M 3748K RUN 0:00 0.08% top -HaSP 34265 root 20 0 13M 1372K bpf 1:02 0.05% /usr/local/sbin/filterlog -i pflog0 -p /var/run/filterlog.pid 7 root -16 - 0B 16K pftm 0:31 0.04% [pf purge] 10674 root 68 0 12M 1832K nanslp 0:00 0.03% sleep 60 12 root -64 - 0B 320K WAIT 0:38 0.03% [intr{irq2109: xn0}] 13663 root 20 0 13M 2012K select 0:33 0.02% /usr/sbin/syslogd -O rfc3164 -s -c -c -l /var/dhcpd/var/run/log -P /var/run/syslog 2 root -60 - 0B 16K WAIT 1:21 0.02% [clock] 85614 root 20 0 22M 10M select 0:00 0.02% sshd: root@pts/0 (sshd) 12 root -64 - 0B 320K WAIT 0:12 0.02% [intr{irq2107: xn0}] 71807 root 20 0 13M 1176K nanslp 0:17 0.01% /usr/local/bin/dpinger -S -r 0 -i GW_WAN_2 -B 2801:88:fd::30 -p /var/run/dpinger_G 8216 root 20 0 33M 5636K select 0:36 0.01% /usr/local/sbin/snmpd -LS 0-6 d -p /var/run/net_snmpd.pid -M /usr/share/snmp/mibs/ 71378 root 20 0 13M 1172K nanslp 0:14 0.01% /usr/local/bin/dpinger -S -r 0 -i GW_WAN -B 200.145.62.30 -p /var/run/dpinger_GW_W -
Hmm, I expect more output from that. Was that actually from the CLI?
It should look like:
[2.7.1][admin@t70.stevew.lan]/root: top -HaSP

last pid: 37169;  load averages:  0.25,  0.13,  0.09                                                                                                                                       up 0+18:04:15  15:23:24
317 threads:   5 running, 293 sleeping, 19 waiting
CPU 0:  0.0% user,  1.5% nice,  0.0% system,  0.0% interrupt, 98.5% idle
CPU 1:  0.4% user,  0.0% nice,  0.4% system,  0.0% interrupt, 99.2% idle
CPU 2:  0.8% user,  0.0% nice,  0.4% system,  0.0% interrupt, 98.8% idle
CPU 3: 26.3% user,  0.0% nice,  2.7% system,  0.0% interrupt, 71.0% idle
Mem: 52M Active, 577M Inact, 54M Laundry, 864M Wired, 294M Free
ARC: 573M Total, 249M MFU, 247M MRU, 3832K Header, 73M Other
     440M Compressed, 924M Uncompressed, 2.10:1 Ratio
Swap: 1024M Total, 80M Used, 943M Free, 7% Inuse

  PID USERNAME    PRI NICE   SIZE    RES STATE    C   TIME    WCPU COMMAND
   11 root        187 ki31     0B    64K CPU2     2  17.6H  99.20% [idle{idle: cpu2}]
   11 root        187 ki31     0B    64K CPU1     1  17.5H  99.15% [idle{idle: cpu1}]
   11 root        187 ki31     0B    64K CPU0     0  17.7H  98.54% [idle{idle: cpu0}]
   11 root        187 ki31     0B    64K RUN      3  17.6H  71.01% [idle{idle: cpu3}]
63065 root         52   20   603M   517M uwait    0  24:59   0.89% /usr/local/bin/suricata -i igb1 -D -c /usr/local/etc/suricata/suricata_60565_igb1/suricata.yaml --pidfile /var/run/suricata_igb160565.pid{FM#01
36459 root         24    0    14M  3864K CPU3     3   0:00   0.35% top -HaSP
63065 root         52   20   603M   517M nanslp   2   5:23   0.21% /usr/local/bin/suricata -i igb1 -D -c /usr/local/etc/suricata/suricata_60565_igb1/suricata.yaml --pidfile /var/run/suricata_igb160565.pid{suric
    0 root        -64    -     0B  1488K -        0   5:13   0.21% [kernel{dummynet}]
    0 root        -60    -     0B  1488K -        2   2:03   0.16% [kernel{if_config_tqg_0}]
25675 root         20    0    12M  1288K select   2   0:35   0.07% /usr/sbin/powerd -b hadp -a hadp -n hadp
29370 root         20    0    22M    10M select   3   0:00   0.03% sshd: admin@pts/0 (sshd)
    7 root        -16    -     0B    16K pftm     1   0:45   0.03% [pf purge]
However your output shows 95% idle in total which doesn't match what you're seeing in the hypervisor.
-
Yes, that's the full output from the cli for 'top -HaSP'. Maybe it's a little shorter because I only allocated a single CPU for the VM. Considering that with this setup I never saw an usage above 10-15%, I never considered adding more.
-
Ah, OK. And it's still showing 80-90% use in the hypervisor?
-
Yes. As an experiment, I rebooted the VM with 4 CPU's. This was the result:
last pid: 81307; load averages: 0.50, 0.27, 0.11 up 0+00:02:22 13:59:21
311 threads: 5 running, 279 sleeping, 27 waiting
CPU 0: 0.0% user, 0.0% nice, 0.0% system, 66.3% interrupt, 33.7% idle
CPU 1: 0.0% user, 0.0% nice, 0.0% system, 47.7% interrupt, 52.3% idle
CPU 2: 0.0% user, 0.0% nice, 0.0% system, 44.4% interrupt, 55.6% idle
CPU 3: 0.0% user, 0.0% nice, 0.0% system, 67.7% interrupt, 32.3% idle
Mem: 113M Active, 81M Inact, 259M Wired, 477M Free
ARC: 106M Total, 29M MFU, 73M MRU, 16K Anon, 601K Header, 3111K Other
80M Compressed, 179M Uncompressed, 2.24:1 Ratio
Swap: 1024M Total, 1024M FreePID USERNAME PRI NICE SIZE RES STATE C TIME WCPU COMMAND
11 root 187 ki31 0B 64K CPU2 2 2:10 99.83% [idle{idle: cpu2}]
11 root 187 ki31 0B 64K RUN 1 2:20 99.82% [idle{idle: cpu1}]
11 root 187 ki31 0B 64K CPU3 3 2:19 99.77% [idle{idle: cpu3}]
11 root 187 ki31 0B 64K CPU0 0 2:20 99.72% [idle{idle: cpu0}]
12 root -64 - 0B 368K WAIT 2 0:00 0.10% [intr{irq15: ata1}]
43244 root 20 0 14M 4236K CPU1 1 0:00 0.07% top -HaSP
12 root -64 - 0B 368K WAIT 2 0:00 0.06% [intr{irq2129: xbd0}]
2 root -60 - 0B 64K WAIT 0 0:00 0.06% [clock{clock (0)}]
0 root -12 - 0B 1536K - 1 0:00 0.06% [kernel{z_wr_iss_2}] -
Hmm, interesting. If you disable or uninstall the xe-guest-utilities does that usage stop?
-
@stephenw10
Unfortunately, no, it didn't help:
top -HaSPb
last pid: 85886; load averages: 0.07, 0.14, 0.07 up 0+00:04:15 08:27:14
309 threads: 5 running, 277 sleeping, 27 waiting
CPU 0: 3.3% user, 0.0% nice, 0.0% system, 54.1% interrupt, 42.6% idle
CPU 1: 4.0% user, 0.0% nice, 0.0% system, 44.0% interrupt, 52.0% idle
CPU 2: 4.2% user, 0.0% nice, 0.0% system, 47.4% interrupt, 48.4% idle
CPU 3: 4.0% user, 0.0% nice, 0.0% system, 42.5% interrupt, 53.5% idle
Mem: 112M Active, 81M Inact, 261M Wired, 476M Free
ARC: 107M Total, 29M MFU, 74M MRU, 160K Anon, 602K Header, 3220K Other
80M Compressed, 180M Uncompressed, 2.24:1 Ratio
Swap: 1024M Total, 1024M FreePID USERNAME PRI NICE SIZE RES STATE C TIME WCPU COMMAND
11 root 187 ki31 0B 64K RUN 1 4:14 100.00% [idle{idle: cpu1}]
11 root 187 ki31 0B 64K CPU0 0 4:13 100.00% [idle{idle: cpu0}]
11 root 187 ki31 0B 64K CPU3 3 4:12 100.00% [idle{idle: cpu3}]
11 root 187 ki31 0B 64K CPU2 2 4:01 100.00% [idle{idle: cpu2}]
0 root -16 - 0B 1536K swapin 3 0:46 0.00% [kernel{swapper}]
16 root -60 - 0B 80K - 1 0:02 0.00% [usb{usbus0}]
2 root -60 - 0B 64K WAIT 0 0:01 0.00% [clock{clock (0)}]To make sure it wasn't anything related to xen-guest, I also undid all the configurations related to installing this package (as in: disabling hardware offloading both via cli and web interface) and rebooted the VM, but the load, as shown above, remains high. Any suggestions?
Thank you,
DrydenK
-
Give it 4GB ram and 10GB disk... and reboot/reinstall.
-
@Cool_Corona
About reinstall, I will consider it.About 4GB and 10GB disk, that makes very little sense. As shown in the output of top, the VM is barely using half of the 1GB it has (476MB free and 0 usage of swap), and 'df' shows that it's using 37% of the 5GB of the disk.
-
@DrydenK-0 I cant give you good arguments. Odd things happen when memory and disk is low/small. Try it.
-
I tried reinstalling the VM from scratch and then reloading it with my setup. The result is still the same high load.
Since it was just a reload away, I tried increasing memory to 4GB (I had already used 10gb for disk). Still, no change as seen below.
Also, to isolate if it's something in my setup, I did a new install and checked top before setting anything. With pfSense still on the initial setup web page, I went to the command line and ran 'top -HaSP'. Even with nothing set, the result was still the same with a very high interrupt load.
Since no one else seems to be seeing this, my conclusion is that it may be something related to virtualization in Citrix-Xen.
top -HaSPb
last pid: 98295; load averages: 0.33, 0.17, 0.07 up 0+00:01:50 11:24:26
310 threads: 5 running, 278 sleeping, 27 waiting
CPU 0: 7.9% user, 0.1% nice, 0.0% system, 47.3% interrupt, 44.7% idle
CPU 1: 9.2% user, 0.0% nice, 0.0% system, 37.3% interrupt, 53.5% idle
CPU 2: 8.0% user, 0.0% nice, 0.0% system, 44.1% interrupt, 47.9% idle
CPU 3: 10.4% user, 0.0% nice, 0.0% system, 38.5% interrupt, 51.1% idle
Mem: 114M Active, 84M Inact, 236M Wired, 3478M Free
ARC: 109M Total, 20M MFU, 85M MRU, 158K Anon, 593K Header, 3260K Other
86M Compressed, 190M Uncompressed, 2.22:1 Ratio
Swap: 1024M Total, 1024M FreePID USERNAME PRI NICE SIZE RES STATE C TIME WCPU COMMAND
11 root 187 ki31 0B 64K CPU1 1 1:48 100.00% [idle{idle: cpu1}]
11 root 187 ki31 0B 64K CPU0 0 1:49 98.97% [idle{idle: cpu0}]
11 root 187 ki31 0B 64K RUN 3 1:45 98.97% [idle{idle: cpu3}]
11 root 187 ki31 0B 64K CPU2 2 1:36 98.97% [idle{idle: cpu2}]
0 root -16 - 0B 1536K swapin 3 0:44 0.00% [kernel{swapper}] -
@DrydenK-0 said in High CPU usage after upgrading to 2.7.1 Community Edition:
it may be something related to virtualization in Citrix-Xen.
Yes that seems likely. Do you see this on a clean install of a new VM with something close to the default config?
-
VERY default. As I said, i went to the console with pfSense still in the initial setup page, so no setting made at all.
-
 S stephenw10 moved this topic from General pfSense Questions on
-
We can also confirm that we are observing the same behavior after the upgrade to 2.7.1.
Running XenServer as well (8.2.1)
top -HaSPb
last pid: 23570; load averages: 0.24, 0.25, 0.17 up 0+13:10:50 00:03:38
239 threads: 5 running, 187 sleeping, 47 waiting
CPU 0: 0.1% user, 0.1% nice, 0.0% system, 17.9% interrupt, 81.9% idle
CPU 1: 0.1% user, 0.1% nice, 0.0% system, 12.6% interrupt, 87.3% idle
CPU 2: 0.1% user, 0.1% nice, 0.0% system, 13.3% interrupt, 86.5% idle
CPU 3: 0.1% user, 0.1% nice, 0.0% system, 13.4% interrupt, 86.4% idle
Mem: 94M Active, 220M Inact, 315M Wired, 124M Buf, 5284M Free
Swap: 1024M Total, 1024M FreeWe can confirm that the interrupts are not showing up on the host server. The high interrupt is only reflected in the VM.
-
But you do see CPU usage like OP shows in the first post?
-
What do you see causing the interrupt load in
vmstat -i? -
]/root: vmstat -i interrupt total rate irq1: atkbd0 2 0 irq15: ata1 111765 1 irq23: uhci0 16 0 cpu0:xen 10385530 61 cpu1:xen 8100717 48 cpu2:xen 7320906 43 cpu3:xen 7430090 44 irq2096: cpu0:r 1031 0 irq2097: cpu0:itlb 236290 1 irq2098: cpu0:b 4252302 25 irq2102: cpu1:r 1309 0 irq2103: cpu1:itlb 235826 1 irq2104: cpu1:b 4563379 27 irq2108: cpu2:r 373 0 irq2109: cpu2:itlb 234740 1 irq2110: cpu2:b 4808132 28 irq2114: cpu3:r 224 0 irq2115: cpu3:itlb 235961 1 irq2116: cpu3:b 4736445 28 irq2120: xen_et0:c0 2678328 16 irq2121: xen_et0:c1 1831505 11 irq2122: xen_et0:c2 1881594 11 irq2123: xen_et0:c3 1869526 11 irq2124: xenstore0 824 0 irq2129: xbd0 2762175 16 irq2130: xn0 507745 3 irq2131: xn0 609115 4 irq2132: xn0 418078 2 irq2133: xn0 1492607 9 Total 66706535 392 -
Hmm, nothing that would normally worry me....
