Pfsense dropping my connection to 30mg
-
Hi,
I've been using Pfsense for a while now. And yesterday out of nothing I've noticed my speeds were 30mg download (upload no issues) instead of 260mb.
I can't figure out what is going on, but once I've logged in in pfsense i see: "pfSense has detected a crash report or programming bug. Click here for more information."
Can anyone help me review the report to find out the issues?
-
@jonidesousa Network loop? What is 10.6.0.5?
<6>arp: 10.6.0.5 moved from c8:9e:43:9c:cd:35 to 02:b9:80:93:fb:b2 on bce0
<6>arp: 10.6.0.5 moved from 02:b9:80:93:fb:b2 to c8:9e:43:9c:cd:35 on bce0
<6>arp: 10.6.0.5 moved from c8:9e:43:9c:cd:35 to 02:b9:80:93:fb:b2 on bce0
<6>arp: 10.6.0.5 moved from 02:b9:80:93:fb:b2 to c8:9e:43:9c:cd:35 on bce0
<6>arp: 10.6.0.5 moved from c8:9e:43:9c:cd:35 to 02:b9:80:93:fb:b2 on bce0
<6>arp: 10.6.0.5 moved from 02:b9:80:93:fb:b2 to c8:9e:43:9c:cd:35 on bce0
<6>arp: 10.6.0.5 moved from c8:9e:43:9c:cd:35 to 02:b9:80:93:fb:b2 on bce0
<6>arp: 10.6.0.5 moved from 02:b9:80:93:fb:b2 to c8:9e:43:9c:cd:35 on bce0
<6>arp: 10.6.0.5 moved from c8:9e:43:9c:cd:35 to 02:b9:80:93:fb:b2 on bce0
<6>arp: 10.6.0.5 moved from 02:b9:80:93:fb:b2 to c8:9e:43:9c:cd:35 on bce0
Usually throughput is something like a bad cable, forgotten limiter in pfSense, bad network hardware, half duplex port, etc.
Is the kernel panic crash repeating, or just once?
-
Did that panic happen at the same time the download was throttled?
Dumptime: 2024-01-11 20:29:48 +0000Backtrace:
db:0:kdb.enter.default>  bt
Tracing pid 12 tid 100051 td 0xfffffe00104a0020
kdb_enter() at kdb_enter+0x32/frame 0xfffffe0081bc9b90
vpanic() at vpanic+0x183/frame 0xfffffe0081bc9be0
panic() at panic+0x43/frame 0xfffffe0081bc9c40
trap_fatal() at trap_fatal+0x409/frame 0xfffffe0081bc9ca0
trap_pfault() at trap_pfault+0x4f/frame 0xfffffe0081bc9d00
calltrap() at calltrap+0x8/frame 0xfffffe0081bc9d00
--- trap 0xc, rip = 0xffffffff805ebad9, rsp = 0xfffffe0081bc9dd0, rbp = 0xfffffe0081bc9e60 ---
bce_intr() at bce_intr+0x479/frame 0xfffffe0081bc9e60
ithread_loop() at ithread_loop+0x257/frame 0xfffffe0081bc9ef0
fork_exit() at fork_exit+0x7d/frame 0xfffffe0081bc9f30
fork_trampoline() at fork_trampoline+0xe/frame 0xfffffe0081bc9f30
--- trap 0, rip = 0, rsp = 0, rbp = 0 ---
Panic:
Waiting (max 60 seconds) for system process `vnlru' to stop... done
Waiting (max 60 seconds) for system process `syncer' to stop...
Syncing disks, vnodes remaining... 5 2 0 done
All buffers synced.
Uptime: 35d7h53m41s
Khelp module "ertt" can't unload until its refcount drops from 79 to 0.
uhub4: detached
uhub2: detached
uhub3: detached
uhub0: detached
uhub1: detached


Fatal trap 12: page fault while in kernel mode
cpuid = 1; apic id = 01
fault virtual address	= 0x10
fault code		= supervisor read data, page not present
instruction pointer	= 0x20:0xffffffff805ebad9
stack pointer	        = 0x0:0xfffffe0081bc9dd0
frame pointer	        = 0x0:0xfffffe0081bc9e60
code segment		= base 0x0, limit 0xfffff, type 0x1b
			= DPL 0, pres 1, long 1, def32 0, gran 1
processor eflags	= interrupt enabled, resume, IOPL = 0
current process		= 12 (irq58: bce1)
rdi: fffff80005af0800 rsi: fffff80005a9e600 rdx:                2
rcx:               c4  r8:              784  r9: fffffe0081bca000
rax:                0 rbx:                0 rbp: fffffe0081bc9e60
r10:                0 r11:         35e71743 r12:                0
r13:              303 r14:               c4 r15: fffffe0081d38000
trap number		= 12
panic: page fault
cpuid = 1
time = 1705004988
KDB: enter: panic
It looks like it panicked at reboot/shutdown so that seems unlikely to the cause of the slowness.
Consider just not logging those arp movements of that's expected. They are just spamming the logs masking anything alse that might be there.
https://docs.netgate.com/pfsense/en/latest/troubleshooting/logs-arp-moved.htmlSteve
-
Thanks for getting back to me.
So 10.6.0.5 was a managed switch. And when I saw that i thought it could be it. so I've replaced it and still the same speed.
Wondering if it could be the ethernet port :/
This only happened once. but not getting the correct speeds.
-
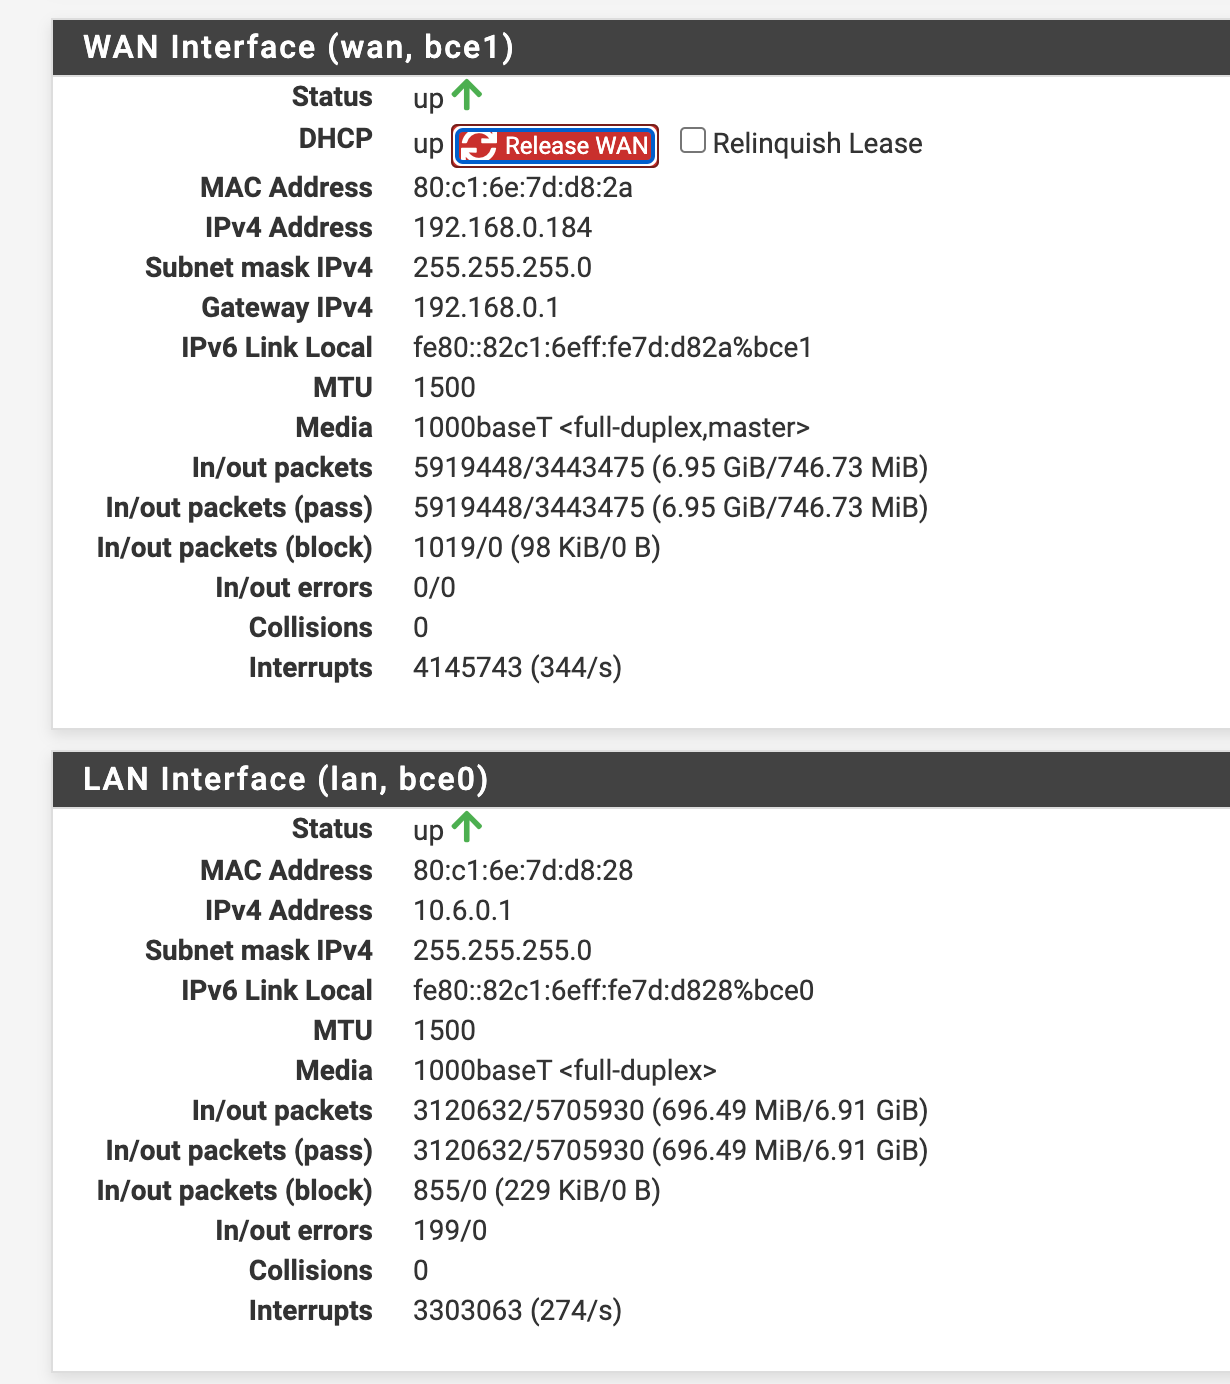
Check Status > Interfaces for the link speeds and errors on the interfaces.
-
all seems fine

-
Some input errors on the LAN NIC but not a significant number.
If you bypass pfSense can you still get the expected rate from the ISP? It could be some upstream problem.
-
Yes. If no pfsense I get the correct speeds..
I'm still trying to find out what 10.6.0.5 is now since I don't have the managed switch connected anymore.
-
Hmm, well if you have some IP conflict that could be a factor.
c8:9e:43:9c:cd:35is a Netgear MAC -
Still trying to figure this out.
That mac address was in fact the managed switch. and once I've turned it off something else got the 10.6.0.5 IP. but I'm still trying to find what it is.
either way now I should have the normal speed right? but no :/
testing speed from my PFsense I get the full speed. could it be the LAN that is faulty?
Retrieving speedtest.net configuration...
Testing from .....
Retrieving speedtest.net server list...
Selecting best server based on ping...
Hosted by 31173 Services ..... [110.73 km]: 36.775 ms
Testing download speed................................................................................
Download: 238.14 Mbit/s
Testing upload speed......................................................................................................
Upload: 19.41 Mbit/s -
Yup, good test. If pfSense itself gets full speed it must be something on the LAN side.
Can you try a client connected directly to pfSense, no switch?
Can you try assigning LAN as a different NIC?
-
I need to try and connect one device directly to pfsense.
but I tried to reassign the interfaces and got this:
WAN -> bce1
LAN -> bce0
OPT1 -> re0
OPT2 -> tun_wg0Do you want to proceed [y|n]? y
Writing configuration...
Fatal error: Uncaught TypeError: fwrite(): Argument #1 ($stream) must be of type resource, bool given in /etc/inc/config.lib.inc:1056
Stack trace:
#0 /etc/inc/config.lib.inc(1056): fwrite(false, 'a:31:{i:1705182...')
#1 /etc/inc/config.lib.inc(660): backup_config()
#2 /etc/inc/config.console.inc(380): write_config('Console assignm...')
#3 /etc/rc.initial.setports(40): set_networking_interfaces_ports()
#4 {main}
thrown in /etc/inc/config.lib.inc on line 1056
PHP ERROR: Type: 1, File: /etc/inc/config.lib.inc, Line: 1056, Message: Uncaught TypeError: fwrite(): Argument #1 ($stream) must be of type resource, bool given in /etc/inc/config.lib.inc:1056
Stack trace:
#0 /etc/inc/config.lib.inc(1056): fwrite(false, 'a:31:{i:1705182...')
#1 /etc/inc/config.lib.inc(660): backup_config()
#2 /etc/inc/config.console.inc(380): write_config('Console assignm...')
#3 /etc/rc.initial.setports(40): set_networking_interfaces_ports()
#4 {main}
thrownpfSense - Serial: YLUE134425 - Netgate Device ID: 19b77b9ed692c9c7bffc -
Also in case you ask if I have space

-
ok so I guess that error was to do with user...
right now I've switched the nics around. for a moment I didn't had internet connection.
But now back to where we were, 30mg speed.
the only thing I forget to do was to test speed connected directly to pfsense which I will do.
-
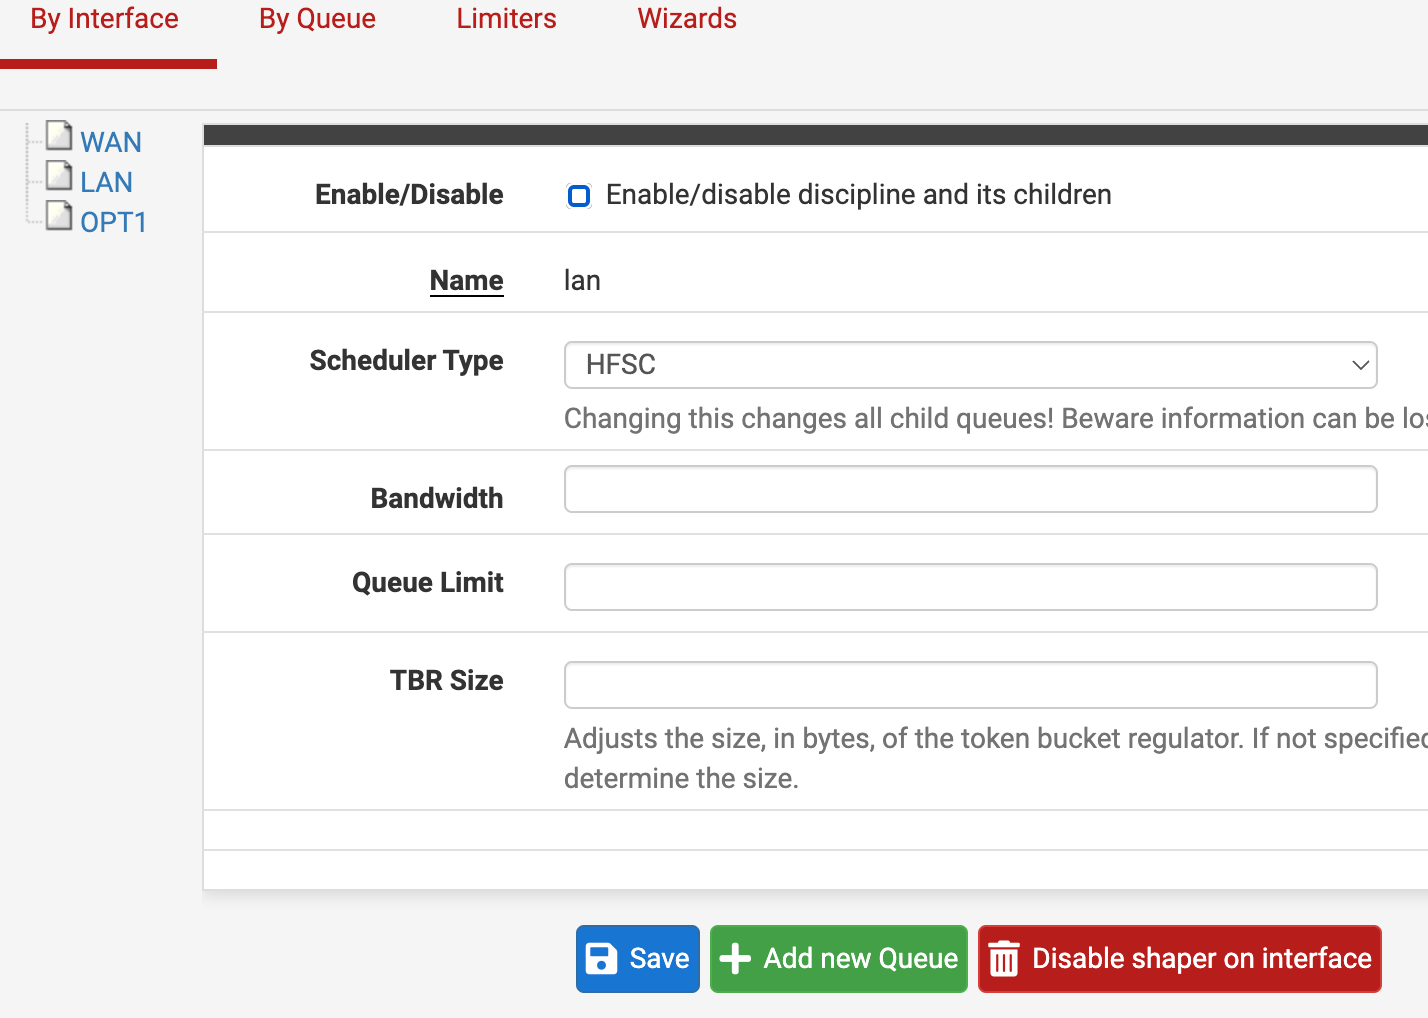
Do you, or have you ever, had any traffic shaping in that config?
Definitely worth checking since it seems to be part of the config following the interface change. Though it could be something downstream still.
-
Have never had and I don't think I have, unless I'm looking at the wrong thing.

-
No Limiters and no Queues?
-
no nothing :(
-
Tomorrow I will try connecting directly. but I've replaced the switch, it would be very unlucky if both were to be faulty :/
-
Just wanted to add, that I'm using AdguardHome in PFsense. it's not the best config but worked so far and it meant 1 less hardware to buy and all dns/firewall was in one device.
I've followed this article: https://broadband.forum/threads/installing-adguard-home-on-pfsense.205884/
But like I said it worked until now. so not sure how this could also be throttling the speed