pfBlockerNG Widget Counters
-
Clearing counters with the pfBlockerNG or pfBlockerNG-devel widget is still broken for DNSBL. I have mine set to reset daily and the IP lists clear perfectly, but the DNSBL will never completely clear and it skews the percentages. I have to clear it manually 2 or 3 times to get the numbers to actually reset to zero. it's been this way for years on every of pfSense instance I've deployed.
-
@DefenderLLC said in pfBlockerNG Widget Counters:
I have to clear it manually 2 or 3 times
I manually clear mine and it goes to zero every time. Although there is also immediately activity on DNSBL, so it doesn't stay zero very long.

Automatically I clear mine weekly, and that appears to be working as expected.
Just in the minute or so to type this:

edit: 24.03 pfB 3.2.0_10
-
@jrey Thank you for responding. In my case, the query count clears to 0, but the block count will reset to 0 and then will jump back to another value that would be impossible for the 1 or 2 seconds it takes to reset which skews the percentages. I have to do this manually 2 or 3 times to get the block count to actually reset and remain until the next DNSBL block entry.
This has been happening on my 6100 MAX for 2.5 years and the VM I was running before that - even after a fresh reinstall of pfBlockerNG w/o retaining my settings. I have seen others report the same thing. Perhaps it's a bug with the daily reset in particular. I'll see if I do a screen recording of it.
-
Sounds almost like a SQL caching issue.
Something along the lines of: request to zero is being processed (or has processed) and the read to refresh the dashboard is still pulling a cached value.
Are you updating the dashboard widget on the default 5 second interval?
// Clear DNSBL SQLite database statistics/queries as required
function pfBlockerNG_clearsqlite($mode, $totalqueries = 0) {
        global $g, $pfb;

        // Format of todo array: database, error message, SQLite command
        $todo = array();

        // Clear SQLite database 'queries' entry and update totalqueries (+queries), if Unbound Resolver PID changed (Reload)
        if ($mode == 'update_totalqueries') {
                $todo[] = array(3, 'Clear Resolver queries', 'UPDATE resolver SET totalqueries = :totalqueries, queries = 0 WHERE row = 0;');
        }
        elseif ($mode == 'clearip') {
                $lastipclear = date('M j H:i:s', time());
                $todo[] = array(6, 'Reset IP last clear timestamp', 'UPDATE lastclear SET lastipclear = :lastipclear WHERE row = 0;');
        }
        elseif ($mode == 'cleardnsbl') {
                $lastdnsblclear = date('M j H:i:s', time());
                $todo[] = array(1, 'Clear Widget counters', 'UPDATE dnsbl SET counter = 0;');
                $todo[] = array(3, 'Clear Resolver queries', 'UPDATE resolver SET totalqueries = 0, queries = 0;');
                $todo[] = array(6, 'Reset DNSBL last clear timestamp', 'UPDATE lastclear SET lastdnsblclear = :lastdnsblclear WHERE row = 0;');
        }

code ... continues
Manually the widget calls above as follows
        // Clear widget IP/DNSBL Packet Counts
        elseif ($_POST['pfblockerngclearall']) {
                pfBlockerNG_clearip();
                pfBlockerNG_clearsqlite('clearip');
                pfBlockerNG_clearsqlite('cleardnsbl');
                header("Location: /");
                exit(0);
        }

        // Clear widget IP Packet Counts
        elseif ($_POST['pfblockerngclearip']) {
                pfBlockerNG_clearip();
                pfBlockerNG_clearsqlite('clearip');
                header("Location: /");
                exit(0);
        }

        // Clear widget DNSBL Packet Counts
        elseif ($_POST['pfblockerngcleardnsbl']) {
                pfBlockerNG_clearsqlite('cleardnsbl');
                header("Location: /");
                exit(0);
        }
also curious - do you get different results if you manually clear just the DNSBL vs. ALL on the dialog ?
Have not been able to recreate your experience.
24.03 - pfB 3.2.0_10 - sqlite3 3.44.0 - py-sqlite3 3.11.7_8 all stock versions
-
@jrey Thanks again for the reply. Good suggestion that it might a caching issue. Aside from the daily reset interval, the widget still has its default settings. I have also noticed that if I clear DNSBL manually, I will have to clear it more than once if the block number is higher. It's really weird how it goes to 0, then it jump back to some 4 digit number 2 seconds later. I've learned to live with it, but it's just something I've noticed.
Again, it's only the DNSBL block count that does this which in turn effs up the percentage. The DNSBL query value and IP blocks reset just fine whether done via daily reset or manually.
To answer your last question, I mostly notice this when resetting ALL. I'll try resetting just the DNSBL when the block count gets high enough.
-
@DefenderLLC said in pfBlockerNG Widget Counters:
It's really weird how it goes to 0, then it jump back to some 4 digit number 2 seconds later. I've learned to live with it, but it's just something I've noticed.
maybe - as a test -- bump the widget refresh from default 5 to say 10 seconds and see if anything changes.
time to fire up my test box and see if I can break it

-
@jrey Sounds like we're on a mission! Note that the higher the DNSBL block count, the more likely it is that the reset block count number jumps from 0 to some random value within a few seconds. I'll grab a video clip when I get a chance. It's actually quite interesting to see the number fluctuate right in front of your eyes.
I wish the developer would add the ability to have it just display the past 24 hours like Pi-hole does. It makes more sense and you might able to notice a spike more easily if the numbers jumps significantly. I'm guess most people don't really reset to look at these stats, but I look at them all day long.
-

also hover over the two sections I've circled, both should display a "last cleared" time stamp --- and they should be the same ..
@DefenderLLC said in pfBlockerNG Widget Counters:
like we're on a mission
or it is a slow day and I'm bored

-
Okay here we go -- confirmation of the issue (I think) test box has 0 traffic (there are no users going though it.) But also likely not an issue.
created some basic DNSBL - fixed a DNSBL_Socials to block a few I could hit
Step 1 we are at zero

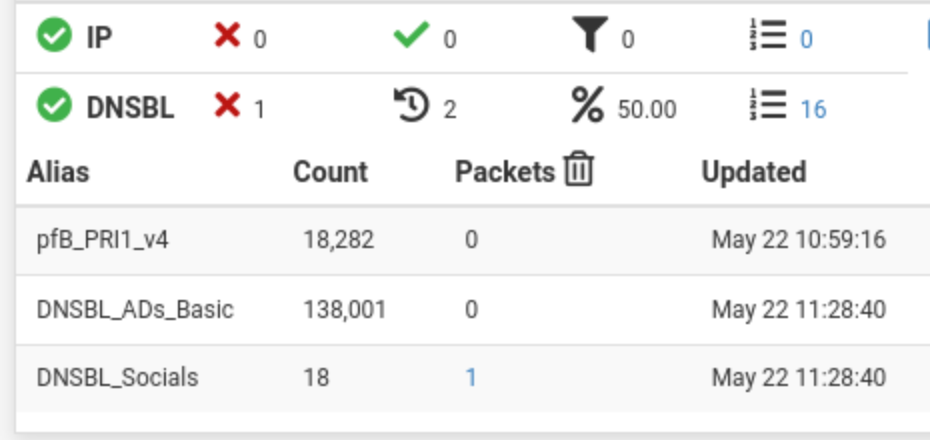
Step 2 - hit one name I know is in the DNSBL_Socials I just created

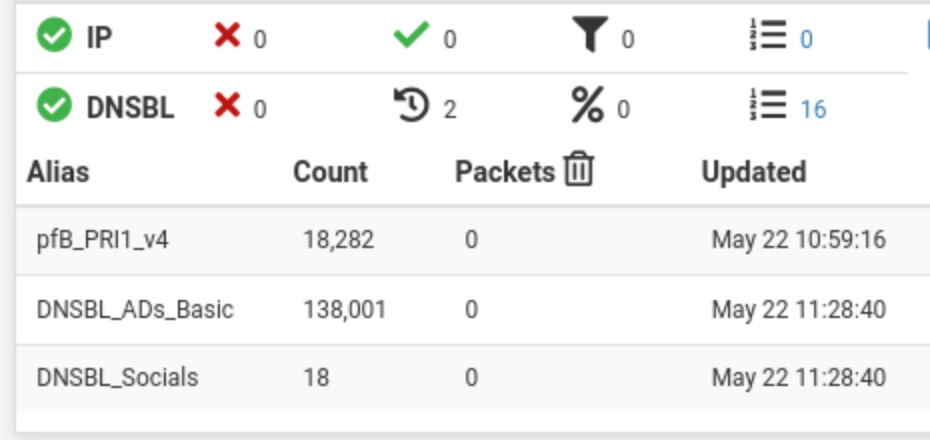
Step 3 - Clear DNSBL - notice is leaves the 2 resolver counts behind !! even after a refresh.

Step 4 - Clear DNSBL again - now they are zero again.

The issue seems related to the time stamp of the query used when looking at the resolver. Also on a very busy system, this number might be harder to trap at a zero as any resolver queries happening would be incrementing the count, even if they are not blocked. So in effect at a point in time they could be zero, but as I said earlier it won't last long.
While typing this message - the otherwise totally ideal system has already recorded 1 resolver hit from that shown in Step 4

Is the resolver hits counter resetting? I'd say - yes
Can it immediately have a value? - yes (based on timestamps and ongoing resolver queries)Likely also why my original observation was "immediately activity on DNSBL, so it doesn't stay zero very long" - could also be the resolver flushing the latest count.
Now the resolver count is up to 2 again, but no traffic blocked, and if I clear it immediately drops to zero.
I'm not convinced it is really broken - could be improved - likely / maybe.
Would have to look at the resolver's side of the update and how those values are tabulated.
Clear -> Resolver flushes count -> Dashboard refreshes shows 1000 hits (or in the case of this idle system 2) it is an illusion that it didn't actually go to zero.
Clear again -> no resolver update -> dashboard refreshes you might actually see the 0.
timing and volume of traffic.
-
@jrey Great summary. I have very aggressive blocklists, so I get a lot of blocks by the time midnight rolls around. If I happen to up, I can tell immediately if the reset is off due to the anomalies. If I reset it manually a few times, then everything is reported to the widget as it should.
I'm not overly worried about it, but yes - it could be improved. I'm guessing the 99% of people either (1) don't really look at the widget, (2) don't have the widget clearing counters, or (3) don't care. :)
Thanks again for really digging into this.
-
@DefenderLLC said in pfBlockerNG Widget Counters:
people either (1) don't really look at the widget, (2) don't have the widget clearing counters, or (3) don't care. :)
I like the widget.
I'm looking to it if there is nothing 'yellow' in there, which indicates I have to manually Force reload.
But your 1-2-3 are somewhat valid for me ^^ -
@jrey OK, so I was watching pfSense right at midnight and the IP and DNSBL query counters clear just fine. It's the DNSBL block count number that goes to 0 initially, then returns to a number that far exceeds the lookups for the 1 o 2 seconds it's takes to clear. So not exactly what you were seeing.
Oh well! Thanks for the all the effort you put in yesterday!
-
so the time stamps for "when cleared" are the same ?
does the packets blocked count on the list add up to the packets block on the summary ?
does the "far exceeds" number match (or close) to any one particular DNSBL list? (I'm assuming like me you have more than one DNSBL list (Alias))
Unbound python mode?
screen shots of the settings always help..
I changed mine from weekly to daily - no issue. everything still adds up earlier today when I checked, still adds up now.
-
@jrey said in pfBlockerNG Widget Counters:
so the time stamps for "when cleared" are the same ?
does the packets blocked count on the list add up to the packets block on the summary ?
does the "far exceeds" number match (or close) to any one particular DNSBL list? (I'm assuming like me you have more than one DNSBL list (Alias))
Unbound python mode?
screen shots of the settings always help..
I changed mine from weekly to daily - no issue. everything still adds up earlier today when I checked, still adds up now.
The DNSBL count will reset to 0 along with the DNSBL query count. What happens is that after a few seconds, the block count will jump to a large value, but not quite as high as the previous value. That's what skews the percentages. If I rinse and repeat this manually a few times, then it works as expected. Someone that only resets once per week may not notice this as much. Again, the higher the DNSBL block count, the more likely it is that this will happen.
Using Unbound vs Unbound Python mode does make any difference.
I will try and record it tonight. I'm not that worried about it at this point. It's been doing this same behavior to me on a VM and my Netgate 6100 MAX for almost 3 years.
-
You don't need to record it, I understand what you are seeing.
I also understand you're not worried about it. But clearly there is a problem and I'm offering to help try recreate the specific case causing it so that it might lead to a solution.
Using Unbound vs Unbound Python mode does make any difference.
"does not" or are you asking if it "does make" ?
FWIW - I'm running DNSBL in Unbound python mode.
Any settings you are willing to share about your DNSBL setup would be helpful.
-
@jrey What I meant was that I have used both modes at different times and the behavior is exactly the same with the widget. I am using Unbound Python mode now.
-
@jrey We can revisit this at a later date. pfBlockerNG still works. It's just the widget.
-
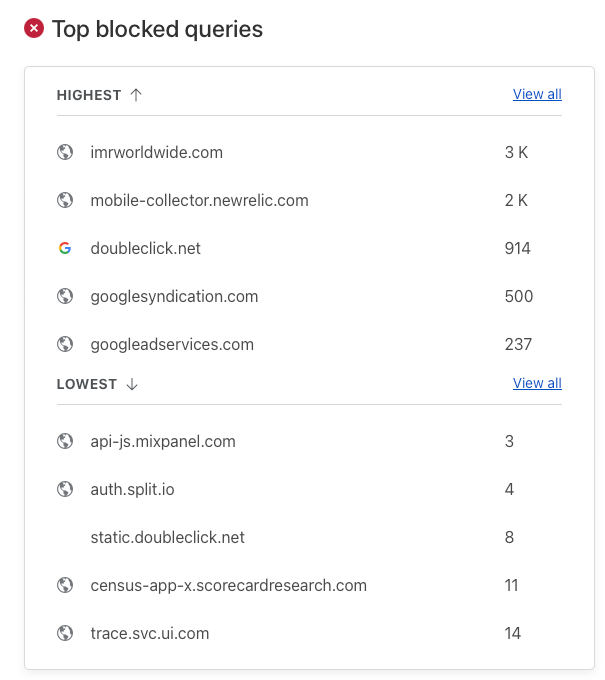
@jrey For the next few weeks, I am just going to be using pfBlockerNG for IP blocks and not DNSBL. I am testing out the similar functionally with Cloudflare Zero Trust. It adds the ability to inspect SSL traffic on devices where I've added the certificate.
Here's a very small example of blocks for the last hour with Cloudlfare Zero Trust:
