pfblocker - speed up search
-
@michmoor said in pfblocker - speed up search:
is because searching for problematic domains for end users can be slow
might need some more information -
how many users?
what mode are you running (unbound or unbound python) ?
are you TLD wildcard blocking ? HSTS mode? blocking mode? etc settings?
how big are your DSNBL lists?
(I have 5 individual "lists" with just over 168,000 items)
define "can be slow" -
is it not always slow and just can be from time to time?
what is slow? 1 sec, 5 sec, 10 sec
are you sure the "searching" is the bottleneck?this seems like a
normaltypical response time from a wireless device on the network behind a 2100 with about 50 active devices at any given time, sometimes fewer, sometimes more;; ANSWER SECTION: tiktok.com. 120 IN A 0.0.0.0 ;; Query time: 24 msec ;; SERVER: 192.168.0.1#53(192.168.0.1) ;; WHEN: Thu Sep 19 06:16:58 EDT 2024 ;; MSG SIZE rcvd: 55I can't say that this is "slow" or "fast" I can say it works and no one complains.
-
@michmoor
is it maybe a website which contains (as part of it) a blocked dns name? -
@michmoor said in pfblocker - speed up search:
using pfbocker for DNS sinkholing is because searching for problematic domains for end users can be slow
With 'searching' you mean :
It takes multiple tens of seconds for this page to show up :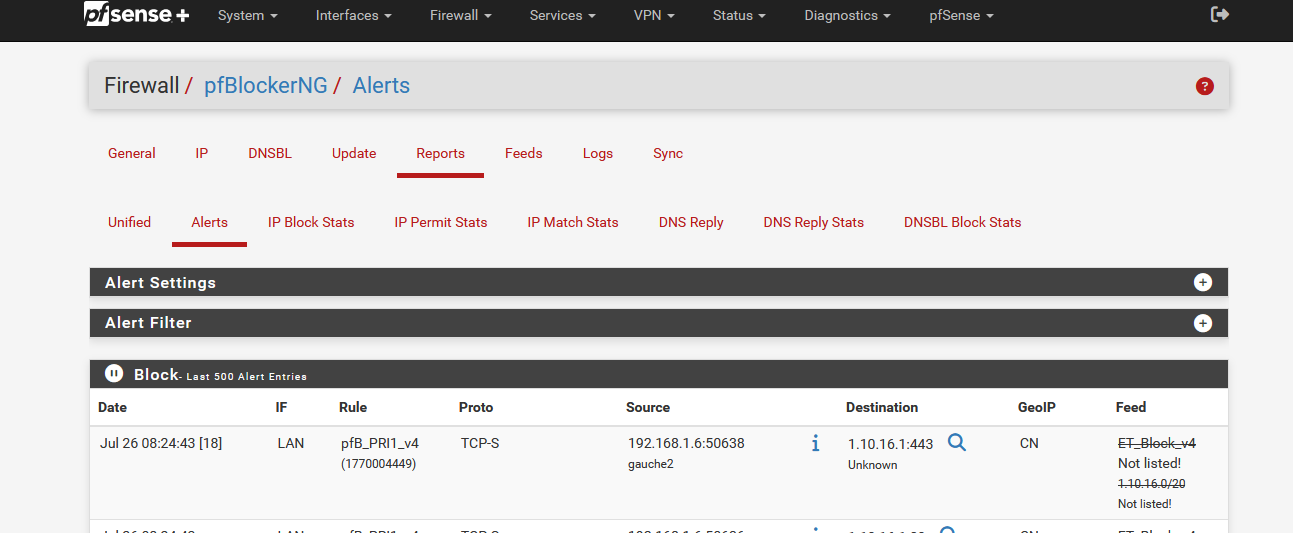
Sqlite3 : these are the files created and maintained by pfBlockerng :

You could even 'dump' them on the command line : there isn't much info stored into them. More like running totals etc.
Or do you man something else ?
I've managed to accelerate the Alerts page :
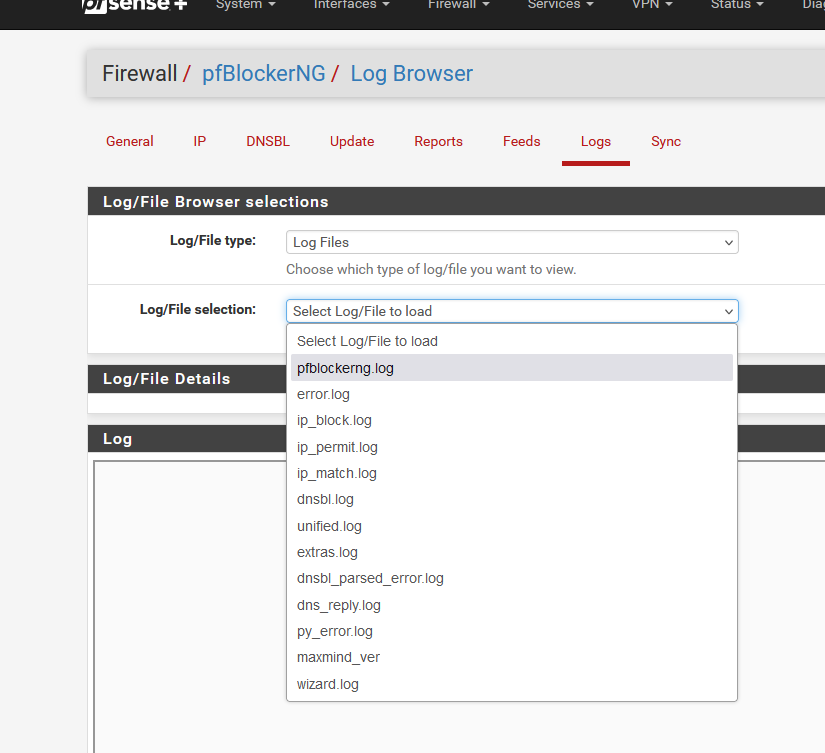
I emptied out the log files error.log just up until extras.log, and now Alerst shows up within a second.
-
@Gertjan said in pfblocker - speed up search:
With 'searching' you mean :
Yes. Thats exactly what i mean. I apologize if i wasn't clearer in my original post.
Searching under the Reporting tab just seems slow to me. I have about 40 clients right now using pfsense for DNS. If there is an issue of a potentially blocked site, i have to search for the IP and see all the sites it got blocked by. This is a time consuming process of finding the site , whitelist the site , reload , try to access the site again and hope it works.
I cant do anything about the Reload piece but the searching just adds what feels to me, more time than i think is needed to find all block sites for a client hence i was asking if there was anything i could do to speed up the search.edit:
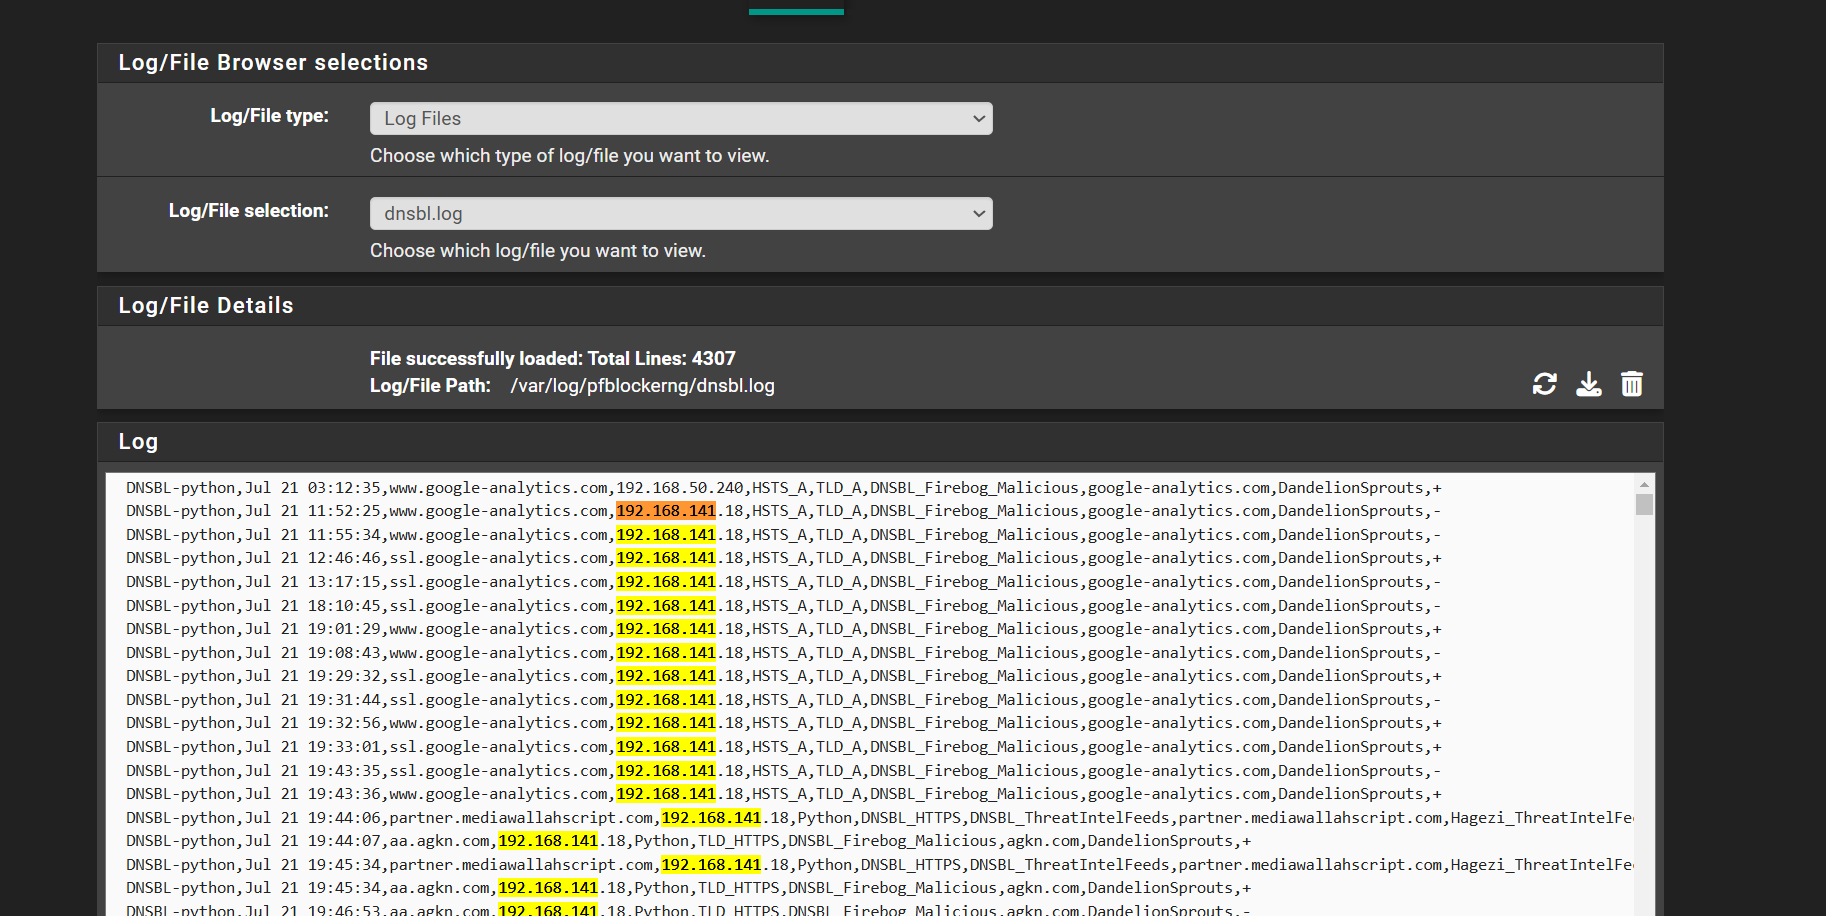
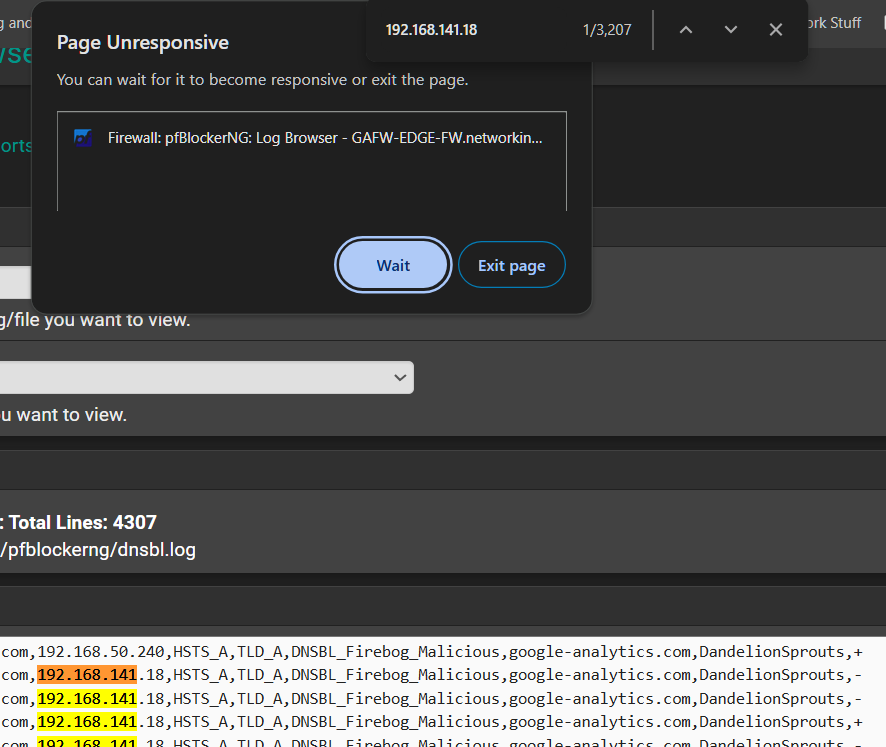
Even searching the log files within the GUI takes such a long time to the point my browser tab crashes. In this example i am trying to find all instances of '192.168.141.18'. After a few seconds this page would crash.
-
@Gertjan said in pfblocker - speed up search:
I emptied out the log files error.log just up until extras.log, and now Alerst shows up within a second.
what do you mean you emptied out? How? Sorry I'm not following
-
@michmoor said in pfblocker - speed up search:
what do you mean you emptied out?
You see this :
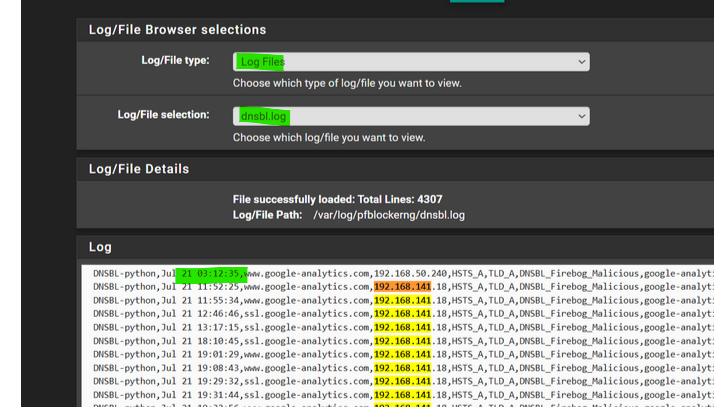
Go have a look here :
/var/unbound/var/log/pfblockerng/
and you'll find the dnsbl.log file.
Since it has DNS info from last 21 July, it must be huge.
You have a choice :
- You want nice charts with lots of detailed info - and a pfSense (pfblockerng) that makes your system scrawl, or
- Want a fast GUI (pfblockerng).
If you pick option 2, go for this one :
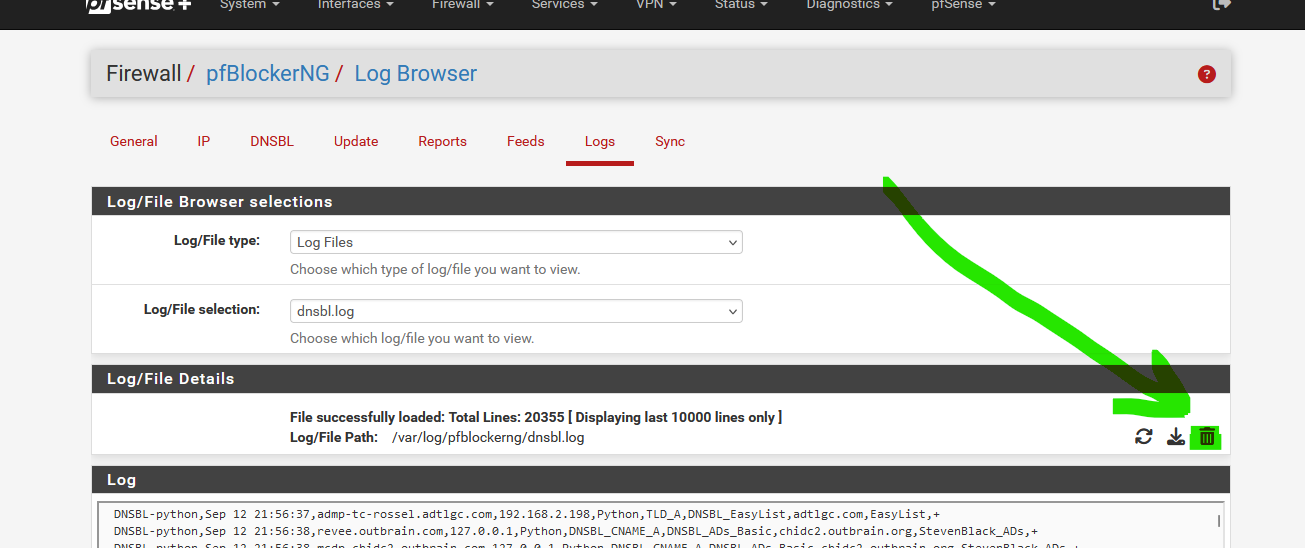
-
@Gertjan said in pfblocker - speed up search:
Since it has DNS info from last 21 July, it must be huge.
@michmoor
it only has 4307 lines in -- the default retention is to trim the file to 20,000 lines when cron runs the various jobs.if that is a current screen capture with only ~4000 lines, and the retention levels are the default, but records date back to Jul 21 -- something else is going on.
the Page unresponsive, message -- look more like you are seeing that trying to navigate to the pfblocker logs page ? or more likely searching for the ip 192.168.141.18 using a browser search (that is what appears to be under the message and 1/3207 (found)) - something else is going on - the screen capture does not tell the whole story.
regardless of how many lines are "in the file" the alerts (and most of the reports) have limits as to how many lines they process and display -- (look in the Alerts Settings at the top of Alerts report for example) -- something else is going on.
I don't think you stated which version of pfsense or pfb you are running only that you are on a 6100.
-
a 4100 with the big SSD (the max version), 24.03, pfBlockerNG-devel - 3.2.0_10.
@jrey said in pfblocker - speed up search:
it only has 4307 lines in
and that dnsbl.log file contains info from last 21/07/2024 or 2 months of logs ? imho, that's not a lot.
Right now, mine :
[24.03-RELEASE][root@pfSense.bhf.tld]/root: wc -l /var/unbound/var/log/pfblockerng/dnsbl.log
   20610 /var/unbound/var/log/pfblockerng/dnsbl.log
and searching for '127.0.0.1' is still pretty fast ( like one second or so ) :
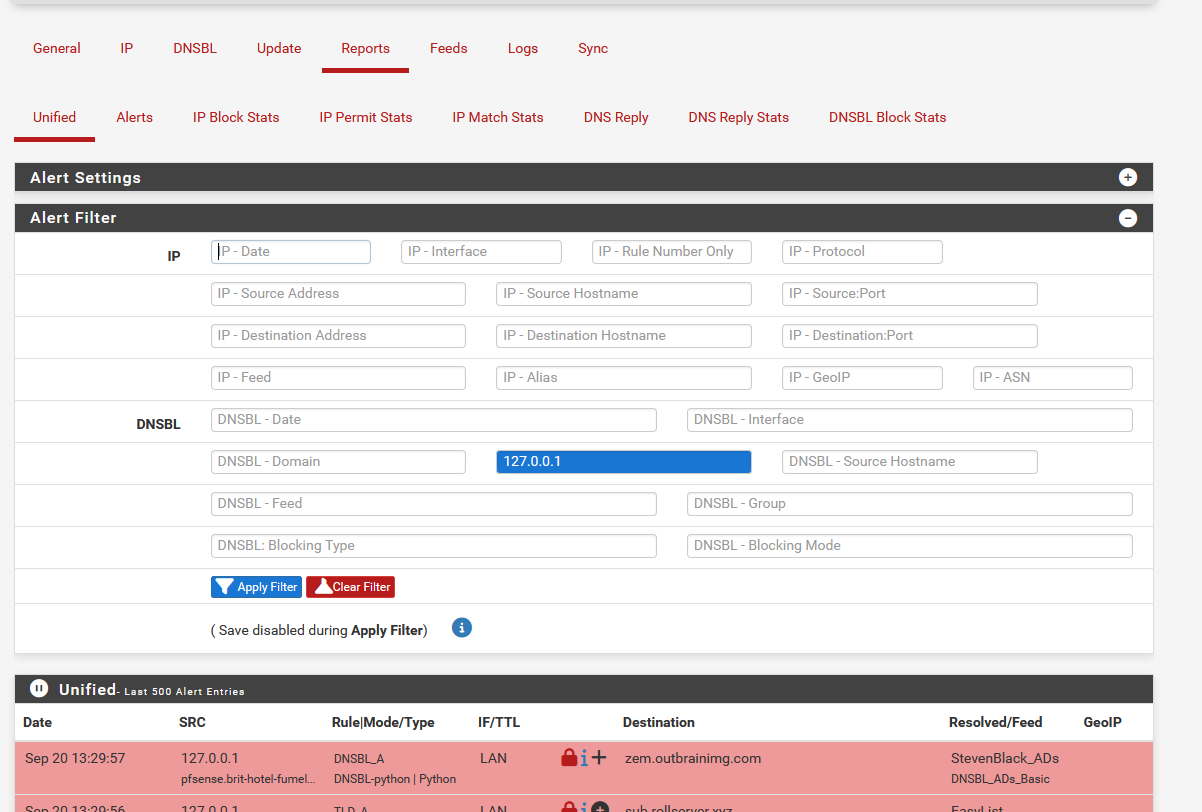
This was not the case yesterday. The same search took 30+ seconds ....
I start to doubt now why 'fast' today and slow yesterday. -
@Gertjan said in pfblocker - speed up search:
Since it has DNS info from last 21 July, it must be huge.
@Gertjan said in pfblocker - speed up search:
and that dnsbl.log file contains info from last 21/07/2024 or 2 months of logs ? imho, that's not a lot.
seems like you've had a change of heart

The screen capture the OP showed is what appears to be a browser search (since the under lying screen is the log page and the results are the raw file data) - this is not any of the "reports" - so a timeout here suggests "something else is going on and we don't have all the information )
doesn't matter what you or I are running really, the OP said
@michmoor said in pfblocker - speed up search:
For context i am running a SG-6100 on an SSD.
@Gertjan said in pfblocker - speed up search:
It takes multiple tens of seconds for this page to show up :
no is doesn't, and I'm on a 2100 (disclaimer: not that it matters, I don't use these reports at all - because everything is available to me in realtime over on a Graylog server) The doesn't however mean I can't go in a run a report on gate "multiple tens of seconds" - no multiple tens observed here
Never the less - the OP has "something else going on" and we need more information.
we might want to start with why the file is
a) so small
b) data in it so old
c) how is the response time to the selected DNS -- does the OP redirect DNS traffic (rules) - many of the reports do additional DNS running in realtime. what are the settings here? etc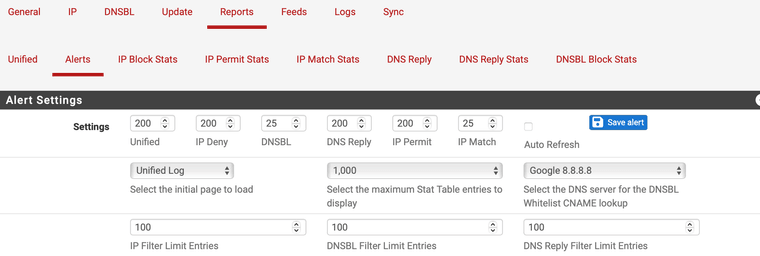
trying to report on something that is potentially no longer in a current "file" "list" could potentially have a significant impact on "some" of the reports that are attempting to "look things up". (not related to DNS, but also yes related to DNS)
@Gertjan The sample screen you provided:

"Not listed" says that on July 26 (per the raw data, this block was in ET_Block_v4 but now at report time it is "not listed" --- these things take time to "look up"
an overlapping entry, might look like this: (that is the IP is (or could be blocked by either) - had to "look that up" because on one of those entries is in the raw data.
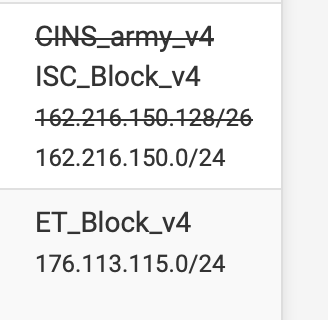
- a not listed could also be that then (jul 26 in your sample) it was, but now if that is a "current" report, nothing would block it. - still had to "look it up"
The reports are limited to how much they "look at" when running.
Just my opinion but OP has "something else going on."
I'd be really curios to know - if the OP's file is even growing (line count)-
how are you blocking ? where are you actually logging ? are you logging? -
@Gertjan said in pfblocker - speed up search:
This was not the case yesterday. The same search took 30+ seconds ....
I start to doubt now why 'fast' today and slow yesterday.Easy - you deleted data.
But this is not the correct thing to do. 20000 records is not the issue.
You would be far better to adjust your search parameters to reasonable values.
consider the "Alerts Settings" section I posted above. This limits how many records are returned for each section of the report.
You have 6 setting with 3 reports. (The items on the menu just above without the word Stats so
unified - unified
Alerts - IP Deny (block), DNSBL, IP Permit and IP Match
DNS ReplyThese relate direct to the 6 files. you have to process potenitally 4 times as many results to view the report. Likely not needed. depending on what you are "searching" for -- if you are looking for a given IP on the alerts tab (returning 500 results (or 200) or whatever you have in the setting takes more time.
Consider this: which of the 4 files do you want to search. say it is block (so IP Deny) - why would you care about searching DNSBL, IP Permit and IP Match. (you most likely don't) so why would you. Settings like this would return the most recent 50 records of the searched item.

if this is set at 200 you want 200 results (max), 500 you want 500 results and so on.
Now on a larger file with a specific search items - large result counts mean more records to process up to your maximum. Depending on what you are searching for in 20000 records you might actually satisfy the request for 500 records but it had to process all records in the file to do that.
with a lower return count, it won't take nearly as long. because it will stop when it hits max. Try 50 (don't see what you want in 50 go a little bigger, don't see 50 go a little smaller)
Now when you delete the data, of course it is faster, there is less data to search, but what do you think it will find ? less answers -- so a large return value makes no sense here either
you are better to "tune" the report for each specific case you are looking for.
So for example, say you think it is DNSBL (per that OPs original post) that is what I think it is, so don't delete the data. set IP Deny to 0, DNSBL to 50, IP Permit to 0 and IP Match to 0.So the defaults are 200 and it takes a long time to load the report even without search. Lower the default of each to 25 there is a save button to the right of each of the three ) Save Alerts. those values are now your defaults. the report should load without a search parameter considerably faster by default,
Now set your return record limits according to the table you want to search
0, 50, 0, 0
50, 0, 0, 0If you think you'll find your answer in the most recent 25 records that match, pick that.
you will find that if you don't have enough data to satisfy the record count, with will only return up to what it finds or has.Same applies to Unified and DNS Reply reports -- limit the number of results for a search that you need to see and your results will take far less time to process. Plus with the added bonus of still having data to search.
If you are set for 500 records and you delete the data of course it will return faster, but are you returning 500 records (especially if you search) the answer is not likely. but as the file gets bigger, it starts to get slower and slower.
All of the reports have extra overhead do more than just this as I've mentioned above
Only ask for what you need for Diagnostic, only take what you need for speed.
If you want more long term reporting for analysis - this is not the place for it. These reports are trouble shooting in the moment tools.
-
@jrey said in pfblocker - speed up search:
I cant speak for @Gertjan but this actually solves my issue or at least gives me a better way of optimizing my ability to search in pfblocker. I appreciate this @jrey
edit: I had to reread @jrey post a few times to make sure i understand it and i do. The report section alert settings i have overlooked completely since...forever. Tuning this to match what i am looking for in my report is clear. If I'm searching for DNS Blocks I'm better off tuning the Unified/IP logs to Zero and DNSBL to 500 (or whatever value) to ensure i get the findings i want.
-
@michmoor said in pfblocker - speed up search:
I cant speak for @Gertjan but
just looking at the various screen captures provided the return expectation of @Gertjan is at least 500 results. That means on whatever search you are doing please return the most recent 500 that match. For alerts in particular if all (4) sections of the report have the same return value limit and you are searching you are telling each section to return 500 results. Could generate a lot of reading and then looking up related "stuff" to do that on top.
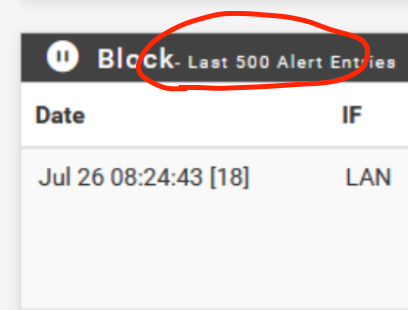
if you are looking for DNSBL set that field to 50 to start, set the other 3 to 0

for the alerts report Unified setting and DNS Reply setting will have no impact
this is how the 6 return value settings line up to the 3 reports.
Sorry the IP Permit and IP Match both go to Alerts, made the green lines too wide and the overlapped. Honest there are 4 green lines there...
