Puzzling CPU Usage
-
I am trying to find out why my CPU usage has more than doubled since initiating PFB Unbound Python mode and the removal of feeds/lists that made no beneficial impact.
Prior to this my cpu usage was in the neighborhood of 10 and 15%, at times even lower.
The following is a screen shot of system activity (showing everything that was using cpu at that time) and cpu usage as displayed in the dashboard.

PFB Unbound Python Mode was supposed to be lean on resources and the removal of feeds/lists should have reduced system resources not increase them.
As I write this I see my cpu usage ranging between 15 and 43% staying at the upper level for most of the time.
What confuses me is not only why so high cpu usage but when looking at the system activity log and doing simple math I cant see where the 40% utilization is coming from.
Most of the cpu seems to be at idle with only fractions being utilized, certainly not enough to add up to 40%.
The following is the monitor graph and it shows "user util" seemingly spiking the cpu but not sure yet what the involves as I am only logged in and sitting at the dashboard while the cpu usage shows the high %.
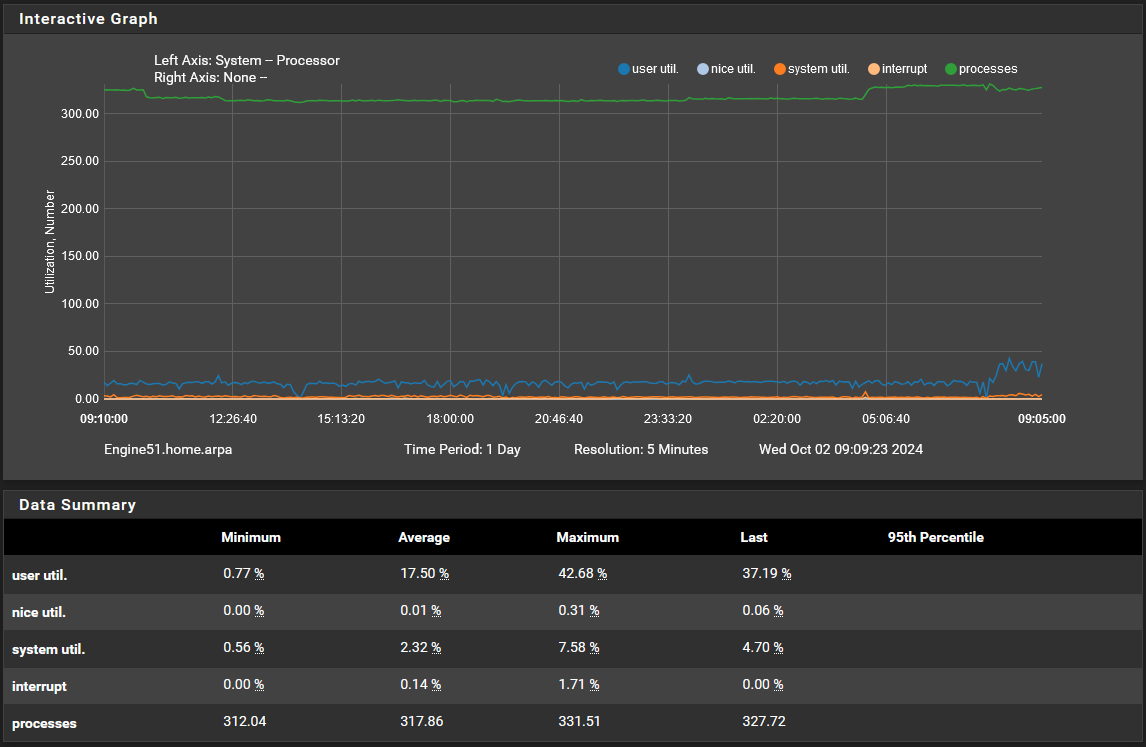
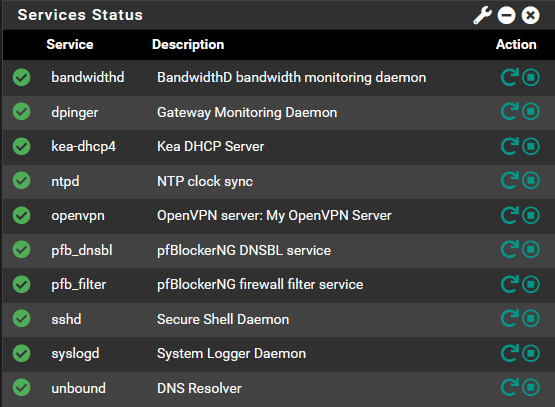
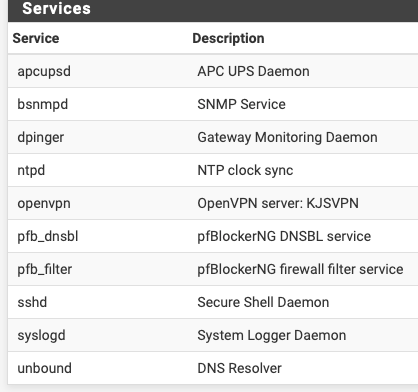
Even at early am hours user util is higher than one would think. I am not logged in and I do not have any special scripts, services or processes running, see services below.
I did a reboot thinking it was some remnant from my cleanup hanging around or other but that was not it.
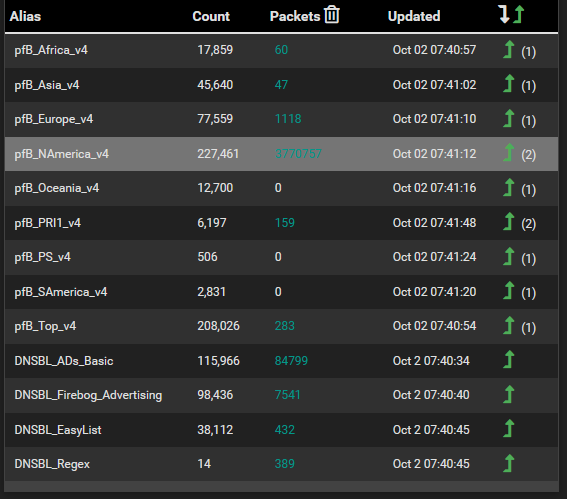
The following are the PFB feeds I have configured in case this info is useful.
Any suggestions.
Also...I connected to the box via ssh to see if I can get some additional info that may be causing this like cron jobs. I logged in as myself for which I am setup as an admin but I do not see anything listed even though a cron is scheduled for PFB every 4 or 8 hours I think. I recall reading something that users even though setup as admins can not see or do everything that the "admin account" can. I have the admin account disabled, can I do admin stuff with my account or do I have to enable the admin user to do higher level stuff?
Thanks.
-
Check the usage at the command line using:
top -HaSPYou're using the hardware from your signature?
-
@stephenw10 Hi Stephen. Yes the HW listed in my signature is my new box.
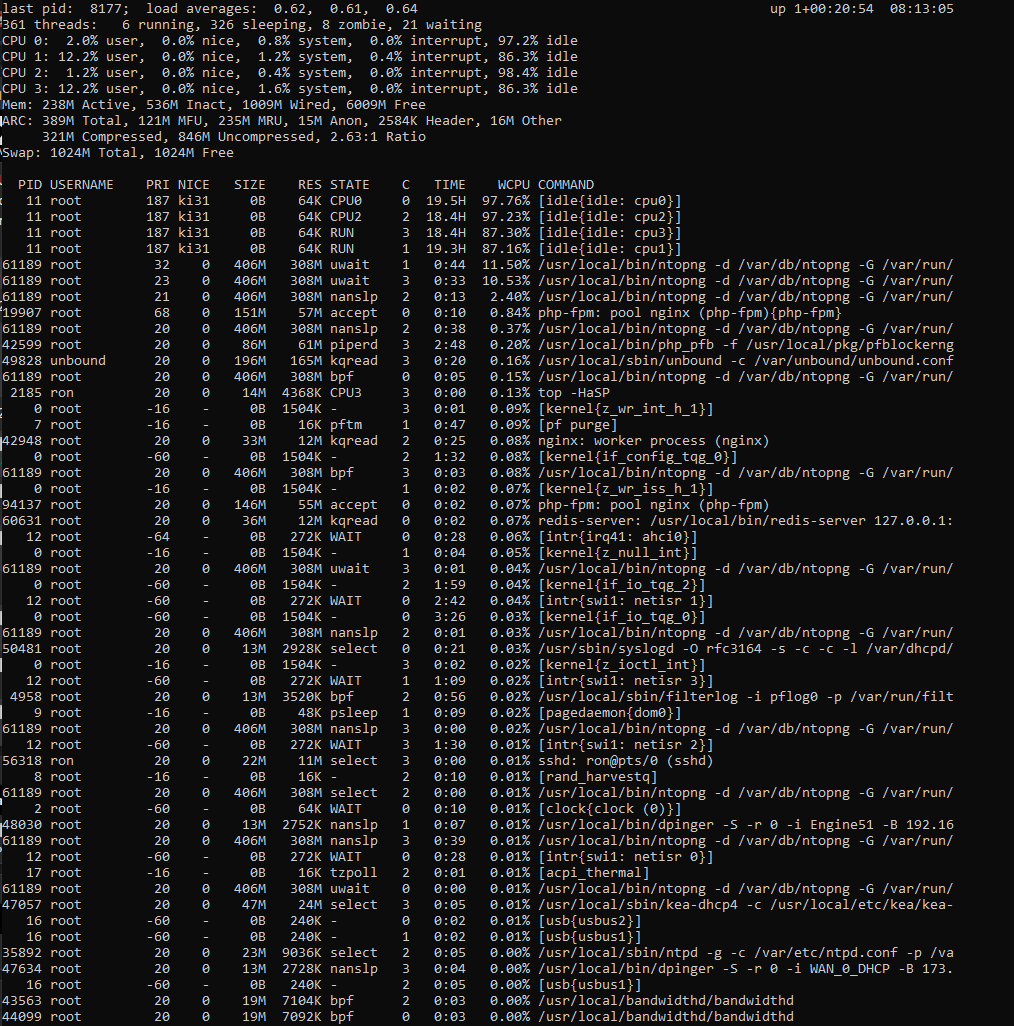
Here is the output form the command.
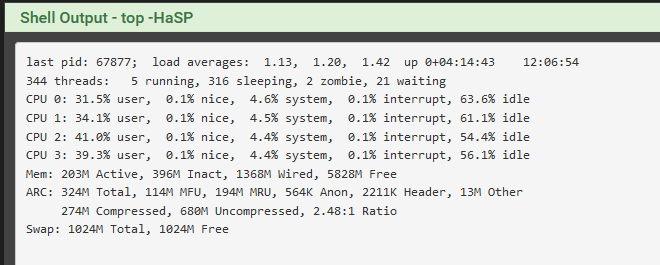
CPU usage was at this time in the dashboard.

I installed ntopng because I was seeing some unusually high wan activity when no one was using the internet and noticed that the cpu usage is lower than it has been. Not sure if coincidence but it is noteworthy.
PS..I am focused on the cpu usage bc my new box is a fanless mini pc and I obviously want to run as cool as possible. By default I always get curious when i see usage above historical norms as it may be a sign of something bigger.
-
ntopng will use significant CPU cycles itself.
You need to run that top command at the actual command line not via the gui command prompt. Hot
qto quit and leave it displayed so you can check the output or copy/paste it.
You should see something like:[24.03-RELEASE][admin@cedev-3.stevew.lan]/root: top -HaSP last pid: 84246; load averages: 0.09, 0.12, 0.09 up 8+00:58:09 17:22:25 171 threads: 3 running, 146 sleeping, 22 waiting CPU 0: 0.0% user, 0.0% nice, 0.0% system, 0.0% interrupt, 100% idle CPU 1: 0.0% user, 0.0% nice, 0.0% system, 0.0% interrupt, 100% idle Mem: 46M Active, 23M Inact, 83M Laundry, 312M Wired, 193M Buf, 1474M Free Swap: 512M Total, 110M Used, 402M Free, 21% Inuse PID USERNAME PRI NICE SIZE RES STATE C TIME WCPU COMMAND 11 root 187 ki31 0B 32K CPU0 0 191.4H 99.89% [idle{idle: cpu0}] 11 root 187 ki31 0B 32K RUN 1 191.5H 99.81% [idle{idle: cpu1}] 84246 root 21 0 14M 3720K CPU1 1 0:00 0.08% top -HaSP 0 root -64 - 0B 624K - 0 3:41 0.03% [kernel{dummynet}] 19 root 16 - 0B 16K syncer 0 1:03 0.03% [syncer] 12 root -64 - 0B 320K WAIT 1 2:35 0.02% [intr{irq26: virtio_pci1}] 71983 root 20 0 22M 11M select 0 0:00 0.01% sshd: admin@pts/0 (sshd) 7171 root 20 0 21M 2008K nanslp 1 1:07 0.01% /usr/local/bin/dpinger -S -r 0 -i WAN_DHCP -B 172.21.16.148 -p /var/run/dpinger_WAN_DHCP~172.21.16.148~172.21.16.1.pid -u /v 27848 root 20 0 13M 1648K select 0 0:01 0.01% /usr/local/sbin/dhcp6c -d -c /var/etc/dhcp6c.conf -p /var/run/dhcp6c.pid vtnet0 90960 root 20 0 13M 1748K kqread 1 0:08 0.01% /usr/bin/tail_pfb -n0 -F /var/log/filter.log 6 root -16 - 0B 16K pftm 1 1:23 0.01% [pf purge] 8 root -16 - 0B 48K psleep 1 0:38 0.01% [pagedaemon{dom0}] 91333 root 20 0 13M 1692K select 0 0:06 0.01% tail_pfb: system.fileargs (tail_pfb) 2 root -60 - 0B 32K WAIT 0 1:19 0.01% [clock{clock (0)}] 43364 dhcpd 20 0 27M 6744K select 1 0:05 0.00% /usr/local/sbin/dhcpd -user dhcpd -group _dhcp -chroot /var/dhcpd -cf /etc/dhcpd.conf -pf /var/run/dhcpd.pid vtnet1 12 root -60 - 0B 320K WAIT 0 0:53 0.00% [intr{swi1: netisr 0}] 12 root -60 - 0B 320K WAIT 1 0:21 0.00% [intr{swi1: netisr 1}] 7 root -16 - 0B 16K - 0 0:22 0.00% [rand_harvestq] 45769 root 20 0 23M 5952K select 1 0:04 0.00% /usr/local/sbin/ntpd -g -c /var/etc/ntpd.conf -p /var/run/ntpd.pid{ntpd} 63502 root 20 0 13M 1576K kqread 1 0:02 0.00% /usr/sbin/syslogd -s -c -c -l /var/dhcpd/var/run/log -P /var/run/syslog.pid -f /etc/syslog.conf 84210 root 20 0 20M 6800K kqread 1 0:02 0.00% /usr/local/sbin/lighttpd_pfb -f /var/unbound/pfb_dnsbl_lighty.conf 12 root -64 - 0B 320K WAIT 1 0:43 0.00% [intr{irq24: ahci0}] 413 root 20 0 107M 18M kqread 0 0:17 0.00% php-fpm: master process (/usr/local/lib/php-fpm.conf) (php-fpm) 12 root -64 - 0B 320K WAIT 0 0:17 0.00% [intr{irq29: virtio_pci2}] 7171 root 20 0 21M 2008K sbwait 0 0:13 0.00% /usr/local/bin/dpinger -S -r 0 -i WAN_DHCP -B 172.21.16.148 -p /var/run/dpinger_WAN_DHCP~172.21.16.148~172.21.16.1.pid -u /v 7171 root 20 0 21M 2008K nanslp 1 0:11 0.00% /usr/local/bin/dpinger -S -r 0 -i WAN_DHCP -B 172.21.16.148 -p /var/run/dpinger_WAN_DHCP~172.21.16.148~172.21.16.1.pid -u /v 98754 root 20 0 13M 2028K bpf 1 0:12 0.00% /usr/local/sbin/filterlog -i pflog0 -p /var/run/filterlog.pid 17 root 20 - 0B 48K sdflus 0 0:09 0.00% [bufdaemon{/ worker}] 4 root -16 - 0B 48K - 0 0:18 0.00% [cam{doneq0}] 17 root -16 - 0B 48K psleep 0 0:02 0.00% [bufdaemon{bufdaemon}] 17 root 20 - 0B 48K - 0 0:02 0.00% [bufdaemon{bufspacedaemon-0}] 8 root -16 - 0B 48K umarcl 0 0:02 0.00% [pagedaemon{uma}] 18 root -16 - 0B 16K vlruwt 0 0:02 0.00% [vnlru] 415 root 37 0 148M 22M accept 0 0:50 0.00% php-fpm: pool nginx (php-fpm){php-fpm} 39419 root 20 0 148M 22M accept 0 0:49 0.00% php-fpm: pool nginx (php-fpm){php-fpm} 414 root 32 0 148M 22M accept 1 0:48 0.00% php-fpm: pool nginx (php-fpm){php-fpm} 36254 root 68 20 13M 1732K wait 0 0:47 0.00% /bin/sh /var/db/rrd/updaterrd.sh 0 root -16 - 0B 624K vtbslp 1 0:30 0.00% [kernel{virtio_balloon}] 0 root -16 - 0B 624K swapin 0 0:14 0.00% [kernel{swapper}] 12 root -64 - 0B 320K WAIT 1 0:08 0.00% [intr{irq15: ata1}] 12 root -64 - 0B 320K WAIT 0 0:06 0.00% [intr{irq11: uhci0+}] 16 root -60 - 0B 80K - 1 0:05 0.00% [usb{usbus0}] 36423 root 20 0 13M 868K nanslp 0 0:03 0.00% /usr/sbin/cron -s -
I don't think there is anything here to be too concerned about.
Based on our discussion on your other thread, regarding all this lists you had not
"recording" anything - I would guess that the previous pfBlocker was working with messed up lists and/or rules.Now that that has been cleaned up so to speak, the DNSBL system is actually processing more of what it should properly. Will you see an increase in cpu? likely, just because it is working with valid data.
For comparison however, I run these on a Netgate 2100 (which is 2 core)
and my processor usage is this over the day
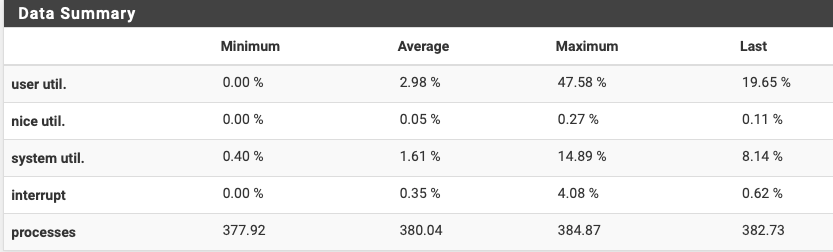
Keep in mind also that the top -HaSP will display the CPU usage more frequently. where as the dashboard is a snapshot every time the dashboard updates (so it is not as "fluid") and actually takes CPU to update the dashboard. If the dashboard where as fluid as the "top" command that little CPU bar would be jumping a lot more frequently. it's just a point in time guide.
your higher "user util" average over a day is the only number that really looks out of step at 17.50% --
the top output @stephenw10 is asking for will be useful for seeing what that might be.
We might also want to look more at some of your other DNSBL - setting (on your other thread)
-
Hello All
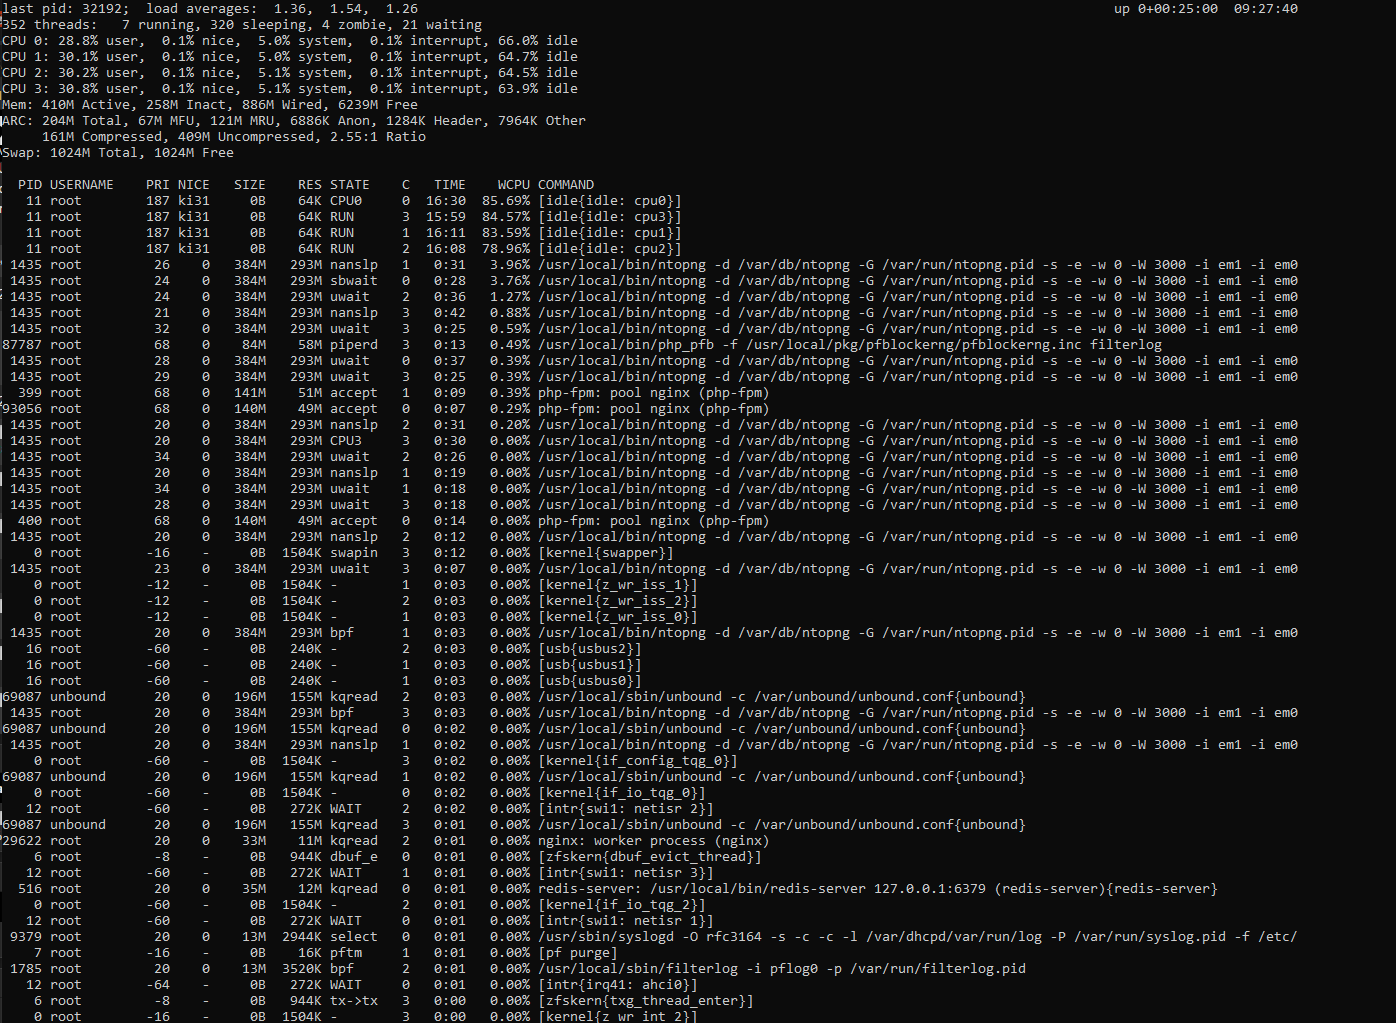
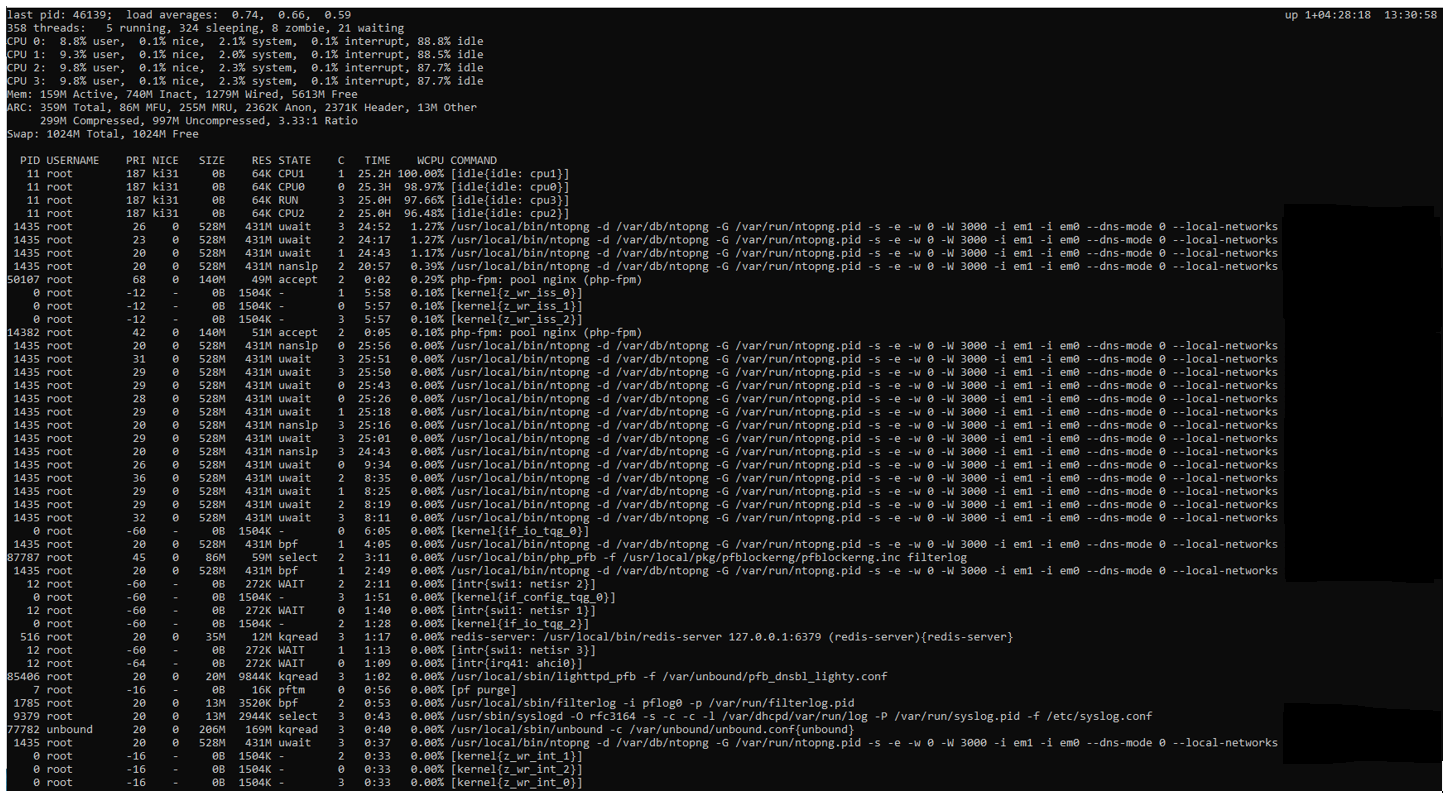
I wanted to wait a little while before responding as I noticed something odd. As I mentioned I did a reboot of the system to see if the issue was related to something being "stuck" in the old config but that didnt do anything. I was observing some unusual network activity yesterday and installed ntopng to see if I could get more info, what I noticed is that cpu usage has dropped way down and as of this message sits at 6% with some temporary spikes and this is with the ntopng dashboard window open. Not sure what to make of this but it is an interesting development on the positive side. Also b4 I forget I also updated PFB to 3.2.0_18 yesterday as well so that could also be the reason as well. Thanks for your feedback.#Stephen here is the output from the console, yes it looks different than what you get from within the system command line.
-
@stephenw10 said in Puzzling CPU Usage:
ntopng will use significant CPU cycles itself.
nailed it
look at the top processes right under the idle - that's a lot of ntopng happening there.
-
Yup that looks like completely normal usage. ntopng is using some. I don't really see anything unexplained or unexpected there.
-
@LPD7 said in Puzzling CPU Usage:
Also b4 I forget I also updated PFB to 3.2.0_18 yesterday as well so that could also be the reason as well.
possible - I guess (also not likely)
read this
https://forum.netgate.com/topic/190361/pfblockerng-devel-3-2-0_18/7?_=1727956822864
remember the pfblocker you are running "_18" is -devel code - so there are most likely "things" -- if you are "tinkering" that is ok, but on production likely best to stick to release code. IMHO (and don't try to go back now stay on _18)
Curious - have you rebooted at any point after doing any of these various updates / changes?
-
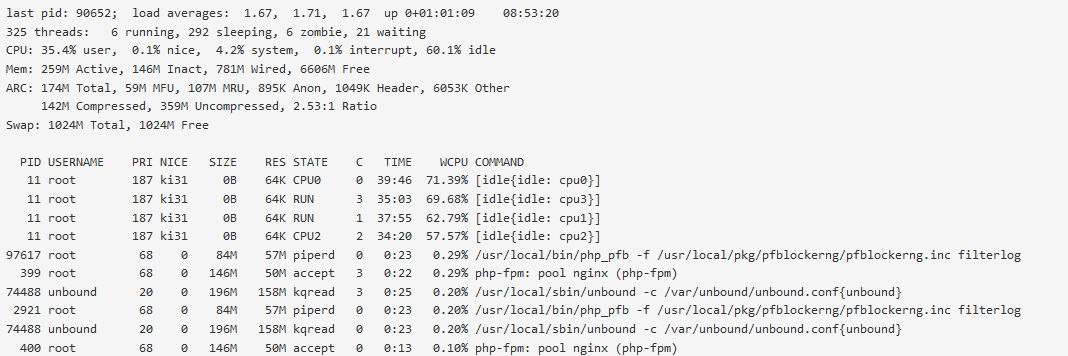
Appreciate your insights this is helping me get a handle on how to diagnose oddities. What I ran across is that within the last half hour my box lost connectivity to the internet. I recycled the provider router and connection was not restored until I rebooted my box. When I did cpu utilization shot up to 35+% and has remained there. This is where my curiosity is rooted and why I am looking for ways to get to the bottom of it as it does not make sense to me. If its normal based on what I am running or have configured then that will be one answer but the inconsistencies are what have my interest peaked. The following is the output from the console "top" command. Based on this output and simple math I cant see where the 35% is being used, my math comes up to 12.61% and the WCPU #'s seem to support this. Thank you for indulging me on this.
-
@jrey I did do a reboot at some point cant say specifically at which point in my journey that was done.
I appreciate your insights into devel and prod versions of PFB. I like to tinker but not sure if how I use PFB would be in the realm of tinkering or normal use. Since I have been using devel since using PFB I cant tell the difference I would probably have to see devel and prod side by side to see the differences. If I were to decide to go with the prod version is it as simple as just doing the install from the package manager or would I have to remove devel and do the install? Also would I have to rebuild my PFB config post change or could I do a restore of a previous backup to get back to that point?
Thanks for the link, I will look it over and see if a light bulb goes off.
-
Hmm, after 25mins I would have expected any boot processes to have finished.

Does that mystery usage eventually subside?
-
@LPD7 said in Puzzling CPU Usage:
I would probably have to see devel and prod side by side to see the differences.
For a long time they were the same, but now they are different again.
by tinkering I wasn't implying that you are coding, but rather tinkering is being done in dev and sometimes it is just better to stay on the production release, until that tinkering by devs stabilizes. (but don't go back now)What I ran across is that within the last half hour my box lost connectivity to the internet. I recycled the provider router and connection was not restored until I rebooted my box.
can you clarify this - I don't take that to mean that the boot process took 25 or more minutes - did it?
pfblocker has nothing to do with connectivity to the internet if the connection is lost and didn't come back up - until you rebooted that is likely something else --- pfb is not responsible for maintaining the connection. (you aren't blocking your ISP are you?)
what kind of connection ?are all the alias pfb lists that you are building actually used in a rule ?
in particular pfb_NAmerica_v4 is that in an Allow or Deny Rule? -
@stephenw10 Hi Stephen yes I have noticed that after the system is up and running for a while (havent actually timed it but say an hour or so) the system cpu usage goes down, as of this message my cpu usage is at 5-7% with an occasional spike which doesnt seem to last very long. Now I am guessing that you saw something related to bootup that was strange, did you get that from the fractional WCPU percentages .88, .59 and so on or did you see that somewhere else? Anything to worry about or that I can correct?
Intelligence is not a substitute for common sense.
Intel i5-3427 * 1.80GHz * 8GB Memory * 100GB HDD
Putting legacy equipment into service and out of landfills. -
@jrey Hi Jrey no the system took about 2 mins or so to boot up, seemed like the normal time frame. I didnt think PFB casued the connection issue I just noticed that after it rebooted that the cpu usage was again high and I expected it to be lower since everything would have been flushed and the system started from scratch. The fact that I see lower cpu % numbers after a period of time after reboot and that spikes are limited in duration that the sustained spikes to me say something, what that is exactly is what I am trying to figure out. Stephen noted something about the boot processes, he may have seen something in the screenshot that was out of whack but dont know yet. As long as the cpu% goes down and spikes are short in duration I think I can live with that as long as the consensus is that there is no underlying issue. Again this all comes from my knowing how the box behaved prior to my cleaning up feeds and lists and the pfb 3.2.0_7 bug that I had to correct and now learning what the new normal should look like. Appreciate your feedback.
-
@LPD7 said in Puzzling CPU Usage:
Now I am guessing that you saw something related to bootup that was strange, did you get that from the fractional WCPU percentages .88, .59 and so on or did you see that somewhere else?
Nope, nothing jumps out there other than the fact there seems to be usage that isn't accounted for.
I just know that at boot a bunch of things run that can take some time to complete. But I would normally have expected that to complete well within 25mins.
Is there anything logged when the usage goes back down to base levels?
-
@stephenw10 When you say logged do you mean the output using the Top -HaSP command?
I just ran the command and included the output below, cpu % at this time was 6%.
Intelligence is not a substitute for common sense.
Intel i5-3427 * 1.80GHz * 8GB Memory * 100GB HDD
Putting legacy equipment into service and out of landfills. -
@stephenw10 Can you tell me why when I run commands in the SSH shell why I get permission denied? I am playing around to get familiar/comfortable with using the shell to troubleshoot and tried the pftop command which is supposed to run from the shell and i get the permission denied response. I do recall reading somewhere that anyone other than "admin" can only run a subset of commands and the rest are reserved for the admin.
Update: I re enabled the admin account and am able to get to the enhanced shell. I am reluctant to keep the admin account active and I think doing so contradicts suggestions regarding securing PFS. But since only lan devices can access the box via ssh I am less concerned for now. I think it would be a good idea to see users who are configured as admins to have functionality somewhere in the middle so there is a balance between security and functionality.
-
@LPD7 said in Puzzling CPU Usage:
When you say logged do you mean the output using the Top -HaSP command?
No I mean in the system log. If something finishes or exits it may log something there.
@LPD7 said in Puzzling CPU Usage:
Can you tell me why when I run commands in the SSH shell why I get permission denied?
Yup it's probably because you weren't logged in as root/admin.
-
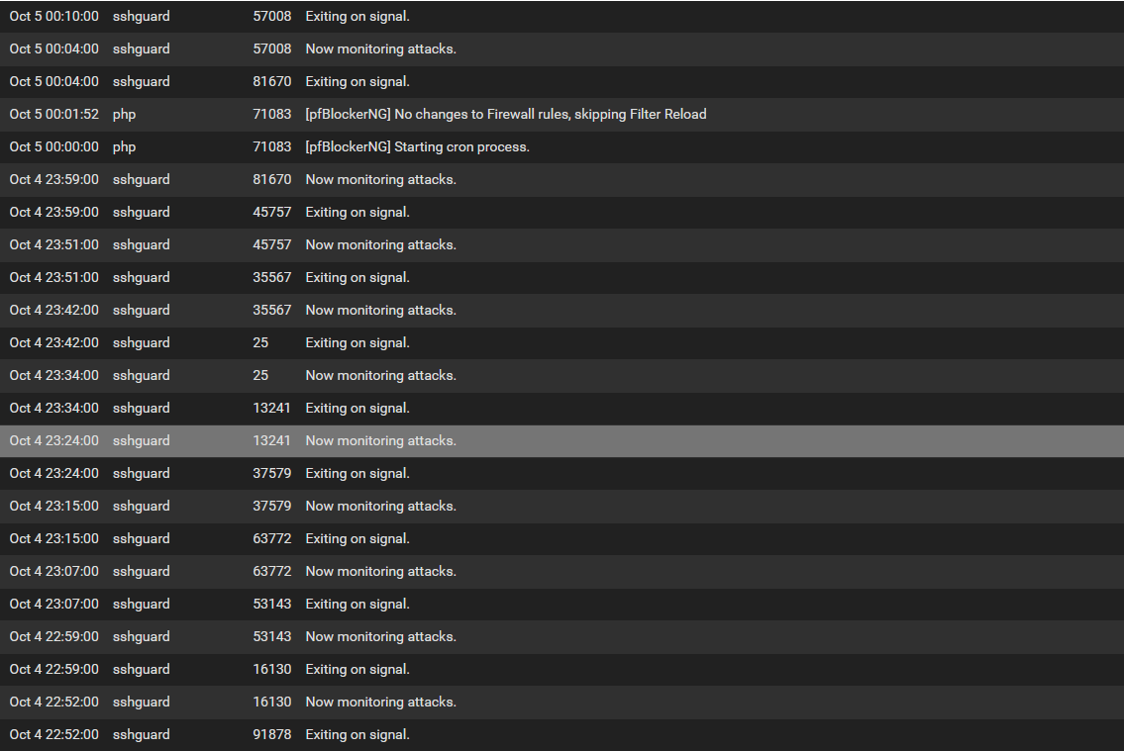
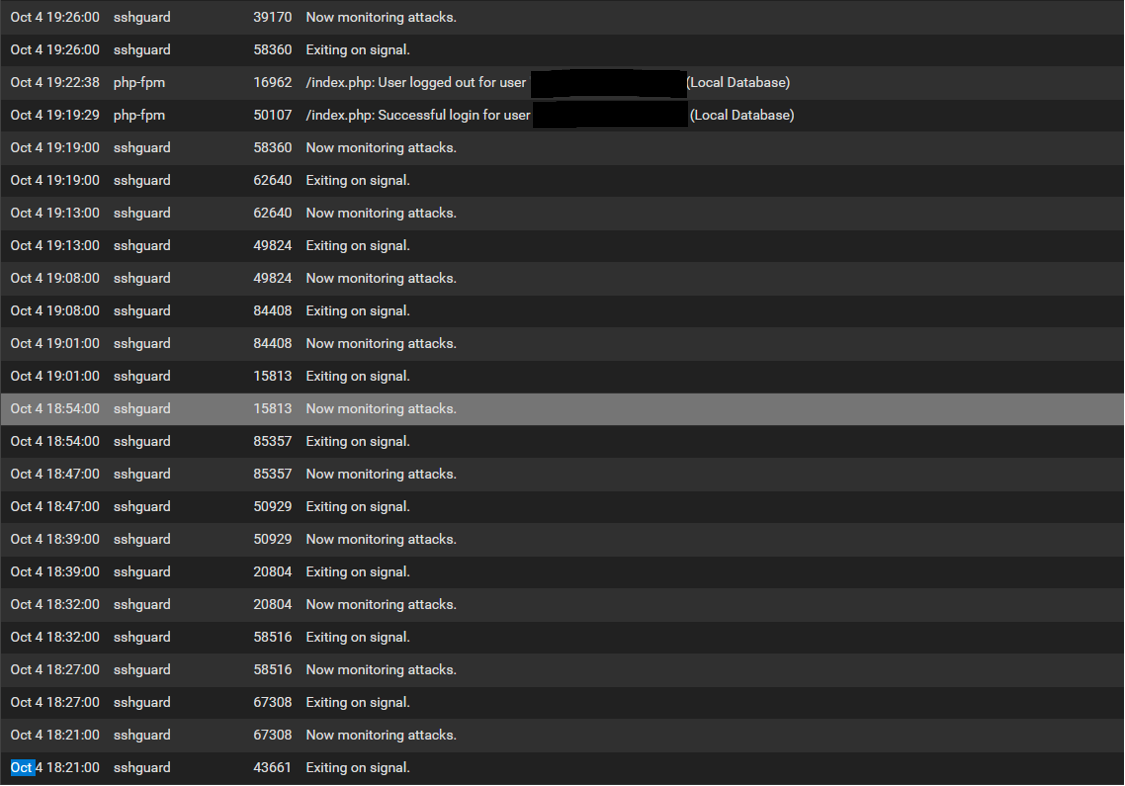
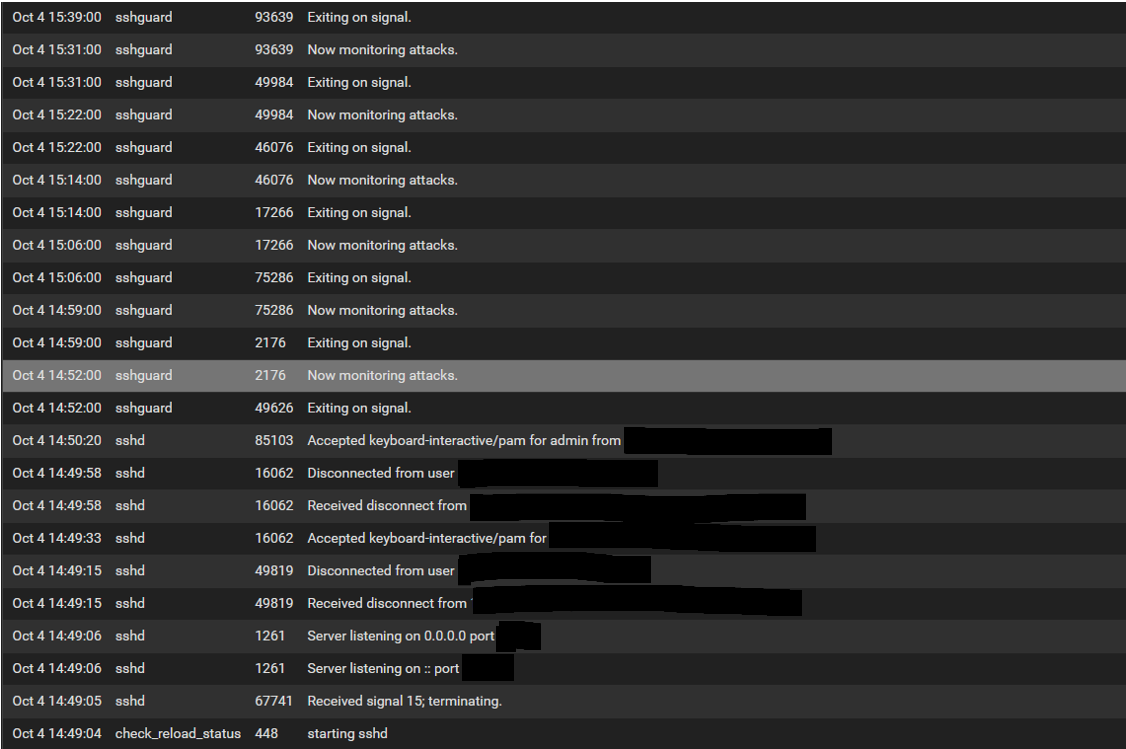
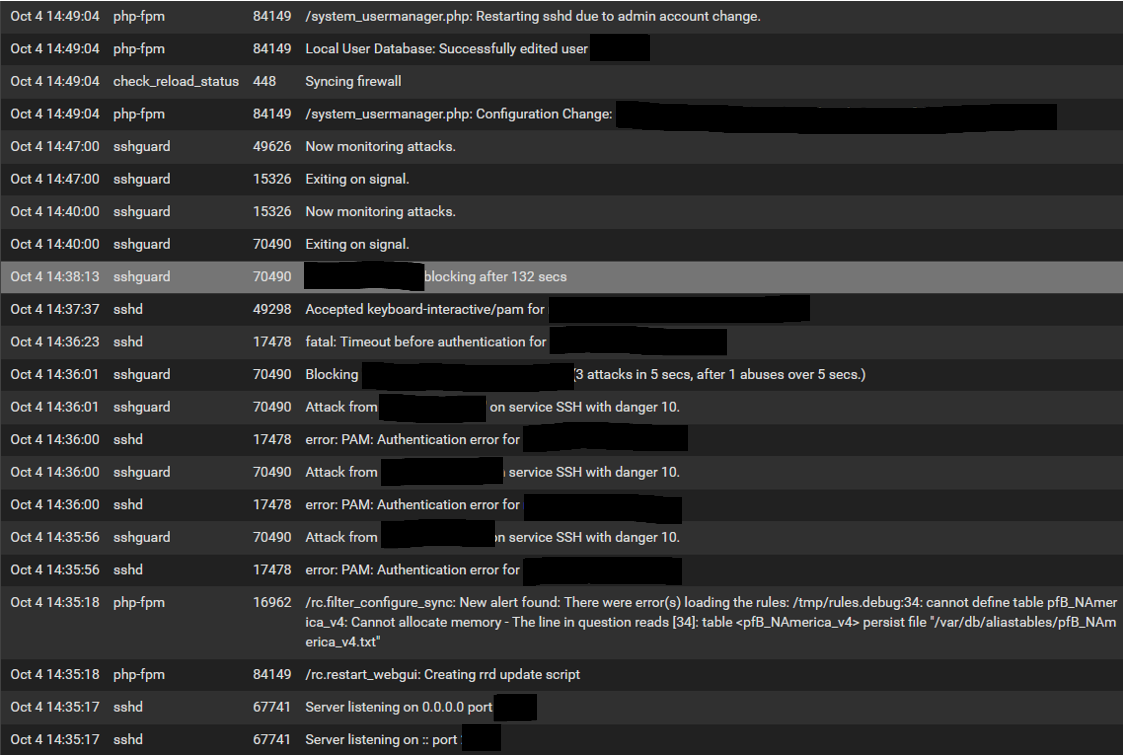
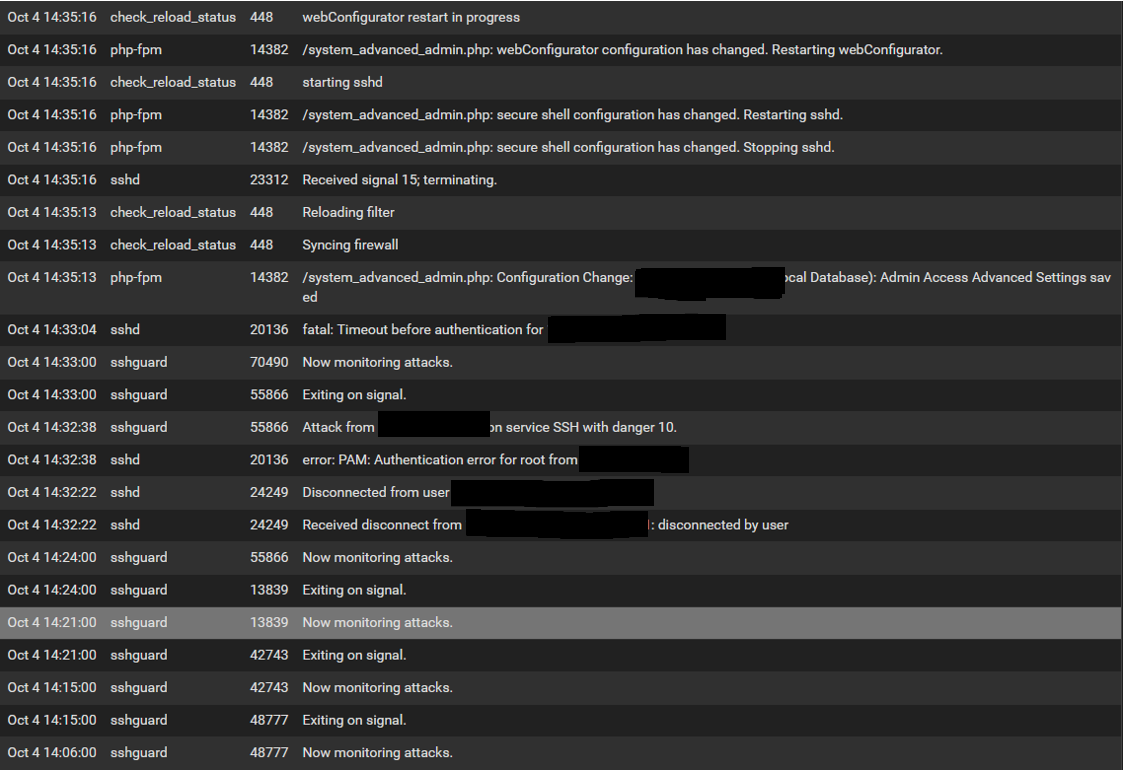
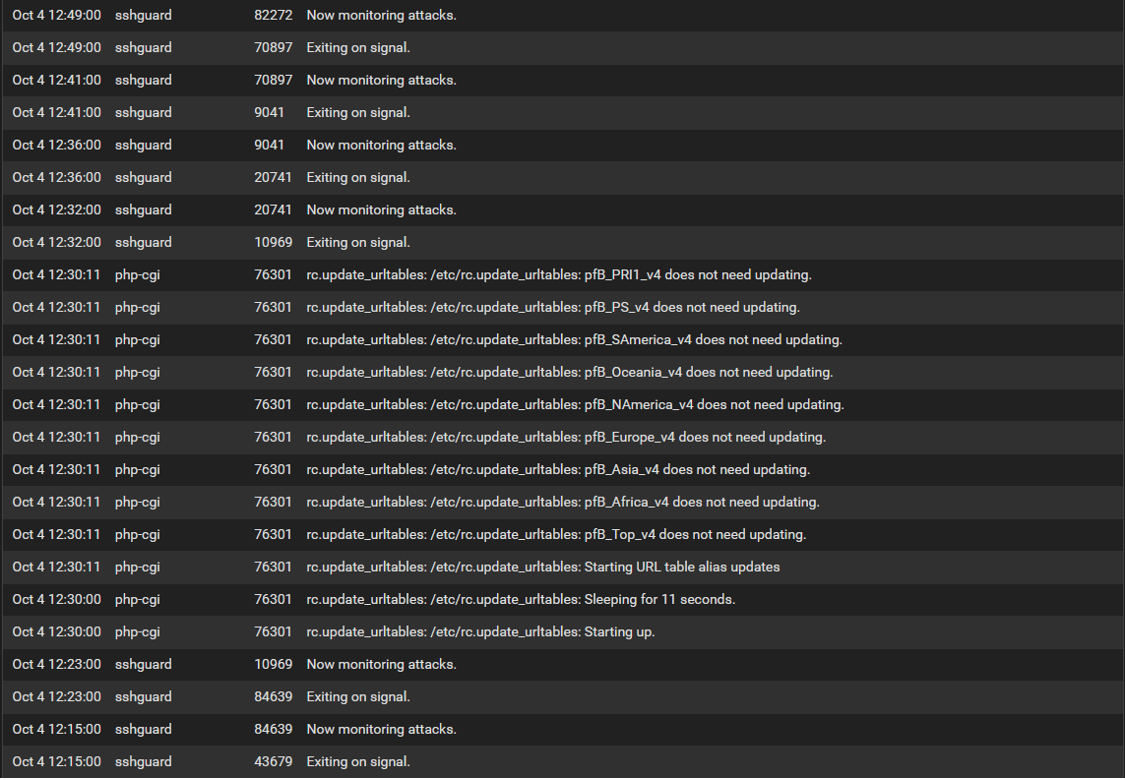
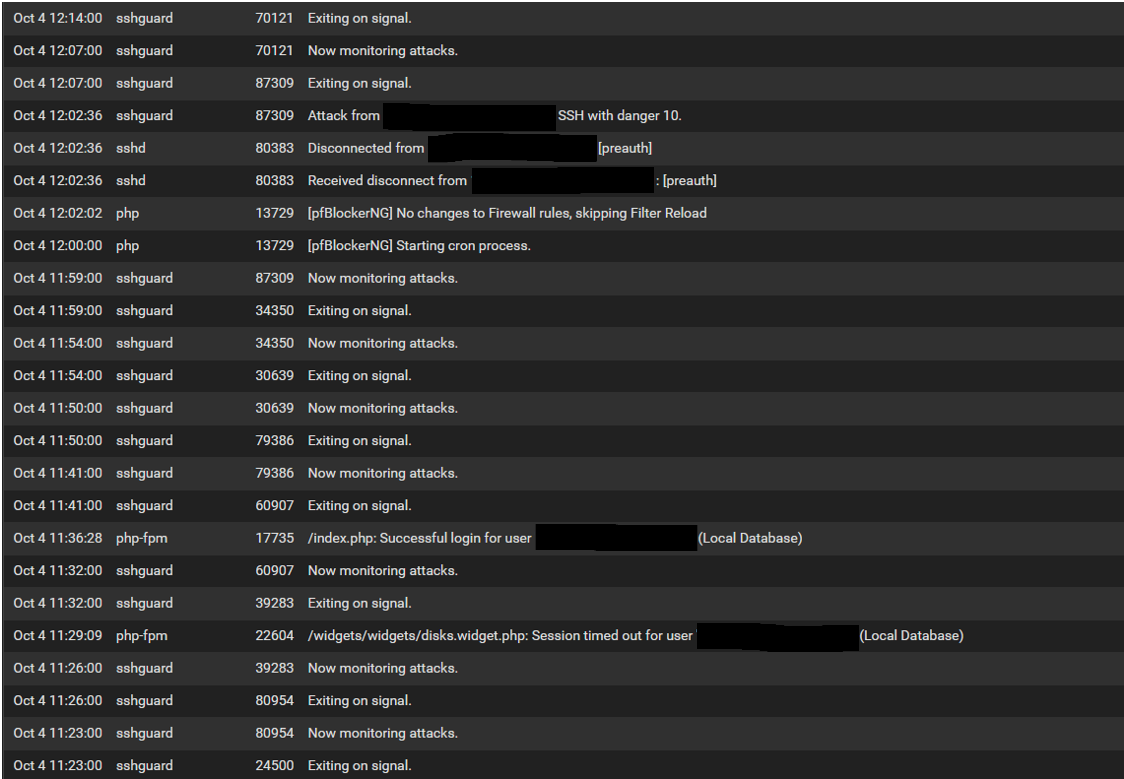
@stephenw10 How far back do you want to see for the log? I have about 15 pages and a lot of that is "exiting on signal" and "now monitoring attacks" messages. Also would that be from the System>General tab?
Update: I have included the pages that had details other than "exiting on signal" and "now monitoring attacks" messages from the System>General tab as there arent as many. I sometimes see the PID message 16962 about a memory issue but havent dove into this yet. Hope this helps. PS...When you see "attack" messages these are from my failed login attempts.