High CPU load pFsense 2.7.2 on Proxmox 8.2.4 with i5-6500 when using webinterface
-
Try running top on console and see which process has such high load, as a starting point
-
Try running top on console and see which process has such high load, as a starting point
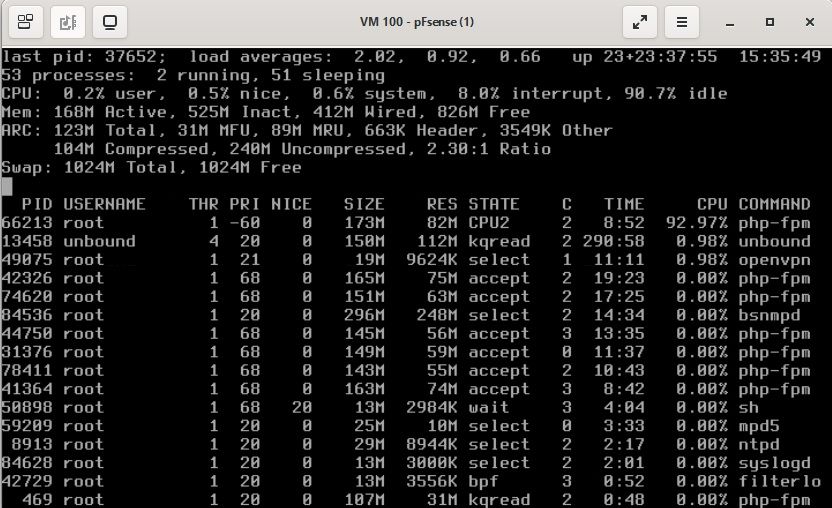
@netblues Thank you for your help. Just ran top (top -C -s 5). It seems php-fpm goes to 97% and more when I open the webinterface

-
Well php-fpm servers the web interface.
But this is more or less expected on hardware that is obsolete and is already 10 years old.And since you rebuilded everything from scratch, there isn't much you can do.
Anything older than G5 generation will behave like this.
And since you also want 1Gb pppoe, this is also limiting your max connection speed.Time to upgrade to something newer and more powerful.
-

PHP is high all the time ?
If so, do what @netblues says. Re install the same pfSense on the same device, but do not use a VM, so you can eliminate bad VM setup, and be sure your hardware can handle the task.Only when logged in ? And if so, showing what page ? Visit another page, like Status > Interfaces. PHP stays high ?
-
@boumacor I doubt Proxmox is the culprit here, although some misconfiguration perhaps?
And the CPU should be able to cope... I use a PC Engines APU2 at another site and it has an AMD GX-412TC CPU. Compared to that, the i5-6500 is a beast and I'm only seeing an average of around 10% at idle when logged in, over VPN and with pfBlockerNG and Suricata (legacy mode) loaded and running.
So if your normal load means idle, I think 30-35% sounds very high...What does your VM config look like? If you select Hardware on the pfsense VM in Proxmox menu?
On my pfsense VM at home I have Host CPU selected and have enabled eas as well (showing up in pfsense). And I use q35 host machine.I don't know what happens in a case where you allocate all Cores to a VM and the host (Proxmox) has to "fight" for it. So that could perhaps be a problem area as well? I suppose you could get some overhead from that, but I don't know if it would be that bad?
-
@Gblenn said in High CPU load pFsense 2.7.2 on Proxmox 8.2.4 with i5-6500 when using webinterface:
. I use a PC Engines APU2 at another site and it has an AMD GX-412TC CPU. Compared to that, the i5-6500 is a beast
What speeds are you pushing through it? How many connections?
Anything above 1Gbps is an issue on legacy hw -
@netblues Currently this site has a 250 Mbit/s connection and I have no trouble saturating that running iperf over IPSec. And then it shows the CPU jumping up to around 70-80% perhaps. I was running 6 parallel iperf streams I got ~260-270 Mbit/s or so, and this was over IPSec which adds a bit of overhead I assume.
About two years ago, I had this device at our house and used to get 900+ Mbit/s on Speedtest back then. I have also used and tested the Unifi EDGE Router X which is an even less powerful device. But it too can achieve 900+ Mbit over WAN, with HW offload enabled. So I don't think the numbers are representative of the CPU in this case. It's most likely something else that is wrong...
-
Found something, removed PFBlockerNG Dev from the device. Now the load and speed is back to normal. Very strange.
-
@boumacor Hmm, well there may be something with pfBlocker but you should be able to use it. Again, on the same low powered device I mentioned (APU 2), I run both Suricata and pfBlockerNG and still only get around 10% when logged in. Monitoring it remotely with e.g. Zabbix, I see on average 4.5% CPU (reported as User time + System time) when there is very little activity in that house.
What I did notice recently though was that after adding a few extra blocklists for DNSBL, I saw load go up to around 20% at idle. Similar thing at home but around 6-7% instead since it's a more powerful machine.
After some investigation I ended up removing one really big list (HiGaZiTif, with over 880k entries).
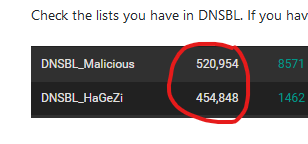
Check the lists you have in DNSBL. If you have pfblockerng up on the dashboard, you will see how many entries each list contain, like this:
 .
.Then go into pfblocker settings under DNSBL > DNSBL Groups and disable them one by one, starting from the largest list and see if it works?
-
Nice example
 :
:
this means : over one million hosts names are loaded with these two files.
This happens when these are loaded :
First, the files are converted to the pfBlockerng internal format one by one.
Then, the DNSBL files are added all together in one big file.
Then this file is scanned for 'doubles' and these are removed one by one.Wait ... do I here some one complaining this takes time and loaded the PHP process to the max ? ?? No sh##t !
All this is done with PHP, not really worlds fastest language. Some serious CPU power will be needed here. I, for one, wouldn't even think about using a VM here. Install pfSense barebone on that "i5-6500 " and now you have some headroom.
For example, I use a Netgate 4100 and I guess adding 1 million DNSBL will take the system to its knees, or plain 'break'.
-
@Gertjan said in High CPU load pFsense 2.7.2 on Proxmox 8.2.4 with i5-6500 when using webinterface:
I, for one, wouldn't even think about using a VM here. Install pfSense barebone on that "i5-6500 " and now you have some headroom.
Hmmm, based on what I can see from a little bit of testing, it's shouldn't be so bad actually. My small system (APU 2) has a 1Ghz core clock and gets a multithread rating at CPU-mark of a lousy 650... Which compares with the i5-6500 at 3,2 Ghz and a multithread rating of 5600.
On this system I have about 660k in the DNSBL list. And it seems there were around 225K duplicates across 4 lists that I use.
Running a forced reload of DNSBL takes about 4 minutes to reach this: DNSBL update [ 661654 | PASSED ]... completed [ 11/2/24 23:53:25 ]
And another 30 seconds or so to run GeoIP, IPv4 and some other final processing.Monitoring Top during this, most if the time I only saw a single Core popping up at close to 100% load. And now and then two CPU's at the same time, but never more. In the dashboard the CPU load hovered around 40 and "spiked" to 55-60% here and there topping once at 70% at the end.
But on my virtualized pfsense (Proxmox) with an i5-11400, also with 4 cores assigned, I'm seeing this instead...
Running Force Reload Task - DNSBL
UPDATE PROCESS START [ v3.2.0_20 ] [ 11/3/24 00:08:04 ]
.....
Starting Unbound Resolver... completed [ 11/3/24 00:08:39 ]
Resolver cache restored [ 11/3/24 00:08:40 ]
DNSBL update [ 1382386 | PASSED ]... completedWatching Top, I never really saw any CPU load for long enough to really notice and on the dashboard I saw it go to about 25-30% perhaps. Zabbix data shows it topped at 30% but it's not sampling quickly enough to capture shorter peaks I guess.
-
@Gblenn I too run pfsense virtualised (proxmox) on old hardware (i7-3770S) alongside containers. I don't see any performance issues with pfsense either, in the webUI or otherwise.
I don't use pfBlocker's DNSBL just the IP blocking. Whilst I understand downloading and updating DNSBL may be CPU intensive, why would that impact performance on every visit to the dashboard? Is the pfblocker widget CPU intensive with respect to building DNSBL stats counters?