pfSense 2.7.2 in Hyper-V freezing with no crash report after reboot
-
Hey,
We had another outage today, unfortunately no further information could be retrieved via the console.
The system that failed is an updated system that runs on ufs and does not use a ha proxy.
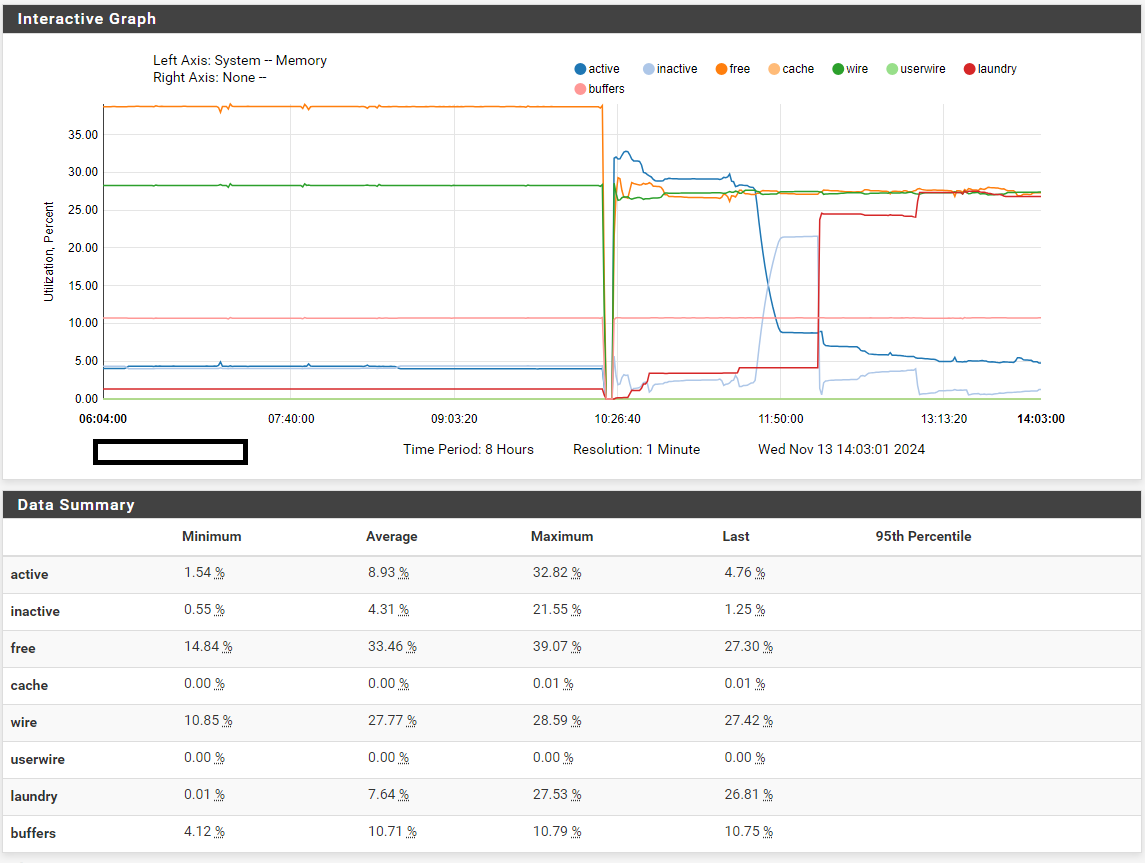
Failure pattern is the same again. Normal load and suddenly no response from the system and total traffic failure. As alsways no crash report.
The following are the system loads
RAM
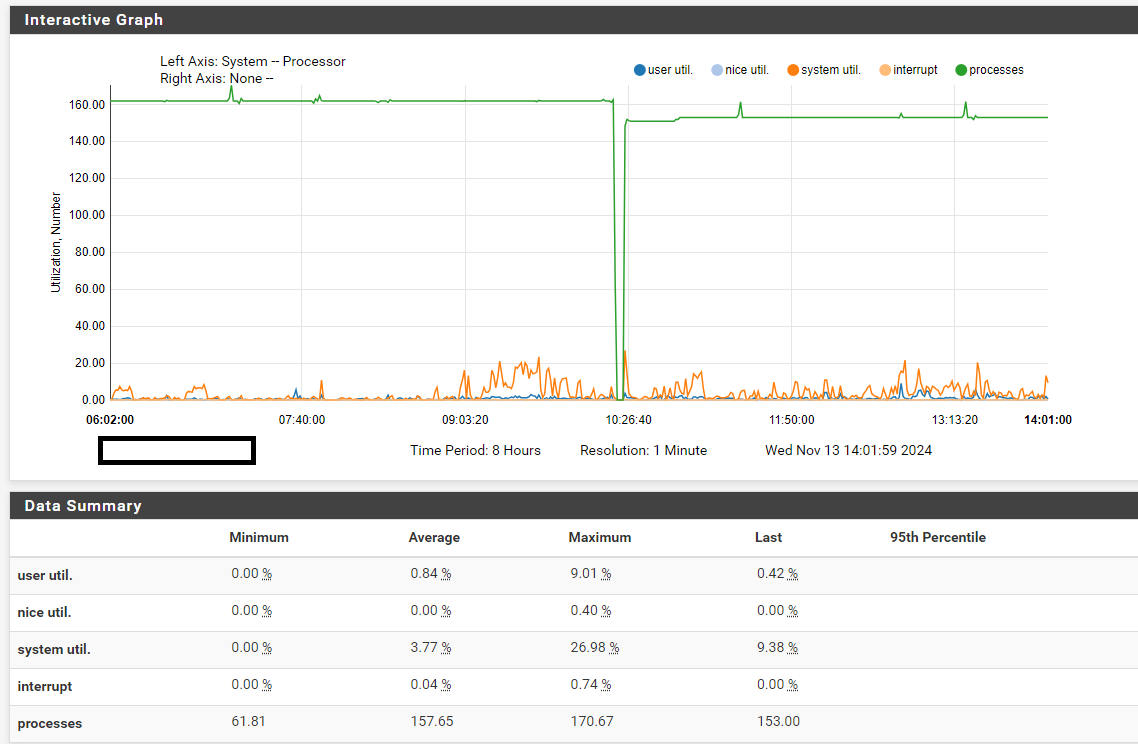
Proccesses:
Any other Idea how we can track down the cause?
-
Do you see anything in Hyper-V? Usage spikes etc?
-
I appreciate your help
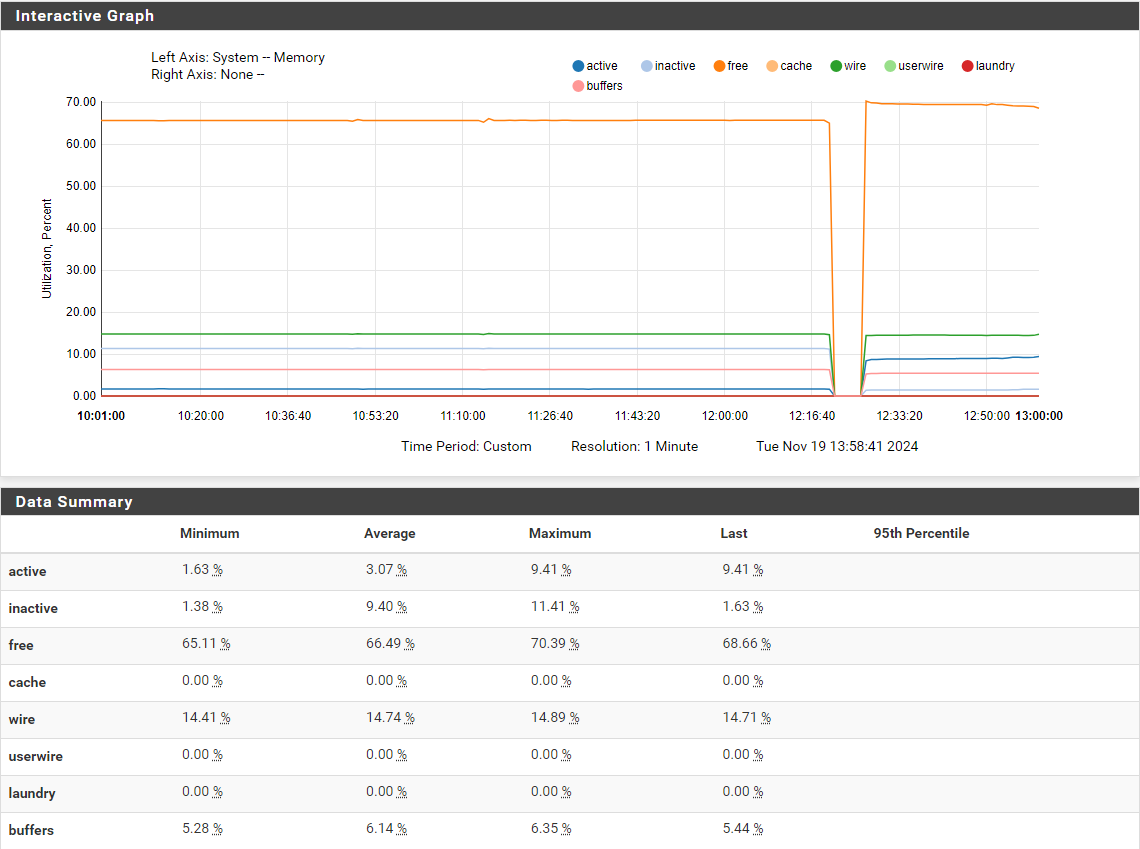
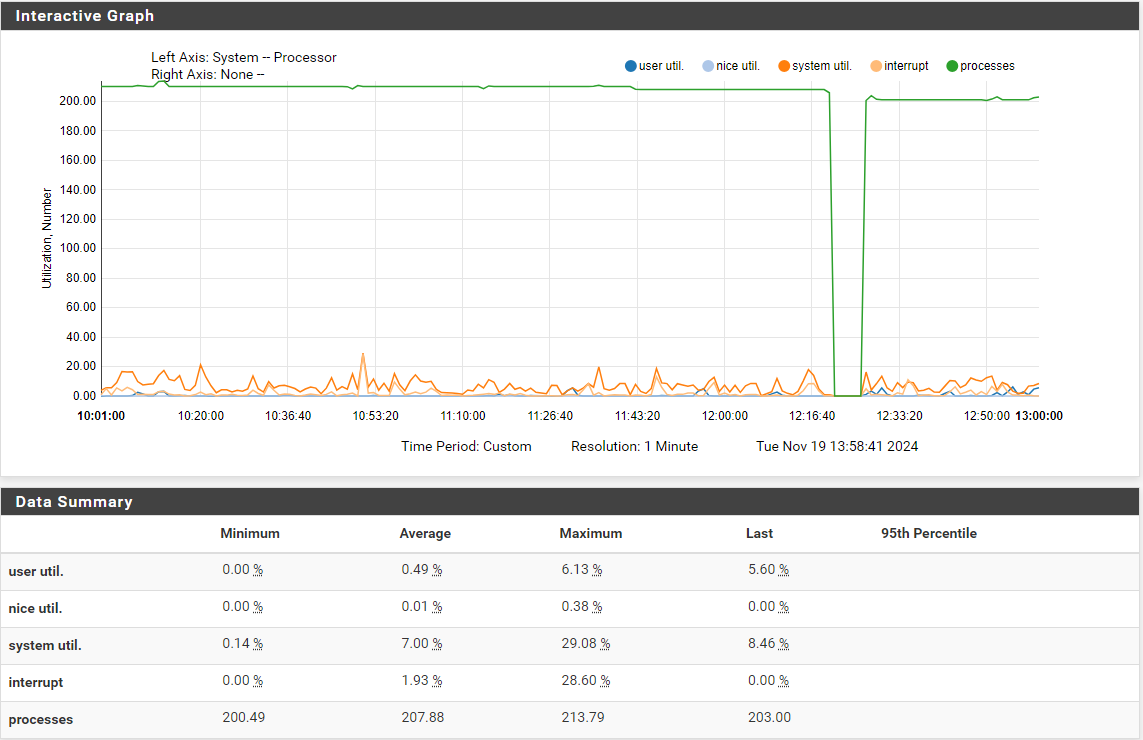
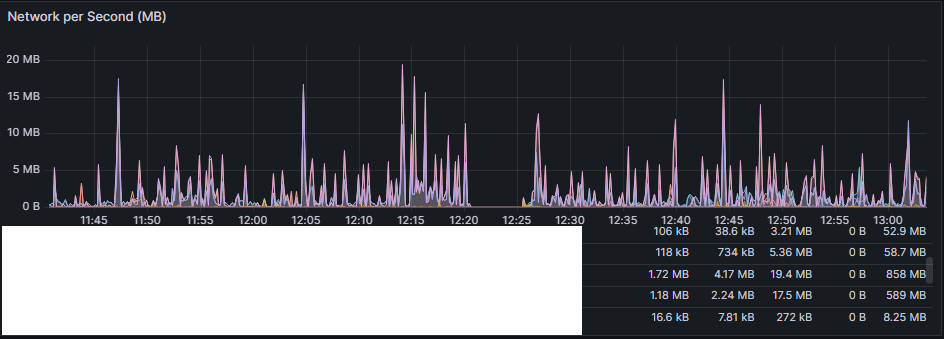
I have checked our Grafana for the HyperV again and can indeed detect a CPU spike on the system, just before the freeze.
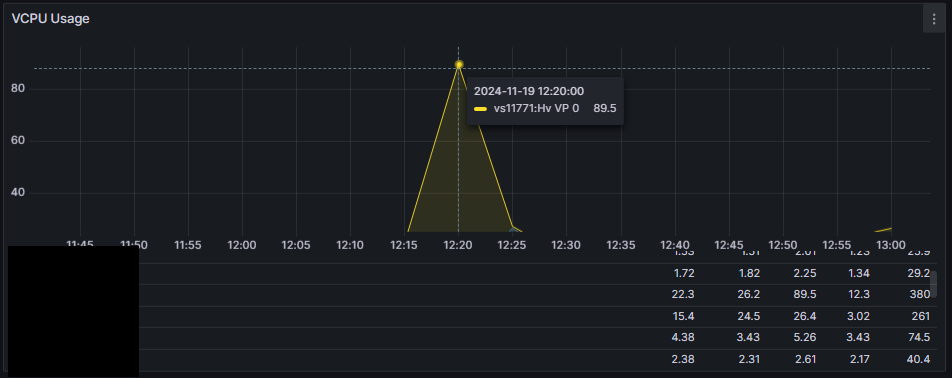
And a complete loss of traffic
-
Hmm, so like some process uses all the CPU cycles until it's rebooted. Yet nothing is logged....

-
Today we had another freeze. Same symptomps, no logs, no console. All we see is a CPU Spike right before the freeze.
Any other Ideas how to continue? Are we the only ones with this issue?
We are currently running 71 pfSense 2.7.2 and around 10 of them are showing the issue. We tried reinstalls on fresh 2.7.2 images to make sure there is no issue with the updating from 2.6.
All our 2.6 and 2.5.2 System run without these issues.
-
we just had another freeze. This time i have a couple of new errors in the logs before the logs completely stop.
Maybe this helps narrowing it down.
Nov 22 16:55:35 kernel Copyright (c) 1992-2023 The FreeBSD Project. Nov 22 16:55:35 kernel ---<<BOOT>>--- Nov 22 16:55:35 syslogd kernel boot file is /boot/kernel/kernel Nov 22 16:52:00 sshd 11196 Accepted publickey for root from xxx.xxx.xxx.xxx port 6014 ssh2: RSA SHA256:xxxxxxxxxxxxxxxxxxxxxxxxxx Nov 22 16:51:56 sshd 8691 Accepted publickey for root from xxx.xxx.xxx.xxx port 13587 ssh2: RSA SHA256:xxxxxxxxxxxxxxxxxxxxxxxxxx Nov 22 16:51:19 pfSctl 2755 could not finish read in a reasonable time. Action of event might not be completed. Nov 22 16:51:16 sshd 53470 Disconnected from user root xxx.xxx.xxx.xxx port 52790 Nov 22 16:51:16 sshd 53470 Received disconnect from xxx.xxx.xxx.xxx port 52790:11: disconnected by user Nov 22 16:51:16 sshd 26642 fatal: Timeout before authentication for xxx.xxx.xxx.xxx port 27224 Nov 22 16:51:16 rc.gateway_alarm 22904 >>> Gateway alarm: WANGWv6 (Addr:xxx:xxx:xxx::xxx Alarm:0 RTT:50.416ms RTTsd:167.822ms Loss:0%) Nov 22 16:50:46 php-fpm 60747 /rc.openvpn: OpenVPN: One or more OpenVPN tunnel endpoints may have changed IP addresses. Reloading endpoints that may use GW_WAN. Nov 22 16:50:46 check_reload_status 416 Reloading filter Nov 22 16:50:46 check_reload_status 416 Restarting OpenVPN tunnels/interfaces Nov 22 16:50:46 check_reload_status 416 Restarting IPsec tunnels Nov 22 16:50:46 check_reload_status 416 updating dyndns GW_WAN Nov 22 16:50:46 check_reload_status 416 updating dyndns WANGWv6 Nov 22 16:50:46 sshd 50953 Disconnected from user root xxx.xxx.xxx.xxx port 60047 Nov 22 16:50:46 sshd 50953 Received disconnect from xxx.xxx.xxx.xxx port 60047:11: disconnected by user Nov 22 16:50:46 rc.gateway_alarm 10435 >>> Gateway alarm: GW_WAN (Addr:xxx.xxx.xxx.xxx Alarm:0 RTT:52.696ms RTTsd:60.464ms Loss:0%) Nov 22 16:50:38 sshd 17812 fatal: Timeout before authentication for xxx.xxx.xxx.xxx port 33797 Nov 22 16:50:33 sshd 18507 fatal: Timeout before authentication for xxx.xxx.xxx.xxx port 39653 Nov 22 16:50:28 sshd 18455 fatal: Timeout before authentication for xxx.xxx.xxx.xxx port 21224 Nov 22 16:50:28 sshd 17705 fatal: Timeout before authentication for xxx.xxx.xxx.xxx port 1337 Nov 22 16:50:23 sshd 25669 Accepted publickey for root from xxx.xxx.xxx.xxx port 11618 ssh2: RSA SHA256:xxxxxxxxxxxxxxxxxxxxxxxxxx Nov 22 16:50:01 pfSctl 17188 could not finish read in a reasonable time. Action of event might not be completed. Nov 22 16:49:58 sshd 99832 Disconnected from user root xxx.xxx.xxx.xxx port 60268 Nov 22 16:49:58 sshd 99832 Received disconnect from xxx.xxx.xxx.xxx port 60268:11: disconnected by user Nov 22 16:49:58 sshd 18141 Accepted publickey for root from xxx.xxx.xxx.xxx port 15849 ssh2: RSA SHA256:xxxxxxxxxxxxxxxxxxxxxxxxxx Nov 22 16:49:58 sshd 1365 Disconnected from user root xxx.xxx.xxx.xxx port 53098 Nov 22 16:49:58 sshd 1365 Received disconnect from xxx.xxx.xxx.xxx port 53098:11: disconnected by user Nov 22 16:49:58 sshd 53096 Disconnected from user root xxx.xxx.xxx.xxx port 65117 Nov 22 16:49:58 sshd 53096 Received disconnect from xxx.xxx.xxx.xxx port 65117:11: disconnected by user Nov 22 16:49:58 sshd 97774 fatal: Timeout before authentication for xxx.xxx.xxx.xxx port 9367 Nov 22 16:49:58 rc.gateway_alarm 69423 >>> Gateway alarm: WANGWv6 (Addr:xxx:xxx:xxx::xxx Alarm:1 RTT:26.765ms RTTsd:25.516ms Loss:21%) Nov 22 16:48:51 check_reload_status 416 Reloading filter Nov 22 16:48:51 check_reload_status 416 Restarting OpenVPN tunnels/interfaces Nov 22 16:48:51 check_reload_status 416 Restarting IPsec tunnels Nov 22 16:48:51 check_reload_status 416 updating dyndns GW_WAN Nov 22 16:48:51 sshd 50248 Disconnected from user root xxx.xxx.xxx.xxx port 25550 Nov 22 16:48:51 sshd 50248 Received disconnect from xxx.xxx.xxx.xxx port 25550:11: disconnected by user Nov 22 16:48:51 sshd 51781 Disconnected from user root xxx.xxx.xxx.xxx port 45454 Nov 22 16:48:51 rc.gateway_alarm 59700 >>> Gateway alarm: GW_WAN (Addr:xxx.xxx.xxx.xxx Alarm:1 RTT:509.029ms RTTsd:1028.814ms Loss:0%) Nov 22 16:48:51 sshd 51781 Received disconnect from xxx.xxx.xxx.xxx port 45454:11: disconnected by user Nov 22 16:48:41 sshd 1365 Accepted publickey for root from xxx.xxx.xxx.xxx port 53098 ssh2: RSA SHA256:xxxxxxxxxxxxxxxxxxxxxxxxxx Nov 22 16:48:35 sshd 99832 Accepted publickey for root from xxx.xxx.xxx.xxx port 60268 ssh2: RSA SHA256:xxxxxxxxxxxxxxxxxxxxxxxxxx Nov 22 16:48:29 sshd 97374 Accepted publickey for root from xxx.xxx.xxx.xxx port 55569 ssh2: RSA SHA256:xxxxxxxxxxxxxxxxxxxxxxxxxx Nov 22 16:48:22 sshd 53683 fatal: Timeout before authentication for xxx.xxx.xxx.xxx port 4106 Nov 22 16:48:22 sshd 52565 fatal: Timeout before authentication for xxx.xxx.xxx.xxx port 34558 Nov 22 16:47:53 sshd 78140 Disconnected from user root xxx.xxx.xxx.xxx port 49005 Nov 22 16:47:53 sshd 78140 Received disconnect from xxx.xxx.xxx.xxx port 49005:11: disconnected by user -
Hmm, unfortunately nothing there really looks like an issue. Certainly not something that would cause it to stop responding entirely.
We could try running dtrace against it to see what's using the cycles but I think we'd need some way to trigger it before it stopped responding.
If you create a test instance in the same hypervisor does that also stop responding?
-
 S stephenw10 moved this topic from General pfSense Questions on
-
I've been having the same issue when I first upgraded to 2.7.0. (at least I think it is the same issue). After 3-4 days pfSense would freeze completely, no GUI, no SSH and no console.
As I only have one installation of pfSense and use it as VPN (openVPN+IPSec) server to access work network from home, when it would freeze I also had no access to the VM until the next day. In the few cases that I was there during the freeze i noticed the following:- GUI would go first. It would slow down to a crawl and soon stopped responding.
- By the time GUI was unresponsive, SSH would still work but was excruciatingly slow. Then after a while SSH would no longer connect. However OpenVPN / IPSec and routing in general seemed to be still working (probably with limited bandwidth).
- Not sure of the timeframe but once SSH failed to connect, console was also dead. Hitting Ctrl-T at the console did nothing, it's completely frozen.
It is curious that IP connectivity was the last to go, i.e. there were still some packets passing through the router while the console was frozen. I know because, while being there, sometimes access to the internet would slow down and I would check the console and it was already frozen. After a few minutes IP connectivity would fail as well.
I know all this doesn't help much, but the way I see it there must be something wrong at the kernel level (or kernel driver). No matter what a user level process does it cannot bring the entire system down (after all that's what the whole point of running the kernel in ring-0 protection level - isolating processes from one another and protecting the entire system from misbehaving processes).
P.S.: I've since downgraded to 2.6 and have no issues at all. Still I would love to figure this out so I can upgrade to 2.7 again.
-
Is this an old VM? Was it created as an old hyper-v version?
Anything logged at all?
-
@stephenw10 it was quite few months ago, so I'm not really sure.
I know it was on hyperv 2016 (the free version). I think at some point I had a crash that totally messed up the VHD so I just reinstalled 2.7.0 from scratch on new VM and imported last saved configuration. Didn't make any difference, same issue in a few days. No logs whatsoever. I mean nothing out of the ordinary, just started to slow down, and finally froze. -
I don't have anything hyper-V here but someone may have a suggestion.
-
Monitor top -aSHm cpu via SSH, and you'll see [kernel{hveventN}] consuming all your CPU until pfSense crashes or freezes. While it's difficult to reproduce, certain factors increase its occurrence, such as using large filter lists, extensive MAC filters for CP, bogonv6, scheduled rule times (cron 00/15/30/45), and actions triggering filter reloads.
This issue also occurs on bare metal, but it's so rare that most users don’t notice it; I experienced it twice since January. However, after transitioning from bare metal to Hyper-V two weeks ago, it now happens 2-3 times a week.
I suspect that under specific conditions, the filter reload causes a process to lose its thread connections, resulting in an event storm.
No such problems with version 2.6.0 on the same HW or Hypervisor.
I'm sure dtrace or maybe procstat can shed some light here but that's beyond my capabilities.
-
Quick update: No incidents occurred for 7 days after disabling scheduled rule times. However, an incident recurred this morning after I manually enabled and disabled a WAN interface rule. I'm now disabling bogons for that interface to further troubleshoot.
-
@Bismarck What are you triggering with cron? I'd like to try replicating it in one of our testsetups.
Do you use large filter lists? -
@Techniker_ctr Maybe all my list are around 40k. To replicate, enable bognsv6 on your WAN interface (over 150k lines) and create a WAN rule with "scheduled rule times." With the cron package installed, check for /etc/rc.filter_configure_sync entrie which get executed every 0, 15, 30, and 45 minutes. Alternatively, install pfBlockerNG (which I don't have) and enable its heavy lists, duplicate the cronjob few times for overlapping schedules, and generate some traffic. Having a CP on an interface with few 100 of MACs should help, just ad rules at all available Interfaces. Expect results within 12-24 hours.
-
@Bismarck Status update: No incident in 9 days (incident occurred 4 days after last post). Changes since:
Guest (pfSense VM):
- Removed custom IP block lists; bogons re-enabled.
- Disabled "hn ALTQ support" (all offloading disabled).
- Uninstalled unused WireGuard and Syslogd-NG packages (Syslogd-NG was failing to start).
Host:
- Disabled RSC on interfaces/setSwitch.
- Disabled VMQ on all vNics.
Result: pfSense VM now runs very stable and reliably.
If you ask me, my best guess is disabling "hn ALTQ support" and / or the RSC/VMQ did the trick.
-
Greetings
Thanks for your testing @Bismarck
Unfortunately, we were unable to trigger the crash even after extensive testing. Regardless of how much traffic/states are generated, tables are created, or how often the filter is reloaded.
On our pfSense “hn ALTQ support” is activated.
RSC is deactivated on our host.
VMQ cannot be deactivated due to our infrastructureThis is identical on all our HVs. But we still have some random systems that fail.
Are there any other ideas on how we can trigger the crash?
-
Hi Techniker_ctr,
Unfortunately yesterday it happened again, but it occurs way less than before.
To be honest, I'm out of ideas. Do you use the system patches and apply the security fixes?
Because this system was running fine for 1 - 1 1/2 years without any changes, the issue started around January if I remember it right, and only one of three firewalls is affected.
Host: Windows Server 2022, Drivers are all up to date (2H24), nothing suspicious in the logs.
I saw your FreeBSD forum thread; I have the same issue. I was considering testing the alternate "sense", but a different hypervisor seems like a better solution.
Btw, did you try to run it as a Gen 1 VM?
-
Hi @Bismarck ,
we tried Gen1 as well as Gen2, happens on both setups. Recommended Security Patches are applied on all systems via the patches addon. Crazy is that some of our 2.7.2 pfSenses are running fine since nearly a year on this version, but most of the firewalls we installed or updated to 2.7 were crashing. Sometimes after a crash and reboot they crash a second time shortly after, maybe even a third time on some occasions.
We're also out of ideas, and as it's not wanted by higher levels to set up some proxmox hosts only for the ~300 firewalls, we might try some other firewall systems in near future. We do not know what else we can do for now, as we're unable to replicate it in a way someone at pfSense/OPNsense of FreeBSD could replicate it as well. -
Regarding your installations is it UFS or ZFS, could you check
topfor an ARC entry (e.g., "ARC: 2048B Total, 2048B Header")?I have three UFS pfSense instances (one bare metal, two VMs), and only one VM exhibits this issue. It displays an ARC entry in
topand haszfs.koloaded, despite being UFS.Unloading
zfs.kotemporarily removes the ARC entry, but it reappears shortly after. This behavior also occurred during OPNsense testing.I've unloaded and renamed
zfs.koto observe the outcome.HyperV CPU hvevent goes to 100%
Should a UFS machine have an ARC entry in top?
looking for the reason for sudden very high CPU utilization on network/zfs related process"However this is not what is observed. What was observed is consistent with busy waiting. The storagenode process was constantly in the “uwait” process state. As if instead of pulling back, moderating bandwidth, sleeping more, storagenode instead loops at a very fast rate on system calls that fail or return a retry error, or just polls on some event or mutex, thereby consuming high CPU while effectively doing nothing (which is also observed: lower performance, lower overall IO, more missed uploads and downloads)."
/edit
Quick recap: zfs.ko loads due to a trigger in kernel like ZFS storage access. Is your storage dynamic or fixed? This instance experiences the most reads/writes, just a guess.