Traffic Graph not accurate
-
Hi Guys, I just notice the traffic graph status and traffic graph dashboard is not accurate. What graph is the most accurate?
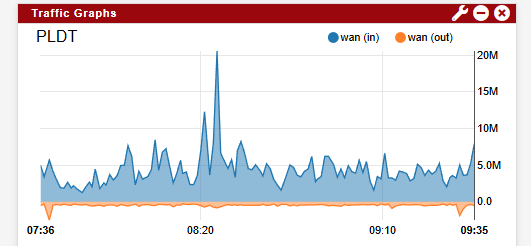
DASHBOARD

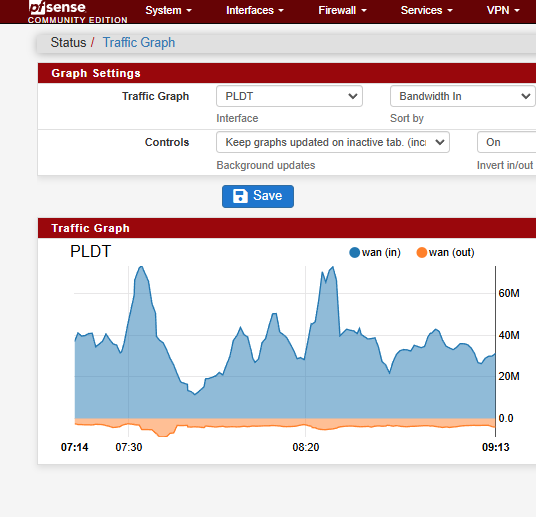
STATUS/TRAFFIC GRAPH

-
@antgalla They look reasonably the same to me, just with different time scale averaging.
-
@antgalla said in Traffic Graph not accurate:
What graph is the most accurate?
The grapher asks the NIC (interface driver) : how many packets with what size per packet was send since the last time I asked ?
The drivers give the total - and then resets its internal counters.When the grapher comes back xx ms later, the same question and operation gets executed.
Because the number of bytes is now know - and the time, an average speed is now also known.Normally, the NIC driver is aware about "what and how much was send".
But I get it, you (the person) thinks the stats do not show correct values.
Do you mind sharing why ?Counter questions :
No VPN ?
One WAN, two WANs ?
What pfSense version ? -
@Gertjan said in Traffic Graph not accurate:
No VPN ? with VPN but different interface(ISP)
One WAN, two WANs ? 2 WANs
What pfSense version ? 2.7.2 -
This doesn't have anything to do with VPN, multi WAN, etc. It's the same interface ("PLDT") in either case.
I checked the code. Both graphs are produced by /usr/local/www/js/traffic-graphs.js and the data for both comes from the same rrd file.
The graphs have different refresh rates, resulting in different time periods, which results in different time averaging intervals for rrd. The Traffic Graph page, with a hard-coded refresh rate of 1, ends up with a shorter time interval (magnified view) when compared to the Dashboard widget with a default refresh rate of 3. So on the Traffic Graph page you might see two brief spikes of 40M in quick succession, however on the dashboard widget only see one spike of 20M. It's still the same data.
FWIW, The graphs also have different smoothing applied, but this doesn't have nearly as much of an impact as the time averaging interval.
If you really want the Dashboard widget and the Traffic Graph page to match, you would need to change the widget refresh period to 1 second. In general this is not recommended due to the increased CPU requirement, but you have to decide what's more important to you.