WebGUI crashes with 50x when opening dashboard
-
Hi there,
I recently migrated my pfSense setup on a GoWin R86S-N from RJ45 to SFP28(using SFP+ modules in the SFP28 ports).
Since the change, the Dashboard takes a very long time to load, and sometimes even crashes the entire WebGUI with the error:"The web server encountered an error processing this request. 50x Error"I'm currently running 2.8.0.r.20250516.1521, but the issue also occurred on 2.7.0.
When I restart PHP-FPM, the WebGUI becomes responsive again — until I try to open the dashboard, which then causes the same problem all over again.
In the
/var/log/nginx.log, I found the following (possibly related) entries:[error] 13612#100388: *12 upstream timed out (60: Operation timed out) while reading response header from upstream, client: 192.168.1.151, server: , request: "GET / HTTP/2.0", upstream: "fastcgi://unix:/var/run/php-fpm.socket", host: "192.168.1.1", referrer: "https://192.168.1.1/haproxy/haproxy_pools.php" [error] 13821#100517: *307 upstream timed out (60: Operation timed out) while reading response header from upstream, client: 192.168.1.151, server: , request: "POST / HTTP/2.0", upstream: "fastcgi://unix:/var/run/php-fpm.socket", host: "192.168.1.1", referrer: "https://192.168.1.1/"Everything else (e.g., HAProxy pages) works fine — only the dashboard seems to cause this issue.
Has anyone experienced something similar or has a clue how to fix or debug this further?
Thanks in advance!
-
Hi there, new here just registered to give a lil suggestion.
I use pfsense on my labs in cloud and had the same issue. I played a bit with config revert or restarting fpm and webgui reset... still no luck.
Then i thought it might be caused by the last 2.8.0 and it being energy-intensive...It came out after digging a little, that with the newer version they suggest to have more than 1gb ram (i mean with this version that isn't a suggestion anymore...)
quote:
https://docs.netgate.com/pfsense/en/latest/releases/2-8-0.html
Low Memory Hardware
Hardware with 1 GiB or less available memory may have issues upgrading depending on which features, services, or packages are running.I used to run both pfsense vm with 512mb ram flawlessly...
well setting the ram to 1280mib solved it for me and it became 5x times faster at least
(maybe the HW upgrade you did triggered the sys to require more ram cuz of sfp+ throughput?)
hope it works for you too mate
good luck
btw sorry for my eng ^ ^''
-
@fulcx Thanks for your suggestion. I don't think thats an overall issue on my system. I run pfsense barebone on the GoWin R86S-N which has an Intel N305 and 32GB RAM. But maybe i can increase the RAM for php-fpm. I will try it
-
Sadly increasing the RAM of php-fpm did not work
-
That's a nice device, didn't know its specs sorry.
Anyway after increasing the fpm mem and restarting web gui and fpm from shell commands (I imagine you did that too) did you try using the php tools with the command playback resetwebui (or something like that... I don't remember commands precisely but it gives you the exact list as soon as you enter the tools )?
Idk maybe a default config for the dashboard solves the issue.. Just trying to help you out with this weird situation cuz I understand how annoying it is
Ps. If you go to ipv4:port/interfaces.php after the login, will it proceed?
Good luck with that
-
@fulcx
I really appreciate your help and input.
I increased the memory to 512M for php-fpm and restarted it via the menu that you get when logging in via ssh and entering 16. Is this the wrong way?.I mostly jump directly via ipv4/haproxy/haproxy_listeners.php after login and the site loads without a problem.
And do you maybe know, how to reset the dashboard?
-
Note: I also tested it with an empty dashboard and it also behaves the same:

-
Sure
PHP shell + pfSense tools (pick this from the list)
then type
playback resetwebgui
Hit enter
this should restore to defaults just the web gui (it's not the crazy factory reset suggested online everywhere... Just reverts to defaults the gui)I sincerely hope it helps
-
@obamium
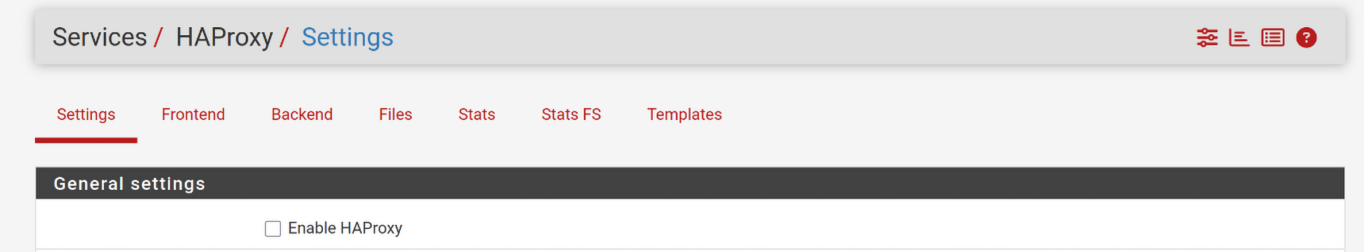
Disable HAProxy and check again. This looks like a configuration error—maybe after changing the interface names, you now have the LAN interface configured in HAProxy instead of the WAN, or something similar. Try testing without it. -
-
I just upgraded from 2.7.2 to 2.8.0 and everything worked fine.
After the first boot I enabled the new if_pppoe driver and after the reboot I faced this issue, I couldn't even login.
I tried then to reboot PHP-FPM from ssh, and I was able to log in and reach the dashboard without any issue.
Now it has been 10 minutes and the Web UI still works, but I'm a bit scared to reboot again.
I have a Topton Intel N100 CPU with 8GB of RAM. -
@gguglielmi said in WebGUI crashes with 50x when opening dashboard:
I tried then to reboot PHP-FPM from ssh
Next time you have the SSH open, have a look at menu option 15.
Have a look at what it can offer you.
The last 100 saved configs are there, so if needed, you could go back 'in time' and have the GUI work again so you can solve the issue.@obamium said in WebGUI crashes with 50x when opening dashboard:
I increased the memory to 512M for php-fpm and restarted
Mine is already 512 Mbytes, - I use a 4100 with 4 (I guess ) Mbytes RAM.
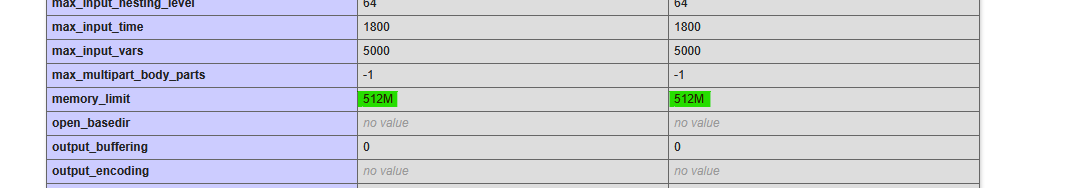
Your system, as it has 32 Gb available, should already be using 512 Mbytes, or even more, by default.
You could give it 1gbytes or so .... but I'm not sure if PHP will be any faster.How did you change that PHP memory usage setting ?
Btw : PHP - by nature very slow as it is a interprets language, using 512 Mbytes, that's already a lot.
The dashboard has to collect a lot of info to show, and the more widgets you activate, the slower it gets. Some widgets like showing the last "10k logged firewall rules" will really "kill" the dashboard. PHP will time out while parsing the huge log file, and the web server will cut the conversation with the browser short with a "503 : Nice try, come back tomorrow" -
I ran another test:
I reconfigured the LAN and WAN interfaces to use the RJ45 ports again (igc0, igc1), unplugged both SFP+ modules, and connected only the LAN back via RJ45. The dashboard page then loaded without any issues.After that, I reconnected the SFP+ module that was used for the WAN interface, reconfigured the WAN to use it again, and the dashboard stopped working once more.
Now I'm not sure if this is really relate to PHP-FPM
-
@obamium
First of all, I would check the system log. There are probably some other errors there as well. -
@w0w
I used tail -f /var/log/system.log after restarting php-fpmMay 30 11:23:32 Obamium-fw rc.php-fpm_restart[87304]: >>> Restarting php-fpm May 30 11:23:32 Obamium-fw check_reload_status[88770]: check_reload_status is starting. May 30 11:26:47 Obamium-fw nginx: 2025/05/30 11:26:47 [error] 81351#100414: *675 upstream timed out (60: Operation timed out) while reading response header from upstream, client: 192.168.1.251, server: , request: "POST /widgets/widgets/interfaces.widget.php HTTP/2.0", upstream: "fastcgi://unix:/var/run/php-fpm.socket", host: "192.168.1.1", referrer: "https://192.168.1.1/" May 30 11:26:53 Obamium-fw nginx: 2025/05/30 11:26:53 [error] 81351#100414: *675 upstream timed out (60: Operation timed out) while reading response header from upstream, client: 192.168.1.251, server: , request: "GET / HTTP/2.0", upstream: "fastcgi://unix:/var/run/php-fpm.socket", host: "192.168.1.1", referrer: "https://192.168.1.1/status_logs.php" May 30 11:27:02 Obamium-fw nginx: 2025/05/30 11:27:02 [error] 81351#100414: *675 upstream timed out (60: Operation timed out) while reading response header from upstream, client: 192.168.1.251, server: , request: "POST /widgets/widgets/interfaces.widget.php HTTP/2.0", upstream: "fastcgi://unix:/var/run/php-fpm.socket", host: "192.168.1.1", referrer: "https://192.168.1.1/" May 30 11:27:18 Obamium-fw nginx: 2025/05/30 11:27:18 [error] 81351#100414: *675 upstream timed out (60: Operation timed out) while reading response header from upstream, client: 192.168.1.251, server: , request: "POST /widgets/widgets/interfaces.widget.php HTTP/2.0", upstream: "fastcgi://unix:/var/run/php-fpm.socket", host: "192.168.1.1", referrer: "https://192.168.1.1/" May 30 11:27:33 Obamium-fw nginx: 2025/05/30 11:27:33 [error] 81351#100414: *675 upstream timed out (60: Operation timed out) while reading response header from upstream, client: 192.168.1.251, server: , request: "POST /widgets/widgets/interfaces.widget.php HTTP/2.0", upstream: "fastcgi://unix:/var/run/php-fpm.socket", host: "192.168.1.1", referrer: "https://192.168.1.1/" May 30 11:27:49 Obamium-fw nginx: 2025/05/30 11:27:49 [error] 81351#100414: *675 upstream timed out (60: Operation timed out) while reading response header from upstream, client: 192.168.1.251, server: , request: "POST /widgets/widgets/interfaces.widget.php HTTP/2.0", upstream: "fastcgi://unix:/var/run/php-fpm.socket", host: "192.168.1.1", referrer: "https://192.168.1.1/" May 30 11:28:05 Obamium-fw nginx: 2025/05/30 11:28:05 [error] 81351#100414: *675 upstream timed out (60: Operation timed out) while reading response header from upstream, client: 192.168.1.251, server: , request: "POST /widgets/widgets/interfaces.widget.php HTTP/2.0", upstream: "fastcgi://unix:/var/run/php-fpm.socket", host: "192.168.1.1", referrer: "https://192.168.1.1/" May 30 11:28:20 Obamium-fw nginx: 2025/05/30 11:28:20 [error] 81351#100414: *675 upstream timed out (60: Operation timed out) while reading response header from upstream, client: 192.168.1.251, server: , request: "POST /widgets/widgets/interfaces.widget.php HTTP/2.0", upstream: "fastcgi://unix:/var/run/php-fpm.socket", host: "192.168.1.1", referrer: "https://192.168.1.1/" May 30 11:28:25 Obamium-fw nginx: 2025/05/30 11:28:25 [error] 81351#100414: *675 upstream timed out (60: Operation timed out) while reading response header from upstream, client: 192.168.1.251, server: , request: "POST /getstats.php HTTP/2.0", upstream: "fastcgi://unix:/var/run/php-fpm.socket", host: "192.168.1.1", referrer: "https://192.168.1.1/" May 30 11:28:30 Obamium-fw nginx: 2025/05/30 11:28:30 [error] 81351#100414: *675 upstream timed out (60: Operation timed out) while reading response header from upstream, client: 192.168.1.251, server: , request: "POST /getstats.php HTTP/2.0", upstream: "fastcgi://unix:/var/run/php-fpm.socket", host: "192.168.1.1", referrer: "https://192.168.1.1/" May 30 11:28:36 Obamium-fw nginx: 2025/05/30 11:28:36 [error] 81351#100414: *675 upstream timed out (60: Operation timed out) while reading response header from upstream, client: 192.168.1.251, server: , request: "POST /getstats.php HTTP/2.0", upstream: "fastcgi://unix:/var/run/php-fpm.socket", host: "192.168.1.1", referrer: "https://192.168.1.1/" May 30 11:28:36 Obamium-fw nginx: 2025/05/30 11:28:36 [error] 81351#100414: *675 upstream timed out (60: Operation timed out) while reading response header from upstream, client: 192.168.1.251, server: , request: "POST /widgets/widgets/interfaces.widget.php HTTP/2.0", upstream: "fastcgi://unix:/var/run/php-fpm.socket", host: "192.168.1.1", referrer: "https://192.168.1.1/"Or do you mean another file?
And are there logs from php-fpm that I can maybe look at? If so, where can I find them?