The system became unresponsive
-
@yon-0 and nothing in the VMs log on Proxmox? All other VMs on Proxmox ran/run without issues?
Btw: how have you set up the VM in Proxmox, which hardware type, NICs etc?
pfSense got a guide for Proxmox:
https://docs.netgate.com/pfsense/en/latest/recipes/virtualize-proxmox-ve.html -
Did you resolve this?
Not much we can do without more info though?
-
-
@patient0 said in The system became unresponsive:
All other VMs on Proxmox ran/run without issues?
Only pfSense was installed; no other software was installed for PVE.
When the pfSense system crashes, PVE operations are unresponsive, and restarting is ineffective. Only a forced power-off can restart pfSense.You can upgrade to the new version today.
-
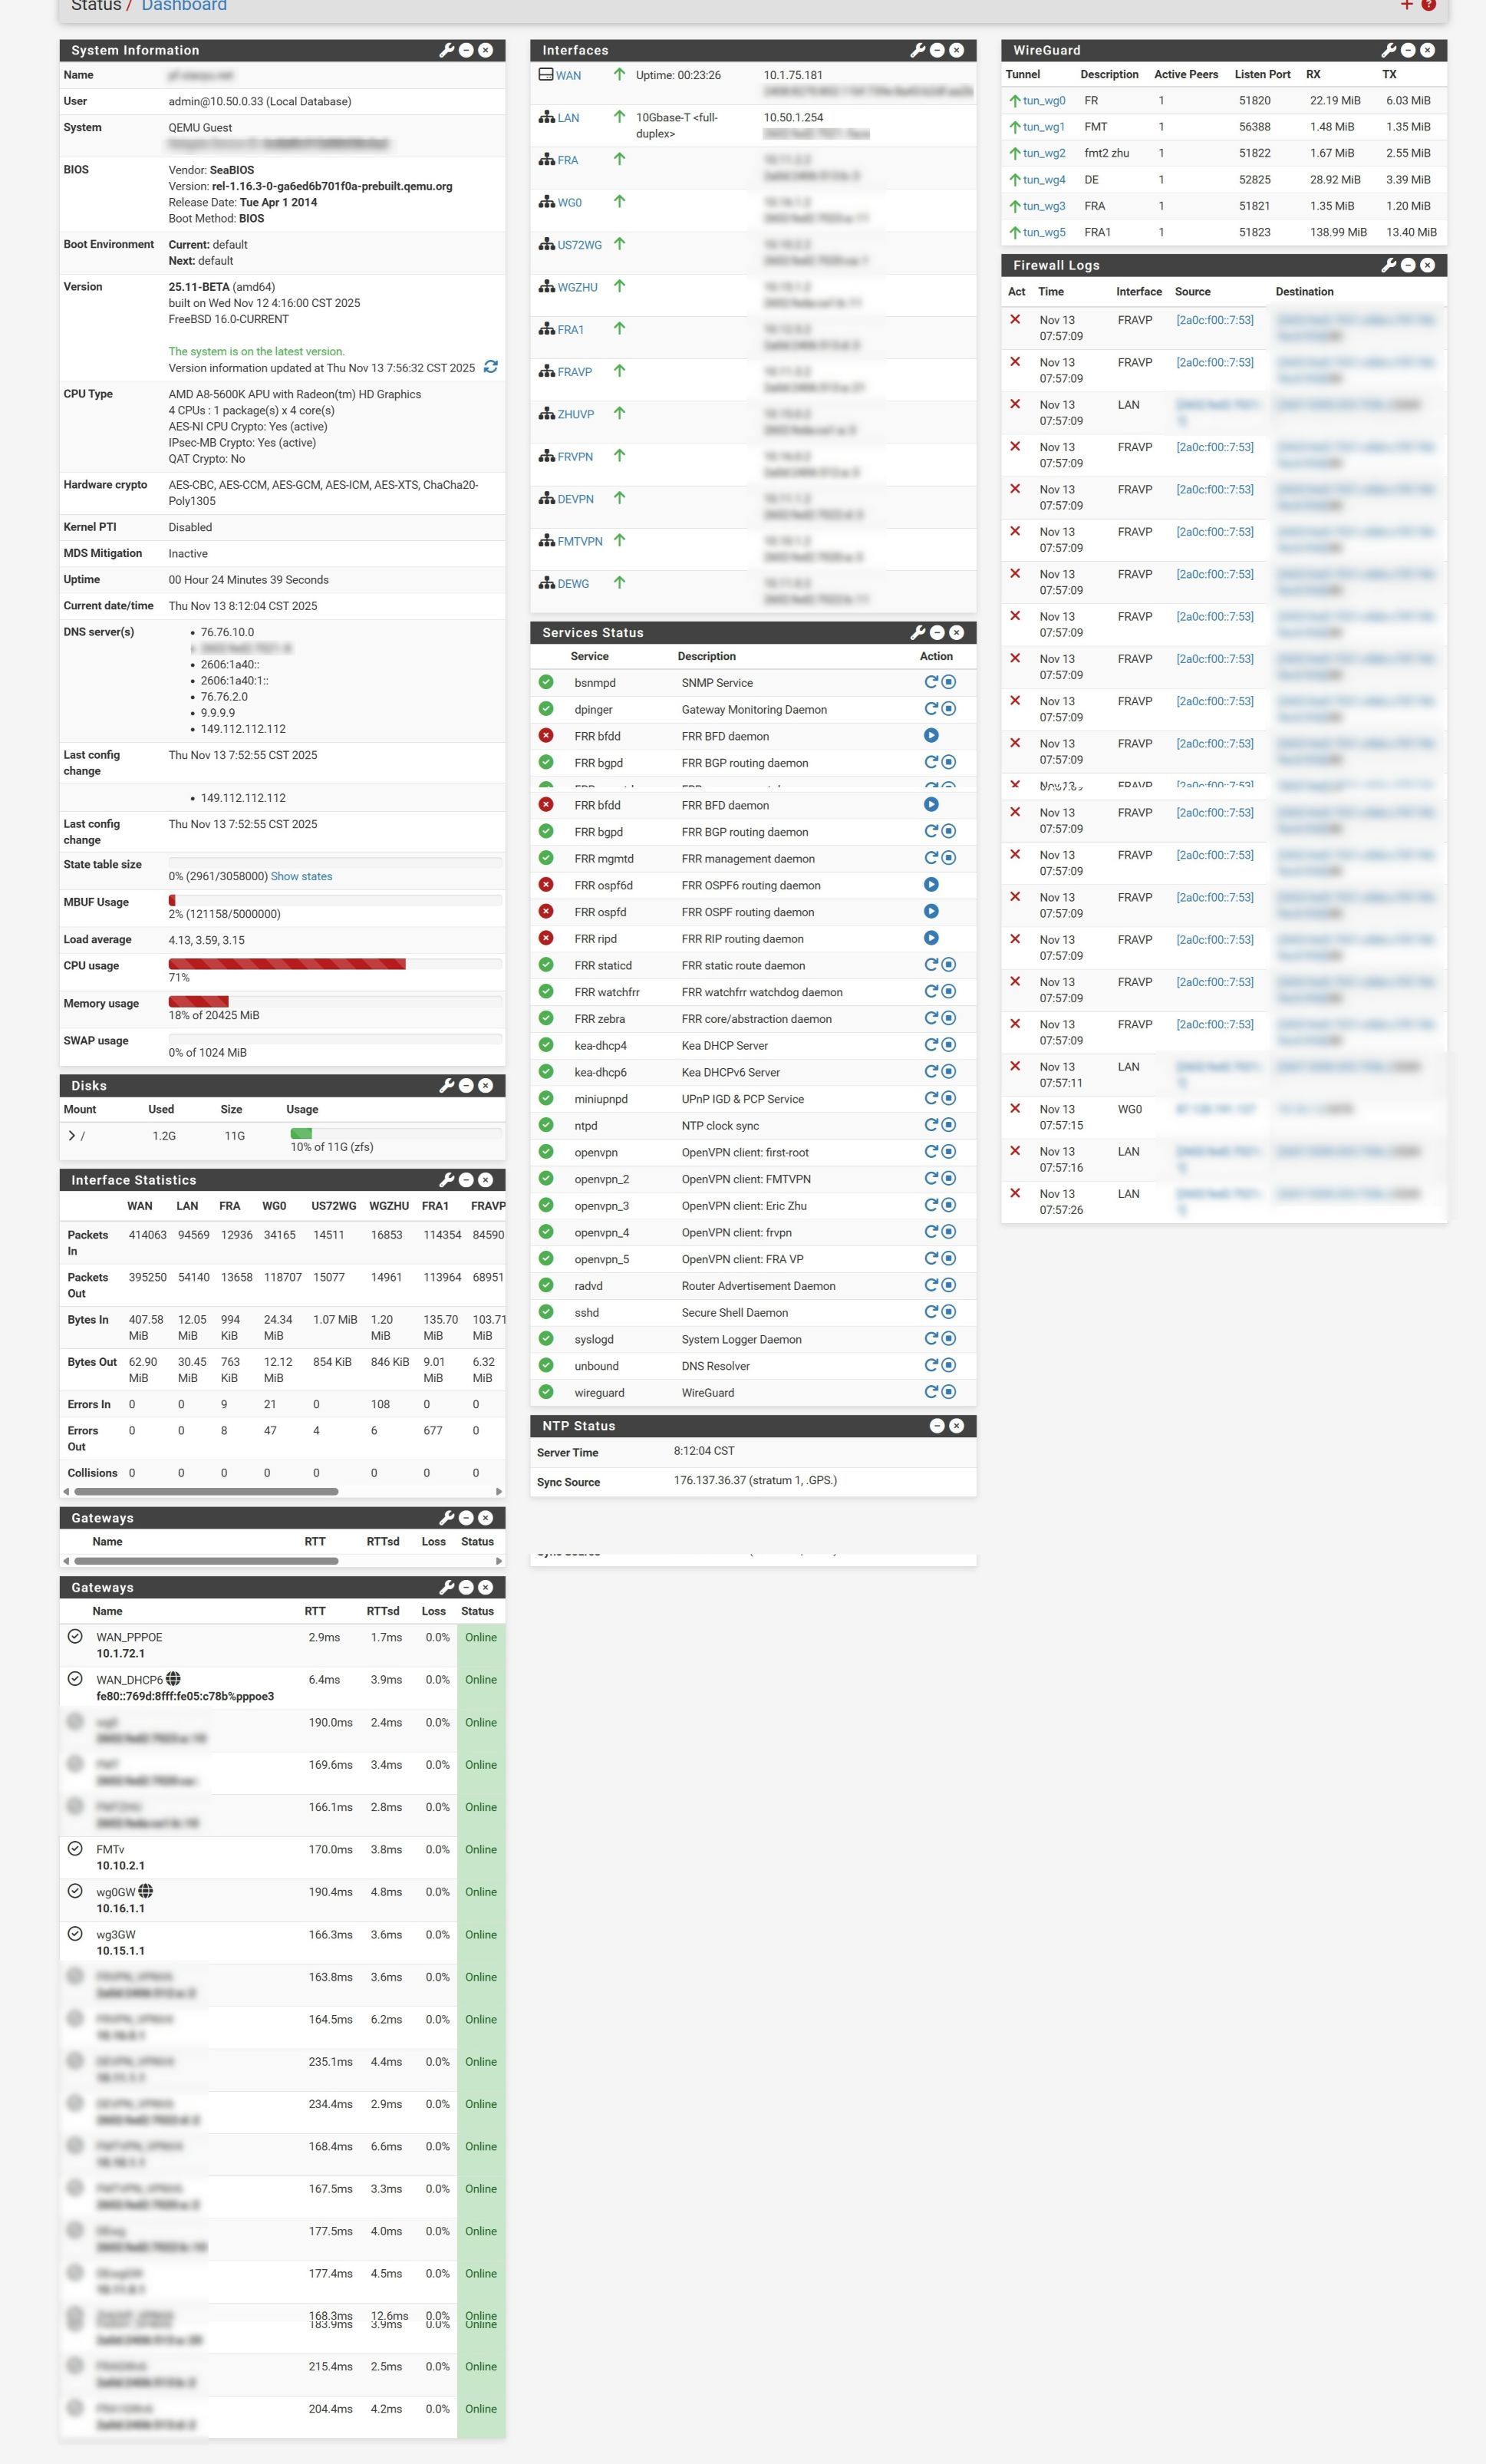
Hmm, well the only thing that jumps out there is the system loading which seems high. What's using CPU cycles there?
-
When FRR was reinstalled, the kern.ipc.maxsockbuf value was set too low, causing all systems to crash.
-
@stephenw10 said in The system became unresponsive:
Hmm, well the only thing that jumps out there is the system loading which seems high. What's using CPU cycles there?
The FRR version is too old and has many problems. FRR recommends abandoning older versions because FRR V10 resolved some of the high resource consumption issues.
last pid: 99613; load averages: 2.78, 3.37, 3.27 up 0+00:42:30 08:29:55 99 processes: 2 running, 97 sleeping CPU: 35.8% user, 0.0% nice, 16.3% system, 0.8% interrupt, 47.1% idle Mem: 2788M Active, 772M Inact, 960M Wired, 15G Free ARC: 174M Total, 57M MFU, 111M MRU, 431K Anon, 1104K Header, 4041K Other 129M Compressed, 318M Uncompressed, 2.46:1 Ratio Swap: 1024M Total, 1024M Free PID USERNAME THR PRI NICE SIZE RES STATE C TIME WCPU COMMAND 40297 root 4 140 0 3021M 2717M CPU0 0 72:15 197.03% bgpd 95234 root 8 0 0 248M 163M select 3 5:31 1.89% zebra 75732 root 1 0 0 23M 11M select 2 0:37 1.33% openvpn 23048 root 1 0 0 14M 3368K select 3 1:01 0.70% miniupnpd 59417 root 1 0 0 23M 11M select 1 0:12 0.57% openvpn 62115 root 1 0 0 23M 11M select 0 0:16 0.49% openvpn 65201 root 1 0 0 26M 10M select 0 0:53 0.46% ntpd 90411 root 1 0 0 275M 234M select 1 0:35 0.36% bsnmpd 84042 root 1 0 0 23M 11M select 3 0:22 0.34% openvpn 82351 root 1 0 0 15M 4228K CPU2 2 0:00 0.17% top 69149 root 1 0 0 23M 11M select 3 0:06 0.15% openvpn 47836 root 1 3 0 95M 58M nanslp 0 0:02 0.08% php_wg 69968 root 1 0 0 14M 2896K select 3 0:00 0.07% radvd 90419 root 5 59 0 15M 3188K uwait 0 0:01 0.04% dpinger 91419 root 5 59 0 15M 3140K uwait 0 0:01 0.04% dpinger 98760 root 5 59 0 15M 3144K uwait 3 0:01 0.04% dpinger 94593 root 5 59 0 15M 3140K uwait 0 0:01 0.03% dpinger 98495 root 5 59 0 15M 3136K uwait 0 0:01 0.03% dpinger 95840 root 5 59 0 15M 3136K uwait 2 0:01 0.03% dpinger 95135 root 5 59 0 15M 3140K uwait 1 0:01 0.03% dpinger 92658 root 5 59 0 15M 3136K uwait 0 0:01 0.03% dpinger 95570 root 5 59 0 15M 3140K uwait 0 0:01 0.03% dpinger 96991 root 5 59 0 15M 3132K uwait 0 0:01 0.03% dpinger 94142 root 5 59 0 15M 3132K uwait 0 0:01 0.03% dpinger 93298 root 5 59 0 15M 3132K uwait 2 0:01 0.03% dpinger 93020 root 5 59 0 15M 3140K uwait 1 0:01 0.03% dpinger 91121 root 5 59 0 15M 3140K uwait 1 0:01 0.03% dpinger 97290 root 5 59 0 15M 3140K uwait 3 0:01 0.03% dpinger 97613 root 5 59 0 15M 3136K uwait 0 0:01 0.03% dpinger 96149 root 5 59 0 15M 3144K uwait 0 0:01 0.03% dpinger 93805 root 5 59 0 15M 3128K uwait 3 0:01 0.03% dpinger 91997 root 5 59 0 15M 3140K uwait 2 0:01 0.03% dpinger 14307 root 1 0 0 25M 9392K select 1 0:00 0.02% staticd 97904 root 5 59 0 15M 3136K uwait 2 0:01 0.02% dpinger 58643 root 1 0 0 25M 8312K select 1 0:00 0.02% watchfrr 90222 root 5 59 0 15M 3132K uwait 1 0:01 0.02% dpinger 57463 root 1 0 0 25M 12M select 1 0:00 0.02% sshd-session 96719 root 5 59 0 15M 3144K uwait 3 0:01 0.02% dpinger 90755 root 5 59 0 15M 3144K uwait 0 0:01 0.02% dpinger 50342 root 9 0 0 50M 25M select 1 0:01 0.02% kea-dhcp4 92173 root 5 59 0 15M 3144K uwait 1 0:01 0.01% dpinger 15701 root 1 0 0 14M 3500K kqread 1 0:00 0.01% syslogd 51313 root 9 0 0 46M 24M select 3 0:00 0.01% kea-dhcp6 16435 root 1 0 0 14M 2892K kqread 3 0:01 0.01% tail 659 root 1 0 0 125M 37M kqread 2 0:00 0.01% php-fpm 20802 root 1 0 0 14M 2880K select 1 0:00 0.01% tail 55659 root 1 0 0 15M 3896K bpf 1 0:00 0.00% filterlog -
@stephenw10 said in The system became unresponsive:
Hmm, well the only thing that jumps out there is the system loading which seems high. What's using CPU cycles there?
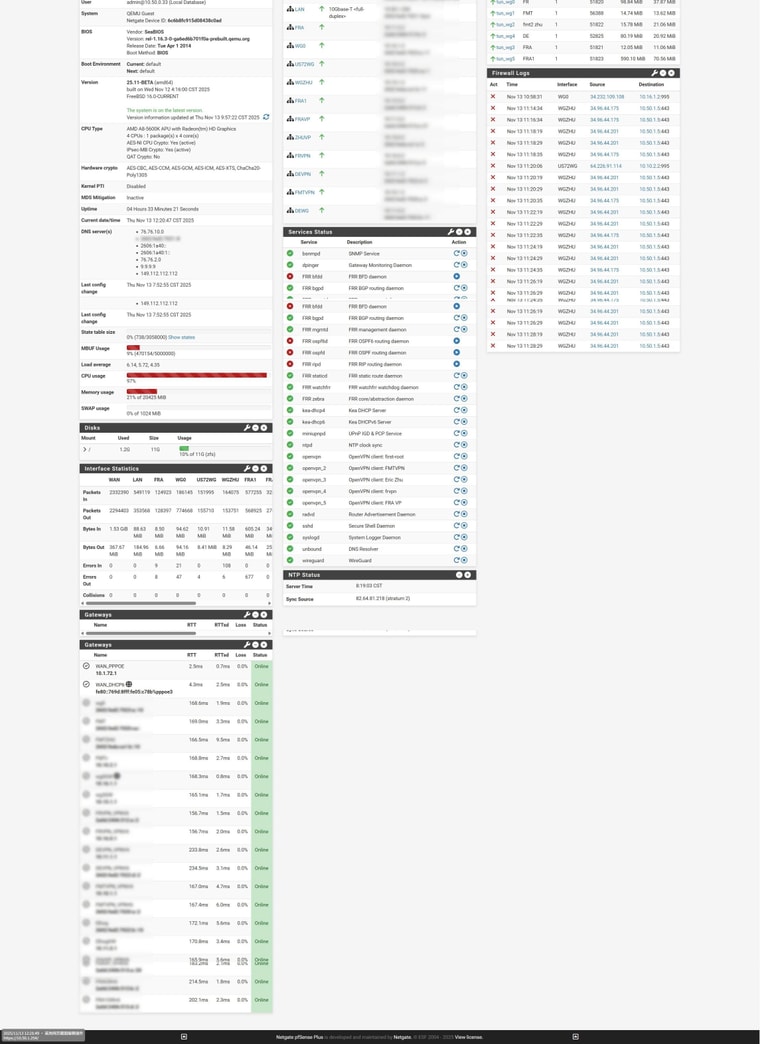
Because pfSense version 25.07.1 kept the CPU usage at 100%, making the system unusable, I upgraded to version 25.11, which at least made things a little better.
-
I have now set kern.ipc.maxsockbuf=4831838208 for the system to run. The default value for FRR is too small.
-
Hmm, is there a specific bug in FRR you're referring to?
-
@stephenw10 said in The system became unresponsive:
Hmm, is there a specific bug in FRR you're referring to?
I believe it is related to FRR. PFsense's design did not match the actual use of FRR.
It is common for some IPv6 sessions to fail to establish a normal connection or to disconnect after running for a period of time, requiring a restart of FRR to restore functionality.
-
-
IPv6 Unicast Summary (VRF default):
BGP router identifier 10.50.1.254, local AS number 65105 vrf-id 0
Read-only mode update-delay limit: 30 seconds
  First neighbor established: 2025/11/13 12:13:58.682
          Best-paths resumed: 2025/11/13 12:14:28.791
        zebra update resumed: 2025/11/13 12:14:31.610
        peers update resumed: 2025/11/13 12:14:43.940
BGP table version 848715
RIB entries 443446, using 41 MiB of memory
Peers 11, using 144 KiB of memory

Neighbor             V         AS   MsgRcvd   MsgSent   TblVer  InQ OutQ  Up/Down State/PfxRcd   PfxSnt Desc
2602:fed:70:a::2  4      39753     64477        25   848715    0    0 00:21:06       226782        7
2602:fed:70:ca::  4      39753     64964        27   848715    0    0 00:22:56       226782        7
2602:fed:70:b::10 4      39753    137154        17   848715    0    0 00:23:02       430595        7
2602:fed:70:d::2  4      39753    137160        27   848715    0    0 00:23:02       430601        7
2602:fed:70:a::10 4      39753     62506        26   848715    0    0 00:22:55       464179        7
2602:fed:ca1:a::2   4      39753     56475        27   848715    0    0 00:23:00       221110        7
2602:fed:ca1:b::10  4      39753     56475        26   848715    0    0 00:22:52       221110        7
2a0d:24:512:a::2   4      39753     62506        26   848715    0    0 00:22:55       464179        7          fr bgp VP
2a0d:24:513:a::20  4      39753   1122273        27   848715    0    0 00:23:02      2361741        7       FRAVP
2a0d:24:513:b::2   4      39753    726320        27   848715    0    0 00:23:02      2361741        7
2a0d:24:513:d::2   4      39753    726326        27   848715    0    0 00:23:02      2361741        7         FRA1 WG

Total number of neighbors 11