Memory consumption
-
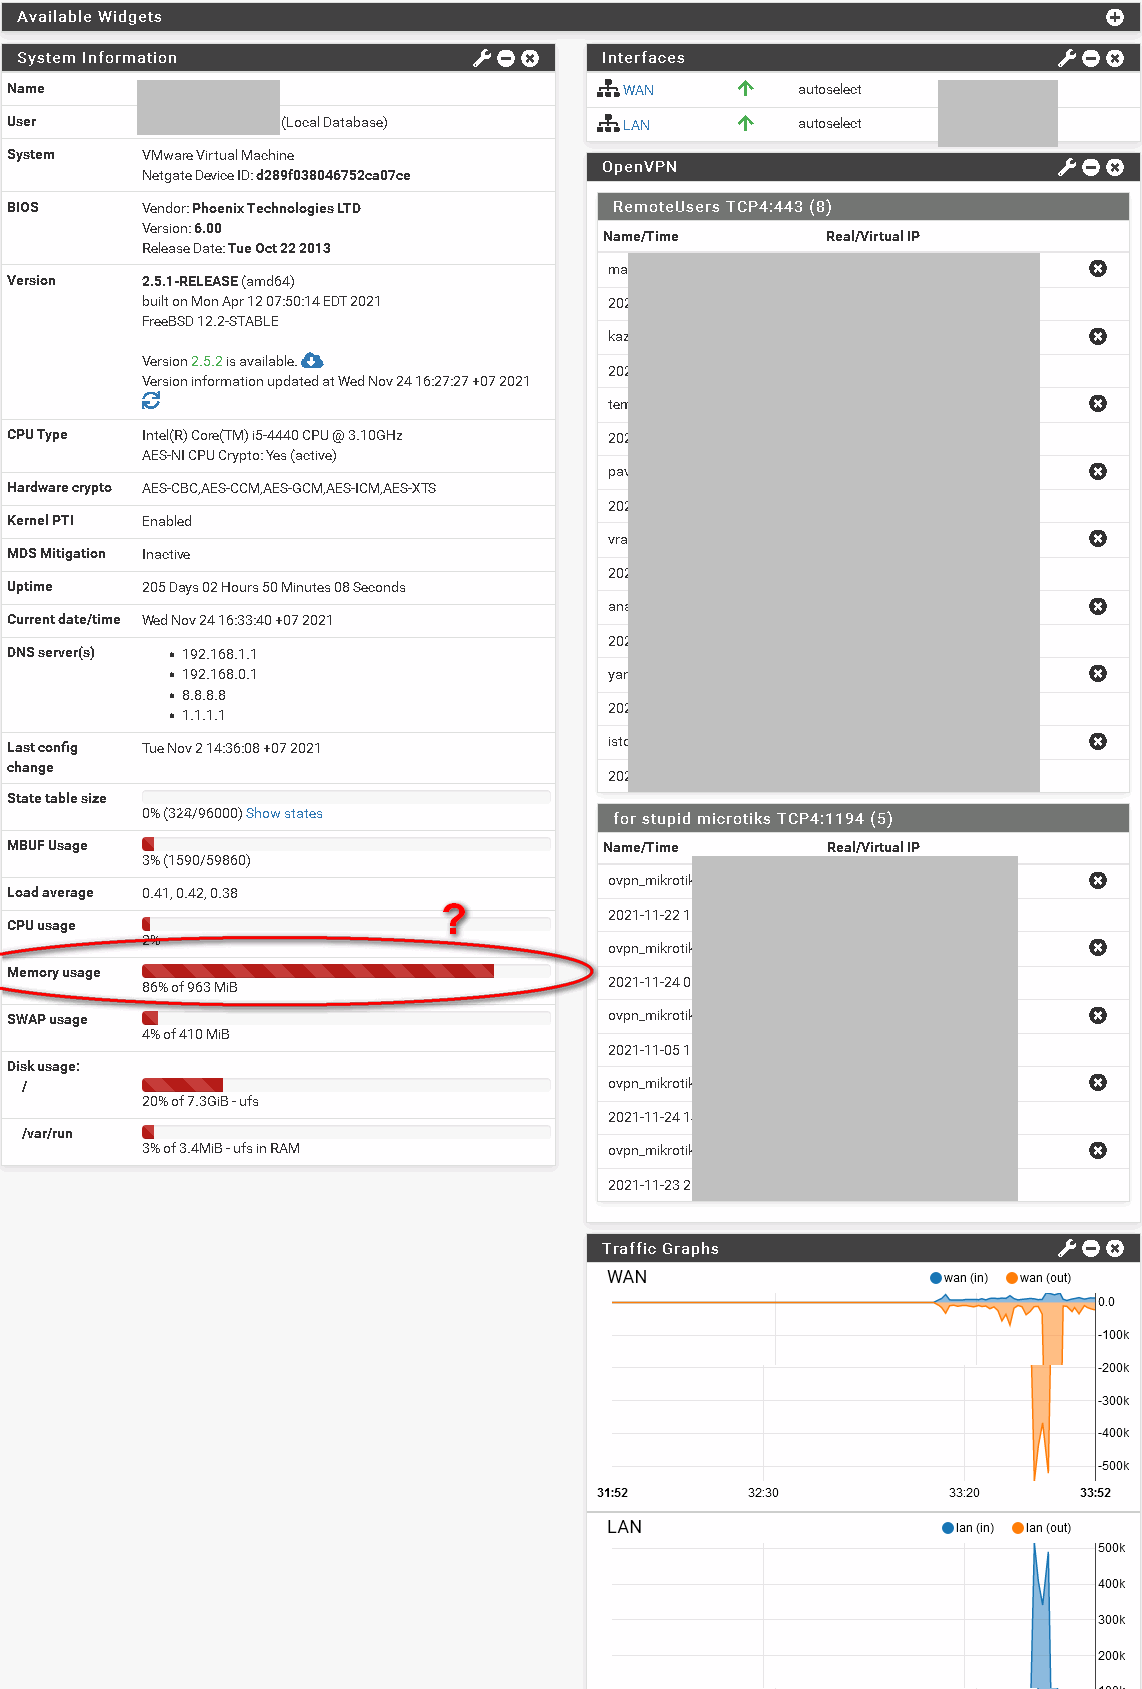
Got pfsense 2.5.1 on VmWare esxi5.1 vm just to terminate several ovpns from mikrotik routers and road warriors.
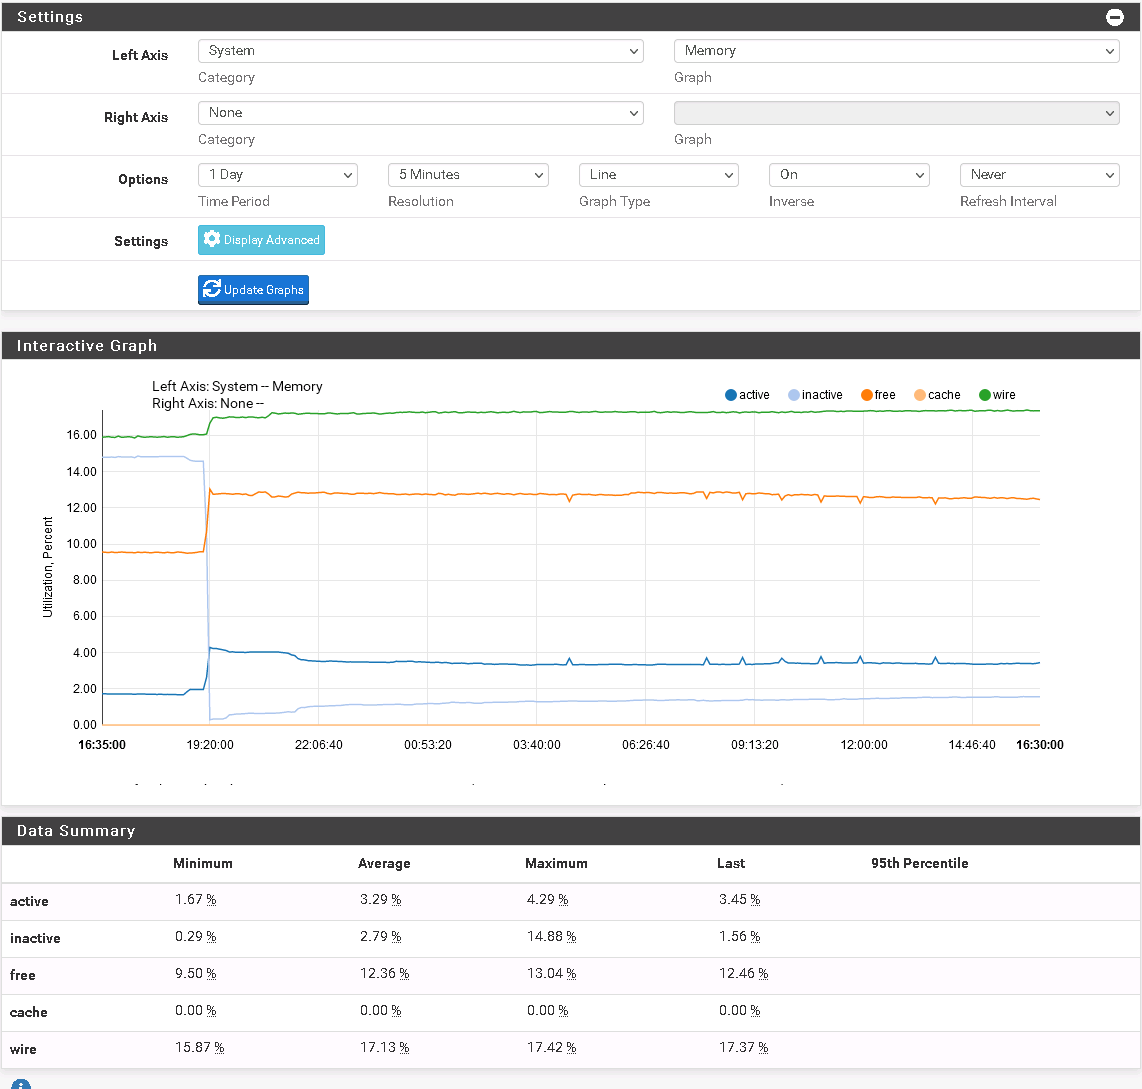
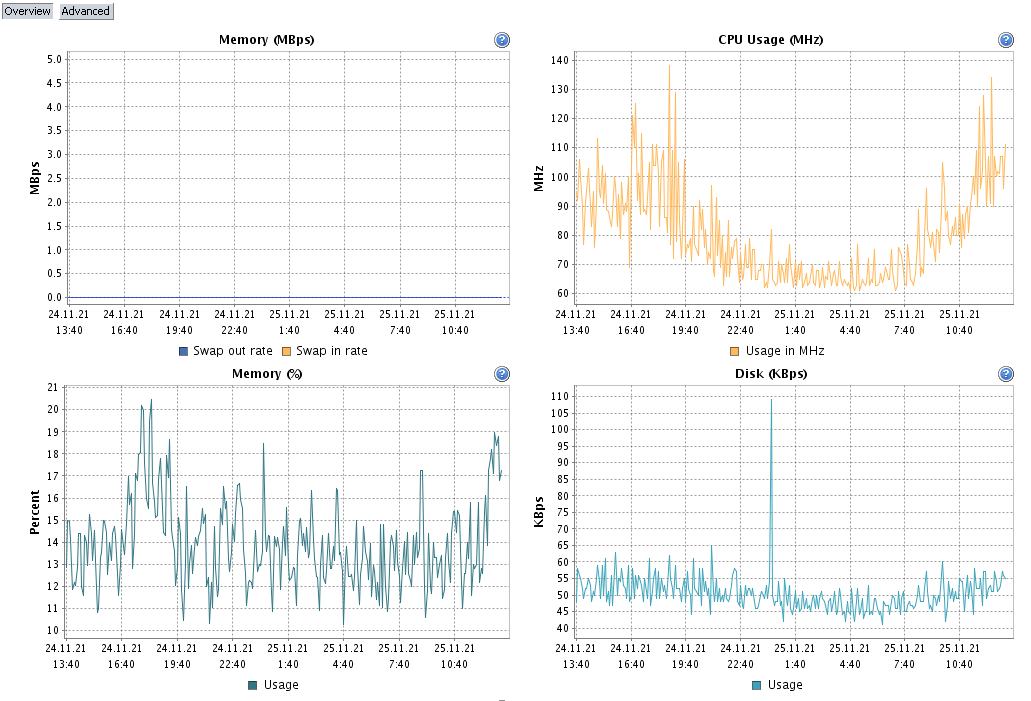
Dashboard shows memory used 86%, but Status Monitoring shows ~16%. VSphere via vmware tools shows ~15% up to 20% peak.Why so strange readings on dashboard?
-
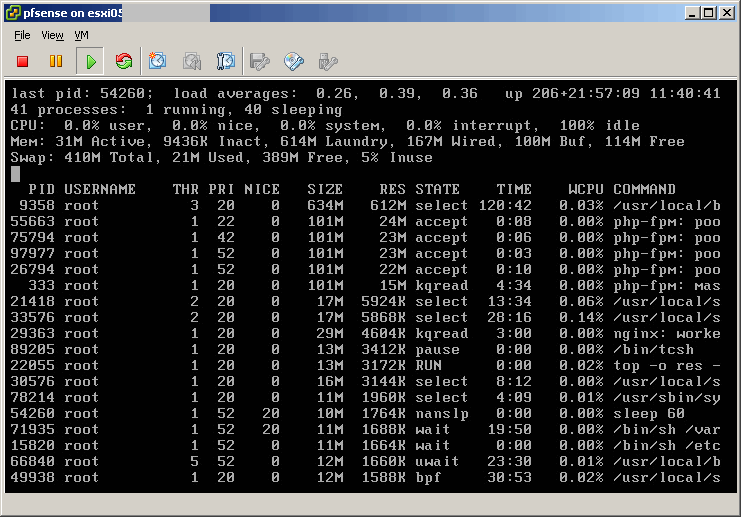
Look at Diag > System Activity, or run it at the console:
top -aSH.What is using that?
Does it go back to something expected if you reboot the VM?
Steve
-
@pukoid
maybe the pcscd service, search in the forum. -
Yup, if it's increased use over time (leaking) it's probably that.
See: https://redmine.pfsense.org/issues/11933#note-7Steve
-
No, it's not pcscd. Stopping it in services changes nothing.
Looks like Dashboard takes in accouunt "Laundry" memory, but Monitoring is not.
Looks like it's vmvare tools.
last pid: 74856;  load averages:  0.30,  0.43,  0.38                                                                                                                                                                 up 206+22:10:07 11:53:39
165 threads:   2 running, 116 sleeping, 47 waiting
CPU:  0.8% user,  0.0% nice,  0.8% system,  0.0% interrupt, 98.4% idle
Mem: 38M Active, 14M Inact, 614M Laundry, 169M Wired, 101M Buf, 101M Free
Swap: 410M Total, 20M Used, 389M Free, 4% Inuse

  PID USERNAME    PRI NICE   SIZE    RES STATE    TIME    WCPU COMMAND
   11 root        155 ki31     0B    16K RUN    4932.1  98.64% [idle]
75794 root         21    0   101M    24M accept   0:07   0.26% php-fpm: pool nginx (php-fpm)
21418 root         20    0    17M  5936K select  13:35   0.15% /usr/local/sbin/openvpn --config /var/etc/openvpn/server1/config.ovpn{openvpn}
    0 root        -76    -     0B   384K -      179:34   0.15% [kernel{if_io_tqg_0}]
33576 root         20    0    17M  5880K select  28:17   0.08% /usr/local/sbin/openvpn --config /var/etc/openvpn/server3/config.ovpn{openvpn}
73896 root         20    0    13M  3428K RUN      0:00   0.06% top -aSH
29363 root         20    0    28M  4556K kqread   3:00   0.03% nginx: worker process (nginx)
 9358 root         20    0   634M   612M select 116:32   0.03% /usr/local/bin/vmtoolsd -c /usr/local/share/vmware-tools/tools.conf -p /usr/local/lib/open-vm-tools/plugins/vmsvc{vmtoolsd}
   12 root        -60    -     0B   752K WAIT    73:34   0.02% [intr{swi4: clock (0)}]
    9 root        -16    -     0B    16K -       33:22   0.01% [rand_harvestq]
78214 root         20    0    11M  1960K select   4:10   0.01% /usr/sbin/syslogd -s -c -c -l /var/dhcpd/var/run/log -P /var/run/syslog.pid -f /etc/syslog.conf -b 192.168.3.2
49938 root         20    0    12M  1588K bpf     30:53   0.01% /usr/local/sbin/filterlog -i pflog0 -p /var/run/filterlog.pid
    8 root        -16    -     0B    16K pftm    38:45   0.01% [pf purge]
46675 root         20    0    20M  8380K select   0:00   0.01% sshd: admin@pts/0 (sshd)
   16 root        -16    -     0B    48K psleep   8:35   0.01% [pagedaemon{dom0}]
66365 root         20    0    12M  1532K nanslp  16:13   0.01% /usr/local/bin/dpinger -S -r 0 -i gw_214 -B 81.1.214.195 -p /var/run/dpinger_gw_214~81.1.214.195~81.1.214.193.pid -u /var/run/dpinger_gw_214~81.1.214.195~81.1.214.193.sock -C
   12 root        -88    -     0B   752K WAIT     9:36   0.00% [intr{irq15: ata1}]
66840 root         20    0    12M  1660K nanslp  16:25   0.00% /usr/local/bin/dpinger -S -r 0 -i gw_subnet13 -B 192.168.3.2 -p /var/run/dpinger_gw_subnet13~192.168.3.2~192.168.3.1.pid -u /var/run/dpinger_gw_subnet13~192.168.3.2~192.168.3
  488 root         20    0    10M   544K select   5:46   0.00% /sbin/devd -q -f /etc/pfSense-devd.conf
30576 root         20    0    16M  3144K select   8:12   0.00% /usr/local/sbin/ntpd -g -c /var/etc/ntpd.conf -p /var/run/ntpd.pid{ntpd}
   18 root        -16    -     0B    48K qsleep   5:20   0.00% [bufdaemon{bufdaemon}]
  333 root         20    0   101M    15M kqread   4:34   0.00% php-fpm: master process (/usr/local/lib/php-fpm.conf) (php-fpm)
66365 root         20    0    12M  1532K sbwait   4:27   0.00% /usr/local/bin/dpinger -S -r 0 -i gw_214 -B 81.1.214.195 -p /var/run/dpinger_gw_214~81.1.214.195~81.1.214.193.pid -u /var/run/dpinger_gw_214~81.1.214.195~81.1.214.193.sock -C
66840 root         20    0    12M  1660K sbwait   4:26   0.00% /usr/local/bin/dpinger -S -r 0 -i gw_subnet13 -B 192.168.3.2 -p /var/run/dpinger_gw_subnet13~192.168.3.2~192.168.3.1.pid -u /var/run/dpinger_gw_subnet13~192.168.3.2~192.168.3
 9358 root         20    0   634M   612M uwait    4:11   0.00% /usr/local/bin/vmtoolsd -c /usr/local/share/vmware-tools/tools.conf -p /usr/local/lib/open-vm-tools/plugins/vmsvc{HangDetector}
66840 root         20    0    12M  1660K nanslp   2:32   0.00% /usr/local/bin/dpinger -S -r 0 -i gw_subnet13 -B 192.168.3.2 -p /var/run/dpinger_gw_subnet13~192.168.3.2~192.168.3.1.pid -u /var/run/dpinger_gw_subnet13~192.168.3.2~192.168.3
66365 root         20    0    12M  1532K nanslp   2:33   0.00% /usr/local/bin/dpinger -S -r 0 -i gw_214 -B 81.1.214.195 -p /var/run/dpinger_gw_214~81.1.214.195~81.1.214.193.pid -u /var/run/dpinger_gw_214~81.1.214.195~81.1.214.193.sock -C
    4 root        -16    -     0B    32K -        3:22   0.00% [cam{doneq0}]
    0 root        -76    -     0B   384K -        0:08   0.00% [kernel{softirq_0}]
   18 root         20    -     0B    48K sdflus   2:55   0.00% [bufdaemon{/ worker}]
    0 root        -16    -     0B   384K swapin   0:16   0.00% [kernel{swapper}]
   20 root         16    -     0B    16K syncer   9:22   0.00% [syncer]
   25 root        -16    -     0B    16K -        0:01   0.00% [soaiod4]
   19 root        -16    -     0B    16K vlruwt   0:34   0.00% [vnlru]
   18 root         20    -     0B    48K -        0:30   0.00% [bufdaemon{bufspacedaemon-0}]
   16 root        -16    -     0B    48K umarcl   0:28   0.00% [pagedaemon{uma}]
    0 root          8    -     0B   384K -        0:07   0.00% [kernel{thread taskq}]
   22 root        -16    -     0B    16K -        0:01   0.00% [soaiod1]
   23 root        -16    -     0B    16K -        0:01   0.00% [soaiod2]
   24 root        -16    -     0B    16K -        0:01   0.00% [soaiod3]
71935 root         52   20    11M  1688K wait    19:50   0.00% /bin/sh /var/db/rrd/updaterrd.sh
29817 root         20    0    11M   860K nanslp   1:19   0.00% /usr/sbin/cron -s
   12 root        -88    -     0B   752K WAIT     1:17   0.00% [intr{irq17: mpt0}]
26794 root         52    0   102M    26M accept   0:11   0.00% php-fpm: pool nginx (php-fpm){php-fpm}
55663 root         52    0   101M    24M accept   0:09   0.00% php-fpm: pool nginx (php-fpm)
66365 root         20    0    12M  1532K accept   0:07   0.00% /usr/local/bin/dpinger -S -r 0 -i gw_214 -B 81.1.214.195 -p /var/run/dpinger_gw_214~81.1.214.195~81.1.214.193.pid -u /var/run/dpinger_gw_214~81.1.214.195~81.1.214.193.sock -C
66840 root         20    0    12M  1660K accept   0:07   0.00% /usr/local/bin/dpinger -S -r 0 -i gw_subnet13 -B 192.168.3.2 -p /var/run/dpinger_gw_subnet13~192.168.3.2~192.168.3.1.pid -u /var/run/dpinger_gw_subnet13~192.168.3.2~192.168.3
   65 root         -8    -     0B    16K mdwait   0:05   0.00% [md0]
    4 root        -16    -     0B    32K -        0:05   0.00% [cam{scanner}]
89025 root         20    0    10M   292K nanslp   0:04   0.00% minicron: helper /usr/local/bin/ping_hosts.sh  (minicron)
97977 root         52    0   101M    23M accept   0:03   0.00% php-fpm: pool nginx (php-fpm)
   12 root        -72    -     0B   752K WAIT     0:01   0.00% [intr{swi1: netisr 0}]
    1 root         20    0  9548K   216K wait     0:00   0.00% [init]
89547 root         20    0    10M   292K nanslp   0:00   0.00% minicron: helper /usr/local/sbin/fcgicli -f /etc/rc.expireaccounts  (minicron)
21418 root         20    0    17M  5936K kqread   0:00   0.00% /usr/local/sbin/openvpn --config /var/etc/openvpn/server1/config.ovpn{openvpn}
   12 root        -84    -     0B   752K WAIT     0:00   0.00% [intr{irq1: atkbd0}]
  372 root         40   20    11M  1216K kqread   0:00   0.00% /usr/local/sbin/check_reload_status
 9358 root         20    0   634M   612M uwait    0:00   0.00% /usr/local/bin/vmtoolsd -c /usr/local/share/vmware-tools/tools.conf -p /usr/local/lib/open-vm-tools/plugins/vmsvc{pool-spawner}
9358 root 20 0 634M 612M select 116:32 0.03% /usr/local/bin/vmtoolsd -c /usr/local/share/vmware-tools/tools.conf -p /usr/local/lib/open-vm-tools/plugins/vmsvc{vmtoolsd} -
@pukoid said in Memory consumption:
No, it's not pcscd. Stopping it in services changes nothing.
Maybe I'm wrong, but in my case it need 30-60 secondes after stop the service...
Edit:
See it after posting /usr/local/bin/vmtoolsd is your issue.