WAN general config set to DHCP, but always pulls same ipv4 address from Modem. ARP Table shows "Permanent" in Status column and I can't release it.
-
@johnpoz The thing is I just bought this 3 months ago... :( sad face
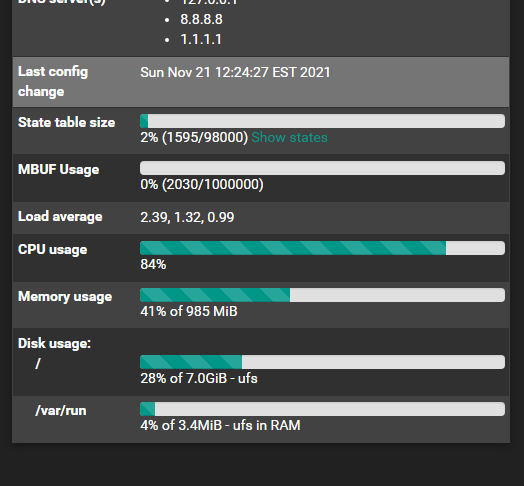
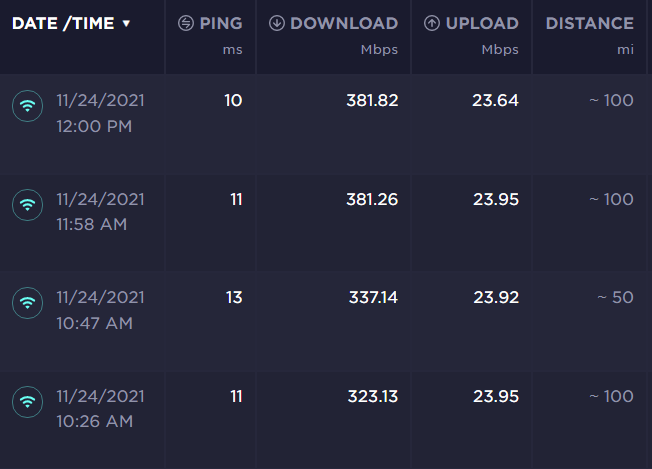
@stephenw10 Still seeing reduced speeds (see one testing method in screenshot below)

Took this snapshot while running the speedtest.net (screenshot)

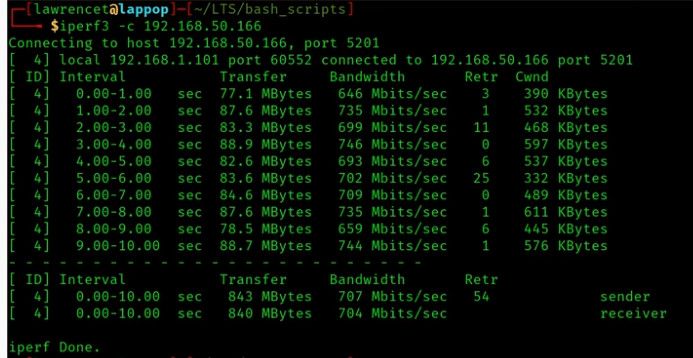
Also did as asked at the command line and I got this (screenshot)
I was watching a video from Lawrence Systems on YouTube "https://www.youtube.com/watch?v=_bM3XqK5JzE" and he was talking about the SG-1100 and reviewing it (2 Years ago mind you) and he got better speeds his setup was Laptop(LAN)>SG-1100 >Switch(Wan)>LinuxServer (for testing with iperf3) and he's getting avg. 700 (TCP) & 900+/- (UDP with about 24% packet loss)
But he said something in there and something kind of clicked in my head and I thought about my setup having the 3 ports WAN/LAN/OPT and then I added a VLAN. Would that in anyway disperse or spread out the "shared" data plane and therefore limit the data so that they can all maintain the 1Gig across the 3 ports not Labeled WAN (3 original + 1 VLAN). I know in my head that shouldn't be, I think, but just thought I would ask you all.My next thought is, since I don't have a server but I do have a Raspberry Pi with iperf3 on it that I put it directly (or hooked up to a switch) to the WAN port, assign it an IP and then my laptop to directly to LAN (nothing in between) and run iperf3 across to each other. Of course when I have time and no one needs the internet. What do you think?
-
Mmm, that top output can't be correct. Did you actually run it at the command line? In the gui via Diag > Command Prompt will not give useful output. You have to use the serial console or SSH.
You will see something like:
last pid: 39370;  load averages:  2.02,  1.14,  0.76                       up 0+12:13:50  01:09:42
136 threads:   5 running, 113 sleeping, 18 waiting
CPU:  7.8% user,  0.0% nice, 38.4% system, 45.7% interrupt,  8.0% idle
Mem: 42M Active, 45M Inact, 138M Wired, 68M Buf, 736M Free

  PID USERNAME    PRI NICE   SIZE    RES STATE    C   TIME    WCPU COMMAND
   12 root        -92    -     0B   304K CPU0     0   1:18  89.84% [intr{gic0,s42: mvneta0}]
29645 root          4    0    15M  5956K RUN      1   0:47  61.80% /usr/local/bin/iperf3 -s
   11 root        155 ki31     0B    32K RUN      1 712:51  12.02% [idle{idle: cpu1}]
   11 root        155 ki31     0B    32K RUN      0 714:59   4.57% [idle{idle: cpu0}]
  366 root         52    0   104M    36M accept   1   0:49   1.94% php-fpm: pool nginx (php-fpm){p
40872 root         20    0    13M  3528K CPU0     0   0:00   0.21% top -aSH
   12 root        -76    -     0B   304K WAIT     1   0:00   0.16% [intr{swi0: uart}]
   12 root        -60    -     0B   304K WAIT     1   0:53   0.15% [intr{swi4: clock (0)}]
10984 root         20    0    32M    21M nanslp   0   0:38   0.14% /usr/local/sbin/pcscd{pcscd}
88807 root         20    0    28M  8400K kqread   1   0:00   0.09% nginx: worker process (nginx)
    8 root        -16    -     0B    16K pftm     1   0:44   0.06% [pf purge]
    6 root        -16    -     0B    16K e6000s   1   0:19   0.04% [e6000sw tick kproc]
71943 root         20    0    18M  6020K select   0   0:06   0.04% /usr/local/sbin/ntpd -g -c /var
   21 root        -16    -     0B    48K psleep   1   0:04   0.03% [pagedaemon{dom0}]
44118 root         20    0    11M  2536K nanslp   0   0:11   0.02% /usr/local/bin/dpinger -S -r 0
    9 root        -16    -     0B    16K -        1   0:03   0.02% [rand_harvestq]
24544 root         20    0    11M  2564K select   1   0:01   0.02% /usr/sbin/syslogd -s -c -c -l /
What you're looking for is the idle percentage on both cores. In that example I'm running iperf on the SG-1100 directly so it's not a good test.
The single mvneta(4) NIC in the 1100 means it can only use core for traffic. Here the other one is used by iperf3.Having multiple interfaces with VLANs will only make any difference if they are also moving traffic at the same timer you are testing WAN to LAN.
Steve
-
@stephenw10 I captured this while doing a speedtest.net. Is this what you were referring to correct?

Thanks
-
Yes, exactly. You can hit 'q' whilst that's running to quite and freeze the readings. Makes it much easier to copy/paste out that way.
Ok so you can see one CPU core is down at 4.5% idle, there's not much more it can do with that load.
However you can also see ntopng is using 50% of one core total. That is probably reducing the throughput.Steve
-
@stephenw10 Looks like it was slowing me down by an average of 50Mbps (see screenshot below)

And I hit 'q' to grab this screenshot while doing one of the speedtest.net test again.
Can you tell me anymore "magical" things from this shot?
Thanks for everything, I'm actually learning a ton from all these investigations.
-
Mmm, not really. One CPU core is almost completely idle there, which is expected due to mvneta only using a single queue.
Potentially there is 15% more CPU cycles it could use but you would not see much of an increase.
~400Mbps is not unexpected to site across a 10ms connection.Steve
-
@stephenw10 Sorry it took so long to get back to you. Thanks again for helping me, but I have one more question concerning throughput and speeds.
Is there anything else I could try in order to get the speeds mentioned in the capabilities of this product, or at the very least maybe have netgate make me a deal and send this one back or something to go up one level to the 2100 or so, especially since I just bought this 1100 less than 3-4 months ago? And if you can't answer the last part of that question, would you be so kind to point me in the right direction of someone to contact?Thanks again!
-Dave -
@andykauffman23 and @stephenw10 I have a question..
If you look up sg1100 benchmarks there is a video from Lawrence Systems, that many people seem to enjoy and reference, etc.
Here he tests using iperf from lan to wan.. And is seeing in the 700mbps range.. So unless he turned off natting? and didn't mention that? There is something else going on here if you are only seeing 350ish..

Can you duplicate the test in this video by putting iperf server on your wan and client on your lan?
Also on your test your doing to speedtest are you doing test with the app or browser - I have seen odd stuff sometimes with browser.. I would duplicate your test using their actual app. Your green little icon there does show multistream test, vs orange that is single stream..
But I am trying to understand why a 3rd party test is more in line with what the netgate benchmarks claim and yours that are disappointing.
Also this thread
https://forum.netgate.com/topic/140100/sg-1100-throughput-testShow good results..
-
@andykauffman23 You can open a ticket with us here to discuss options:
https://go.netgate.comSteve
-
@johnpoz I have watched this video and even referenced it briefly above in a reply (I believe) but I am not to familiar with setting up something on the WAN side to act as an iperf3 server and access it via the LAN. (More research required I feel) If you have any suggestions on how to accomplish this and or maybe a video reference of the methods and setup I would definitely try that and report back here. Thanks
-
@stephenw10 Thanks sir, I will do that, but first I wanted to try a few more things to gather and capture data for reference, i.e. like trying the WAN>server (or something that will work since I don't have my own server setup) LAN>client iperf3 test (like in the video and the discussion post @johnpoz referenced.