snmp bug
-
i have this bug on getting snmp data from tnsr
https://prnt.sc/26cwu9wi added screenshot
do not have any problem on getting data from my other devices (juniper, cisco)
-
The screenshot just shows a traffic graph. What's the bug?
What are you expecting to see and what isn't meeting that expectation?
What is your SNMP configuration in TNSR? (You can omit the community name or anything else private)
-
@jimp i can't get data correctlyfrom tnsr
i added screenshots of my network all traffic
all traffic goes from tnsr to Mikrotik device and traffic is the same on both devices
tnsr: https://prnt.sc/26d0qx4
mikrotik: https://prnt.sc/26d0r52my snmp conf;
snmp community community-name snmpcommunitynamexadsfg3425gsdf source x.x.x.0/24 security-name snmpcommunitynamexadsfg3425gsdf
snmp group group-name snmpcommunitynamexadsfg3425gsdf security-name snmpcommunitynamexadsfg3425gsdf security-model v2c
snmp view view-name snmpcommunitynamexadsfg3425gsdf view-type included oid .1
snmp access group-name snmpcommunitynamexadsfg3425gsdf prefix exact model any level noauth read snmpcommunitynamexadsfg3425gsdf write none -
So your issue/concern is 1 device is showing.
1470mbps and the other is showing 1154mbps?
Which is which, how exactly does that have to do with some snmp bug? What is the polling.. Just at a loss to what anyone could do with the info provided to even look at anything?
-
@jimp data is corrupted
not showing the data correctly
well
shows a little traffic shows a lot of traffic
Exactly tnsr showing corrupted dataAll traffic coming from my upstream to tnsr and tnsr send all traffic to mikrotik
Graph tnsr screenshot
https://prnt.sc/26d1xzdGraph mikrotik screenshot
https://prnt.sc/26d1xs1Note: tnsr sending all traffic to mikrotik both devices running same traffic
-
@lukecage And who says the mikrotik data is correct, maybe its off and the tnsr data is the correct numbers.
Just at a loss to understand what you expect someone to do with some graphs? Ok not pulling numbers ok, but different values - which one is correct, or closer to correct. How do they average the data, what is the sample rate, etc.. I could see where you might have something to point out if one was showing gigs of data and the other was showing kbits, but one shows max 809 and other shows 701.. But what is the sample rate, is one doing 30 second average, the other doing 60 seconds, etc. Do you have a 3rd sample that corresponds to one of those, or how do you know they are both not wrong..
its like you had a watch that said it was 11:59:00, and then you brought in 2nd watch is wrong because it says it 11:59:01 -- Who says the first watch time was correct in the first place?
-
@johnpoz
Scanning interval same on both devices - 30 secondsI can safely say to you, my traffic usage is progressing stability evening rush hour, I'm monitoring the traffic instantly from mikrotik gui(winbox) There is no 1 gbps difference in 30 seconds.
Dont have firewall rules or access lists on both device
Mikrotik snmp show stable traffic usage
https://prnt.sc/26d3muyTnsr snmp show unstable traffic usage
https://prnt.sc/26d3n9oTraffic usage same on both devices
Tnsr sending all traffic to mikrotik deviceNote:
I tried update prtg server
I tried change snmp community etc and restart service on tnsr side
I tried reboot tnsr
My problem is unresolved -
new screenshots
tnsr
https://prnt.sc/26d8kk1mikrotik
https://prnt.sc/26d8knp -
@lukecage still not seeing anything here other than a 2 watch problem.. Which one is correct?
Maybe your mikrotik smooths the data more than tnsr. Maybe its a difference in whatever your using to graph that, and its polling, or smoothing settings.
Even if using settings same, take reading every 2 seconds and average last 30 seconds.. if they are not looking at the data at exact same time your going to see differences..
If you don't like the data your seeing because it doesn't "match" up exactly with some other system doesn't mean there is a snmp bug.. These are 2 different systems.. 2 different OSes, 2 different nics I assume, 2 different drivers, etc. etc..
Looking at your graphs to me - just looking like one is smoothing more than the other. Or sample time slightly off.. I see increase in data that lines up with increase in data on the other one, I see area that could just be different smoothing applied
-
It could also be a difference in how the two handle the data. For example the Mikrotik may be taking longer to process things and queuing up traffic, where TNSR is pushing it out as soon as it gets it.
The totals are so close I find it hard to believe there is a problem with the data.
There are also statistics available via prometheus, which you could try logging instead of SNMP, to see if that makes a difference.
-
still not seeing anything here other than a 2 watch problem.. Which one is correct?
mikrotik device showing true dataOn the tnsr side, there are too many graphic defects
i tried to install a new tnsr and get data
dont have any problem https://prnt.sc/26d8tzswhy i living this problem my main tnsr router i dont know
https://prnt.sc/26d8ugsboth tnsr working on reading every 30 seconds
note: my traffic is progressing stable, as in the screenshot I mentioned on the tnsr side, there is an imbalance in my traffic.
-
i changed scanning interval on both devices
tnsr -> 30 seconds to 60 seconds
mikrotik 30 seconds to 5 secondsi will share results with you in 40-50 minutes
-
I'm not seeing any defects, just differences in how the traffic is being processed at higher volumes in your environment.
TNSR uses VPP which does vector processing which handles multiple packets at the same time, most other things process only one packet at a time (scalar processing). So it makes sense that it would handle large chunks of traffic at once (the peaks) as they come in.
-
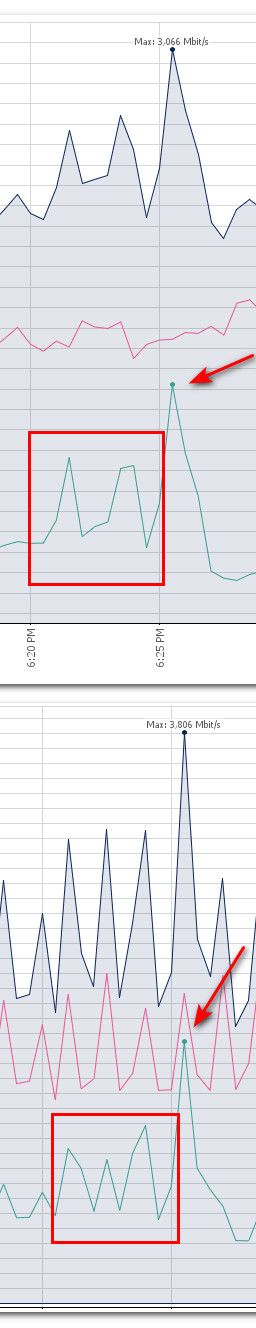
hello i found this problem
myby have rate limit on snmpdont have any problem on 60 second scanning interval
https://prnt.sc/26d93l0 -
Unlikely to be any kind of rate limit. That's just smoothing the peaks/valleys since you're sampling half as often.
-
-
Also, not a rate limit per se but VPP only updates its counters every 10 seconds:
https://docs.netgate.com/tnsr/en/latest/monitoring/interfaces.html#monitoring-interfaces
It does that to minimize the load imposed on traffic processing by tracking statistics.
So there could be a timing issue there, but again, it all evens out over time.
-
@jimp Thank you sir