Latency spikes during Filter reload - CE 2.6.0
-
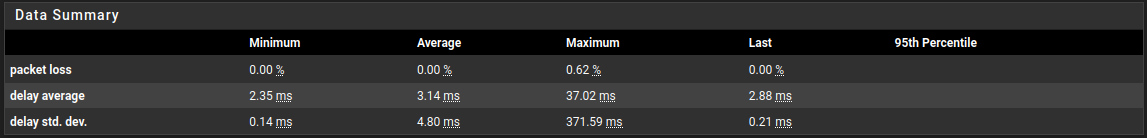
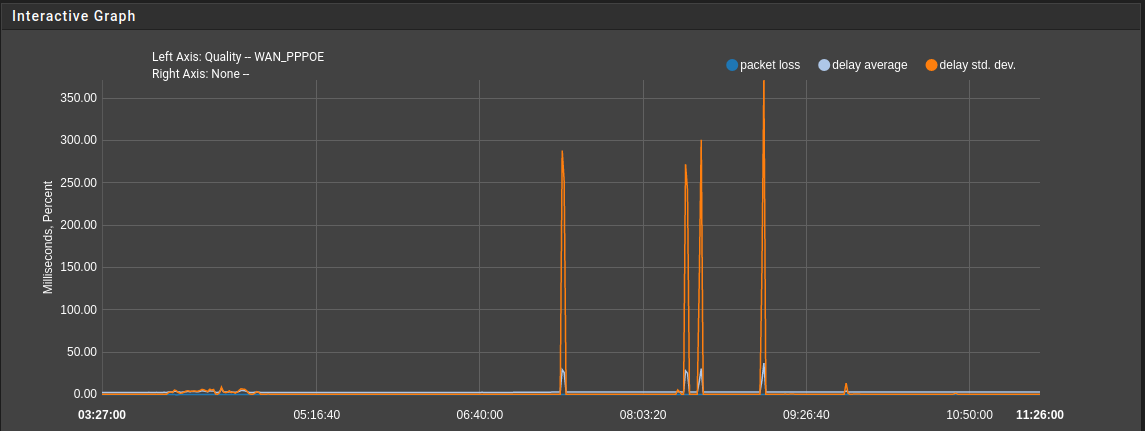
@stephenw10 - Here is the ThinkBroadband Monitor showing pre and post upgrade
Stopping the rc.filter_configure_sync cron job running stops the latency spikes.
-
@stephenw10 said in Latency spikes during Filter reload - CE 2.6.0:
Testing here with a 1700 line ruleset and not seeing this. Still digging....
Maybe there is more to it than just rule count.
Do you have any Rules with advanced Options like State Type != keep or Gateway override for policy based routing? Do you use Gateway Groups in some rules?
-
@averlon - From memory,
-
State Type != keep -> no
-
Gateway groups -> yes
-
Gateway override -> yes
-
Also Traffic shaping -> yes
-
-
For Reference
Have currently only console access via IPMI. Gonna do some tests later, when I get in-band access to that machine.
-
@stephenw10 @averlon - as a test I disabled SMP by adding kern.smp.disabled=1 to /boot/loader.conf.local . Early indications are that this mitigates the latency issue. There was apparently a similar issue in 2.4.5 - https://forum.netgate.com/topic/149595/2-4-5-a-20200110-1421-and-earlier-high-cpu-usage-from-pfctl
-
Yes, though it isn't a regression of that issue directly as that was easy to replicate in the end.
Just to confirm you are seeing spikes pinging to the firewall or though it? Or Both?
-
@stephenw10 - I see both.
-
Ok, with a large generated ruleset I am able to see latency spikes when reloading it for the time it's loading.
But disabling does not make any difference. In fact it makes it significantly worse, which is what I'd expect.What values are you seeing there with only one CPU core?
Steve
-
@stephenw10 - I've not tested technically. It may be that the dashboard isn't show increased latency while the reload is running due to CPU spike. TBM is showing 15 min spikes, so I guess my early optimism is misplaced.
-
@stephenw10 - Having re-enabled SMP, I ran a continuous ping test from my PC to WAN address with 1000 byte payload. Steady state ping time is 4-5s. When reload is running, it results in 4 timeouts and 5-6 massively higher than normal ping times (1-5s vs 4-5ms), so actual period of high latency is ~10s.
-
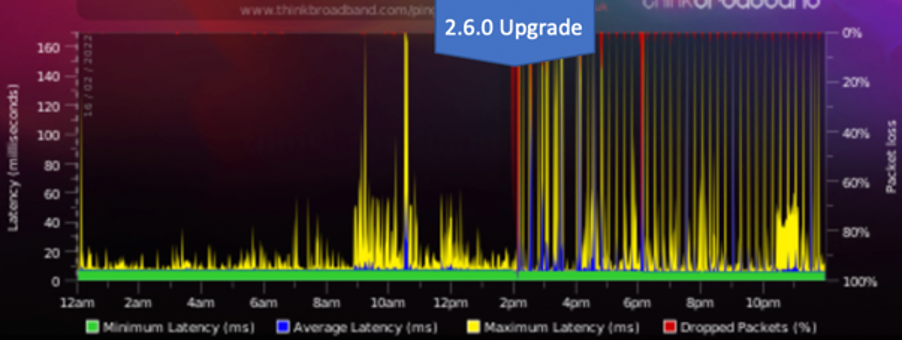
Ok, I've replicated this here given enough rules and tables:
[22.01-RELEASE][root@5100.stevew.lan]/root: pfctl -sr | wc -l
    1121
[22.01-RELEASE][root@5100.stevew.lan]/root: time pfctl -f /tmp/rules.debug
0.520u 2.295s 0:02.81 100.0%    203+182k 1+0io 0pf+0w

[21.05.2-RELEASE][root@5100.stevew.lan]/root: pfctl -sr | wc -l
    1116
[21.05.2-RELEASE][root@5100.stevew.lan]/root: time pfctl -f /tmp/rules.debug
0.302u 0.270s 0:00.57 100.0%    202+176k 0+0io 0pf+0w
Try that test dircetly. I see latency to the firewall while the ruleset is reloading and because it seems to take significantly longer that becomes noticeable.
There is a bug open for this here: https://redmine.pfsense.org/issues/12827
Steve
-
I wanted to chime in on this thread to note that I also see regular CPU spikes now ~15-30min apart after the upgrade to 2.6.0/22.01, that were not present in 2.5.2. I don't have as large of a rule set as the other posters, so the CPU only spikes to 2-3% and no noticeable impact to traffic / latency so far.
-
S SteveITS referenced this topic on
-
@tman222
It's normal to have some sort of load on the firewall's CPU - all traffic on pfSense is processed at interrupt level. When you open and look at your dashboard, it consumes CPU time as well. 2 - 3% load is a usual load profile, looking on a idle system. In general the load may spike up to 100% for a period of time and not necessary affect latency of traffic.
For some reason, reloading large rulesets "tackles" the firewall, causing all traffic to stop for a few seconds. -
Yeah, 2-3% is nothing to worry about.
If you hit this you will see something like:
last pid: 16601;  load averages:  0.46,  0.17,  0.10                                                                  up 1+16:21:09  16:44:08
599 threads:   7 running, 547 sleeping, 43 waiting, 2 lock
CPU:  1.6% user,  0.0% nice, 60.9% system,  0.0% interrupt, 37.5% idle
Mem: 29M Active, 201M Inact, 702M Wired, 2905M Free
ARC: 229M Total, 46M MFU, 176M MRU, 168K Anon, 1423K Header, 5909K Other
     109M Compressed, 315M Uncompressed, 2.90:1 Ratio
Swap: 1024M Total, 1024M Free

  PID USERNAME    PRI NICE   SIZE    RES STATE    C   TIME    WCPU COMMAND
16601 root         20    0    16M  8132K CPU3     3   0:03 100.00% pfctl -f /tmp/rules.debug
56110 root         20    0    11M  2644K CPU2     2   0:22  70.96% /usr/local/bin/dpinger -S -r 0 -i WAN_DHCP -B 172.21.16.21 -p /var/run/dpi
59112 root         20    0    19M  6856K *pf ru   0   0:10  66.11% /usr/local/sbin/ntpd -g -c /var/etc/ntpd.conf -p /var/run/ntpd.pid{ntpd}
   11 root        155 ki31     0B    64K RUN      3  39.9H  55.95% [idle{idle: cpu3}]
   11 root        155 ki31     0B    64K CPU1     1  39.9H  39.34% [idle{idle: cpu1}]
   11 root        155 ki31     0B    64K RUN      0  39.9H  33.16% [idle{idle: cpu0}]
   11 root        155 ki31     0B    64K RUN      2  39.9H  21.50% [idle{idle: cpu2}]
56372 root         20    0    14M  2696K *pf ru   3   0:21  12.56% /usr/local/bin/dpinger -S -r 0 -i VTI0_VTIV4 -B 10.45.13.2 -p /var/run/dpi
    0 root        -92    -     0B   736K -        1   4:16   0.17% [kernel{dummynet}]
Even there though you'll notice no CPU core is pegged at 100%.
Steve
-
@averlon The new System Patches package lists recommended patches, and one is to Disable pf counter data preservation to temporarily work around latency when reloading large rulesets.
-
T totowentsouth referenced this topic on
-
T totowentsouth referenced this topic on
-
Listing recommended Patches via the the System Patches package is a great enchantment.
Meanwhile I've rolled back to 2.5. The 2.6 enchantment, which I wanted to get from that Release (IP Fragmentation over IPsec) isn't working in my configuration. Probably I'll have to change the IPsec Filter Mode to "VTI only" to get this work. This means also, I'll have to migrate a bunch of Rules (~900) from the IPsec section to each VTI Interface and spend some thoughts on how I design rules for encrypted traffic between sites when a firewall has to do a transit role.I've encountered another Issue with HAProxy on 2.6 - The process started to consume permanent 100% CPU Time (one core) randomly. After a restart of the service, all went back to normal, at least for a while. I didn't look further into this, maybe it has something to do with ocsp preload enabled on some front-ends.
For now I'm back on 2.5.x., all in all it's running more stable in my configuration, even if 2.6 has some great updates in the IPSec code what makes overall configuration more smooth and reduce boot time about 50%.
-
N nsmhd referenced this topic on