Continuously increasing memory usage since the update to 2.6
-
Greetings,
We have the problem with several VMs that since the update to 2.6, the memory usage is
continuously increasing without the configuration changing in any way. Here are the technical data of the VMs:2 Core CPU
1 GB RAM
5 GB SSD
Filesystem: ufs
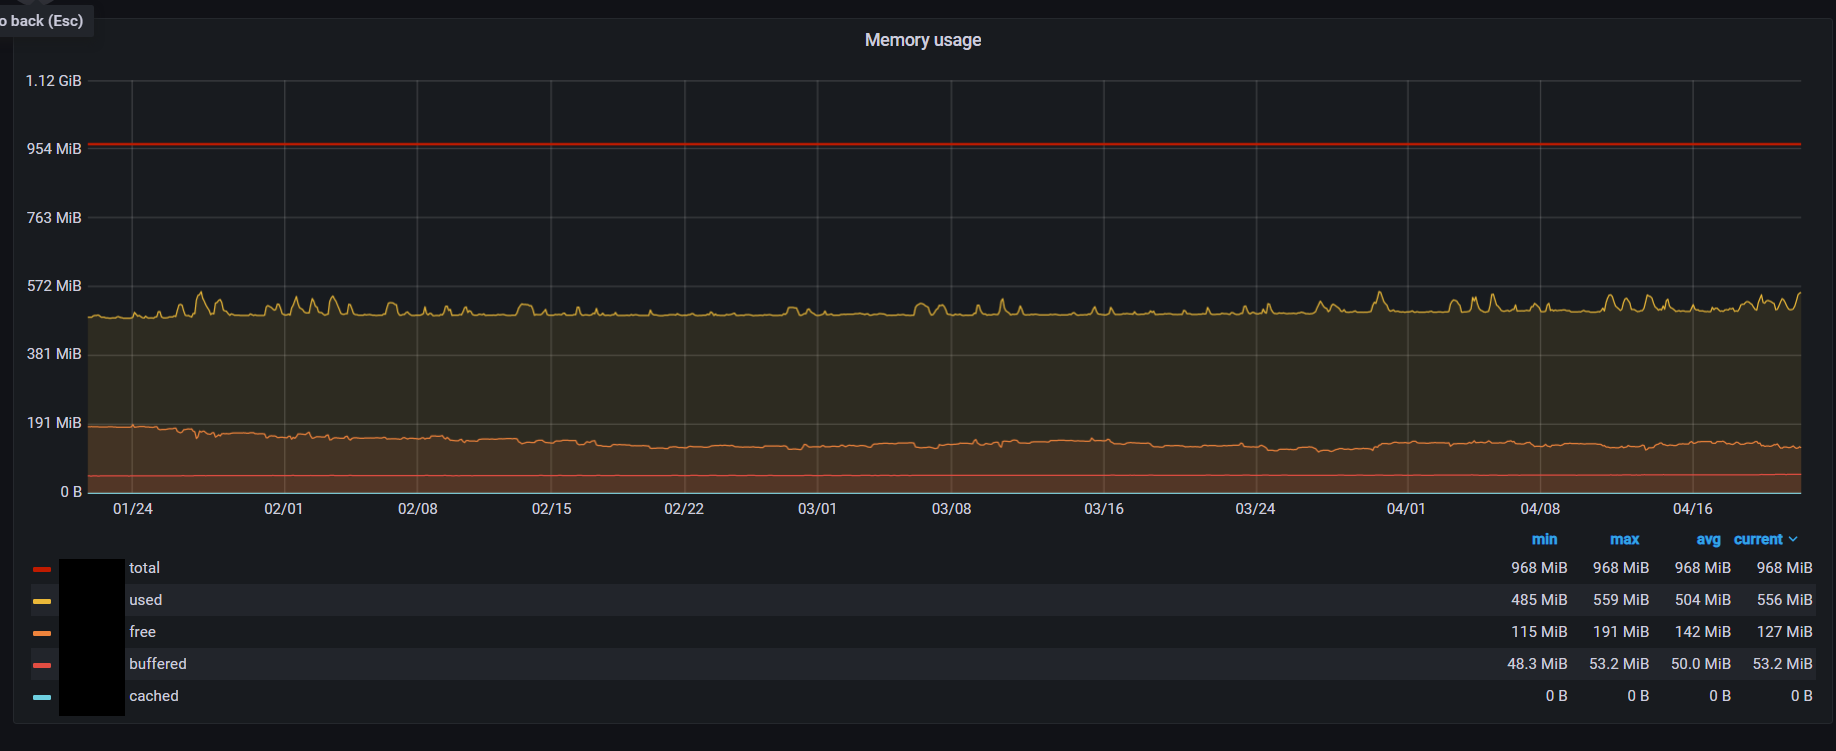
HV: Hyper-VFollowing our Grafana report:
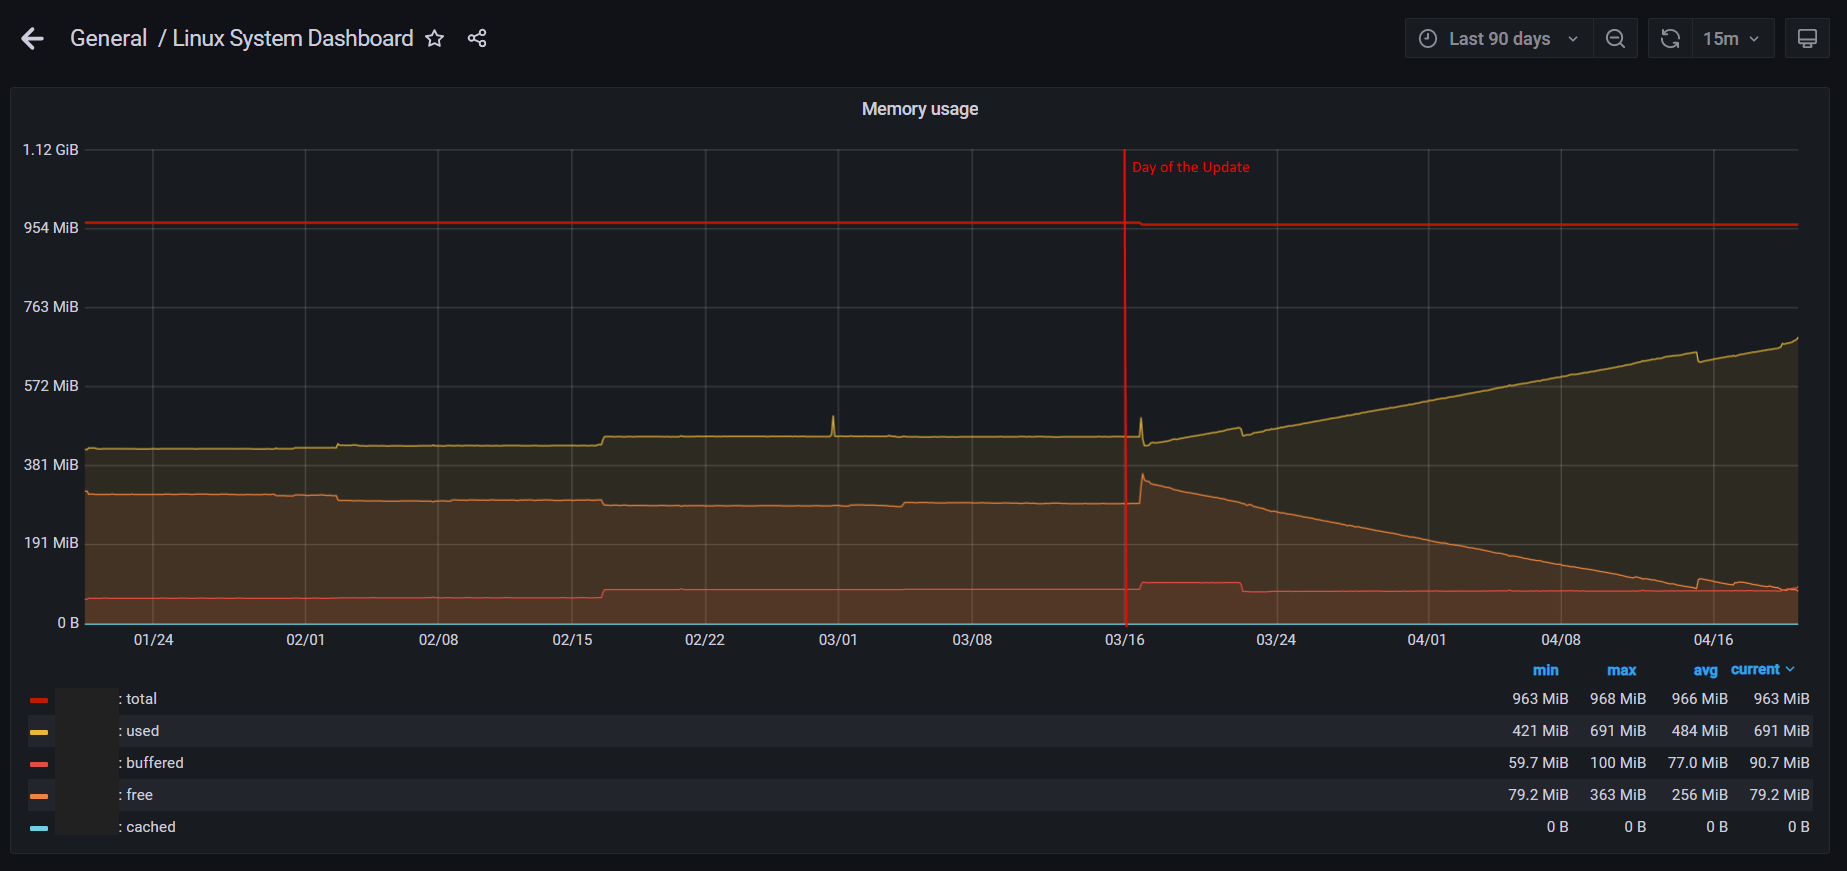
Furthermore, the memory is constantly marked as "wired" and is not released again.
Has anyone else noticed this phenomenon? Is it intentional or is this a leak?
-
What is shown as using it? Which process?
-
With only 1GB memory, that's an awfully lightly provisioned machine. Even the single-user system shown in my sig has 4GB. But FreeBSD is a far better memory manager than "The OS That Must Not Be Named" and will tend to fill the available physical memory and free it as needed. If you are getting into swap, I'd just increase the memory to 2-4GB. Much depends an whether you're using packages and user load, but I'd expect 1GB to barely handle firewalling.
-
Thanks for your reply.
Ich have taken a couple of screenshots of two of our 2.6 pfSense (same specs as before):
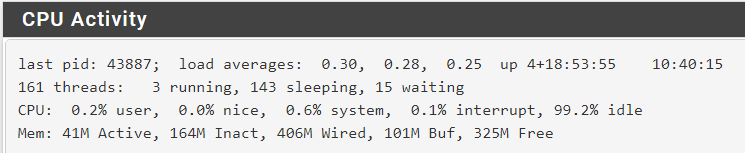
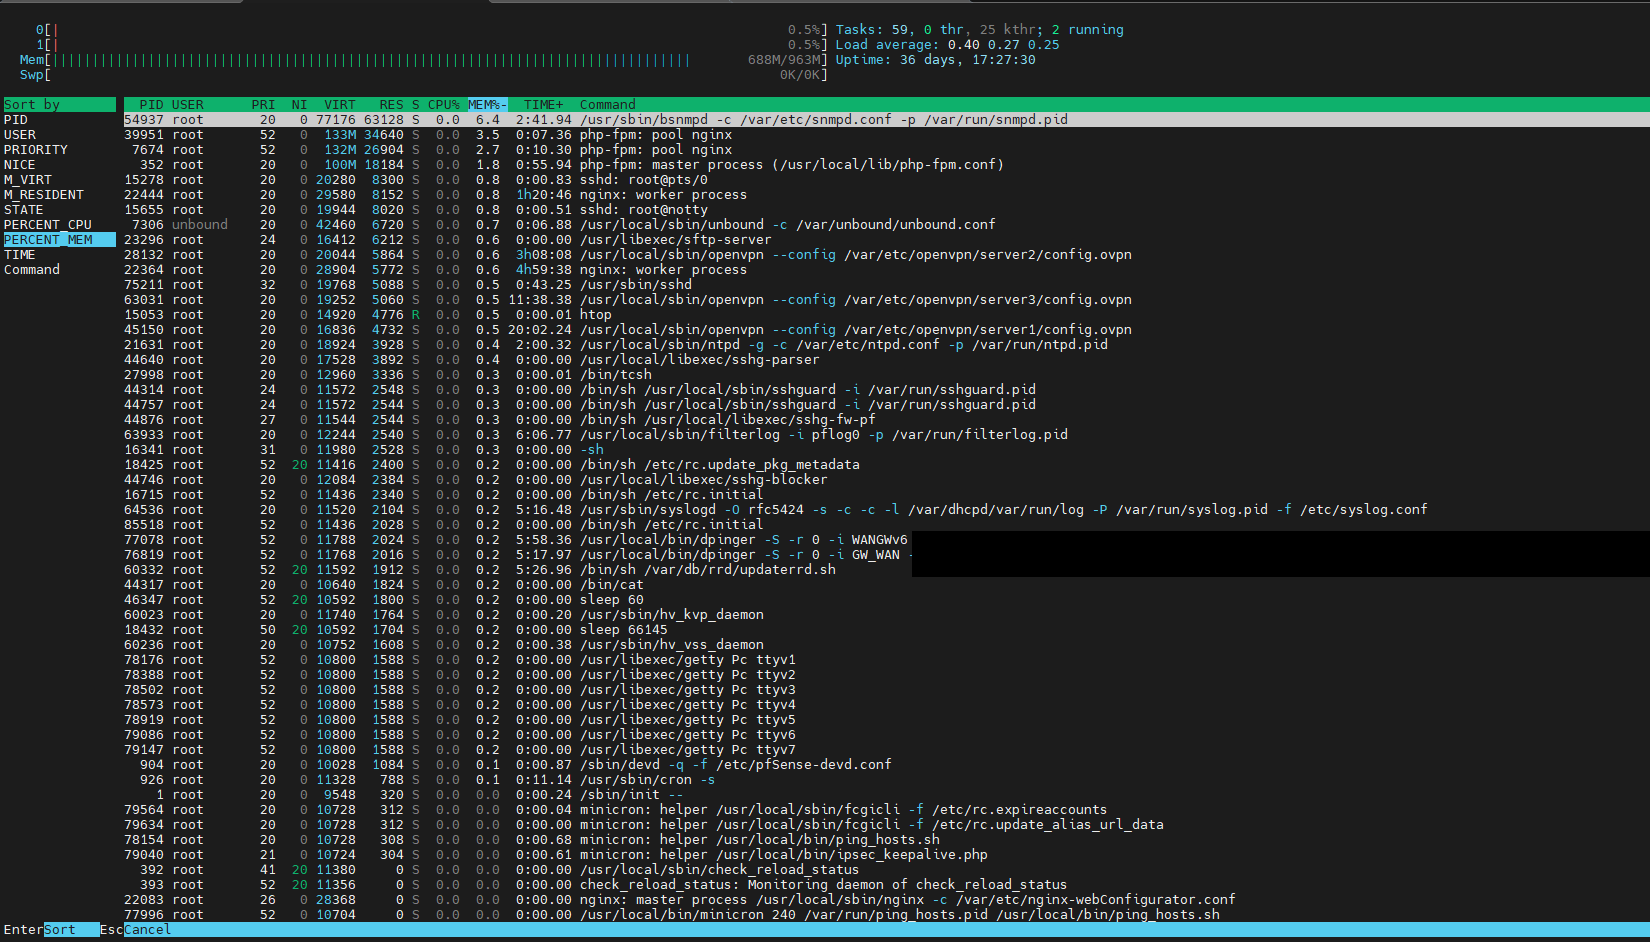
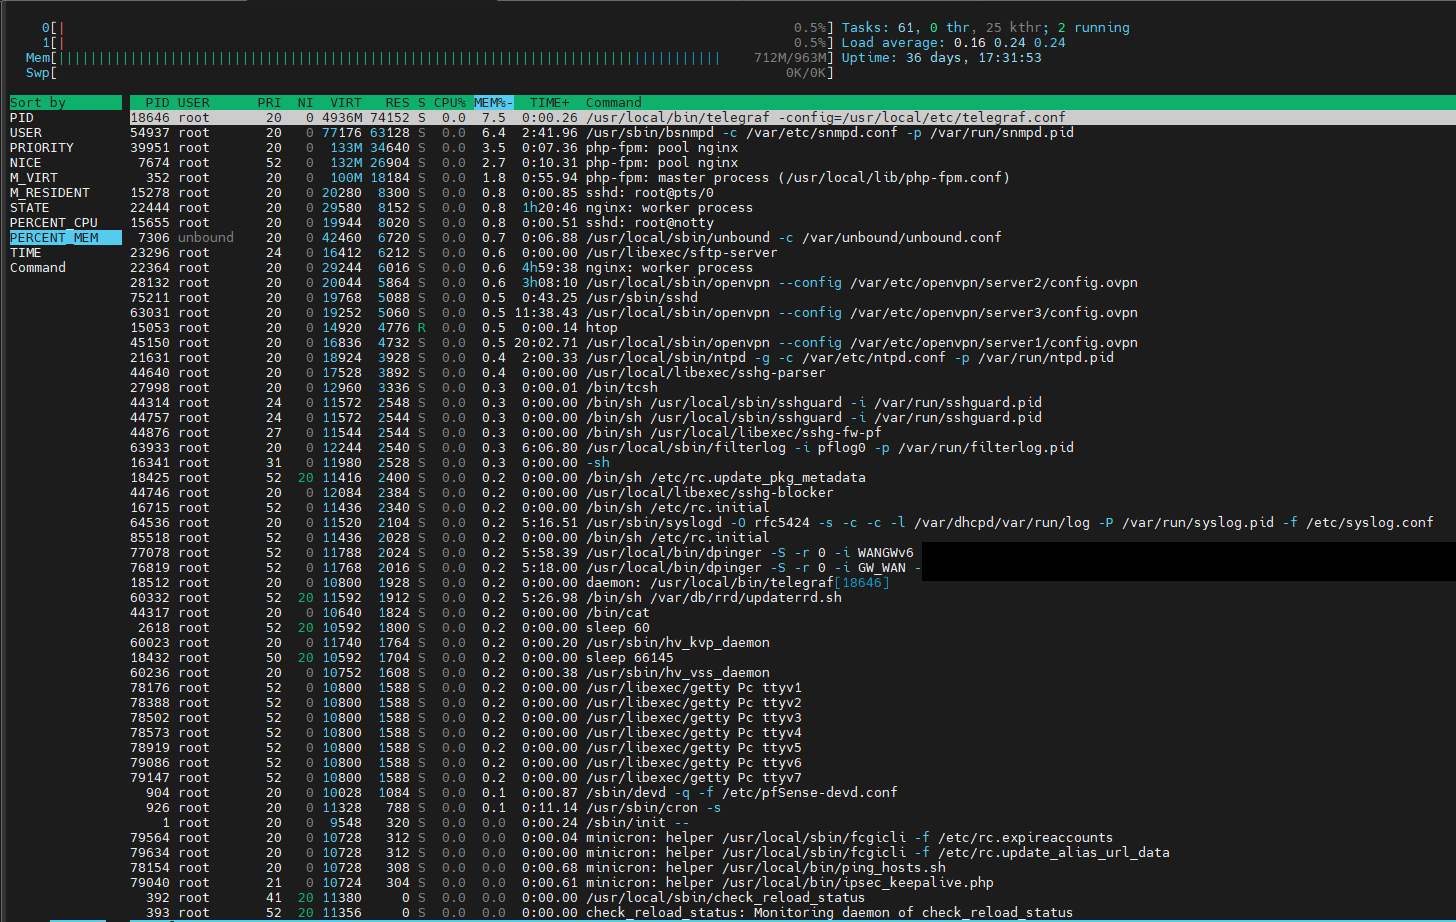
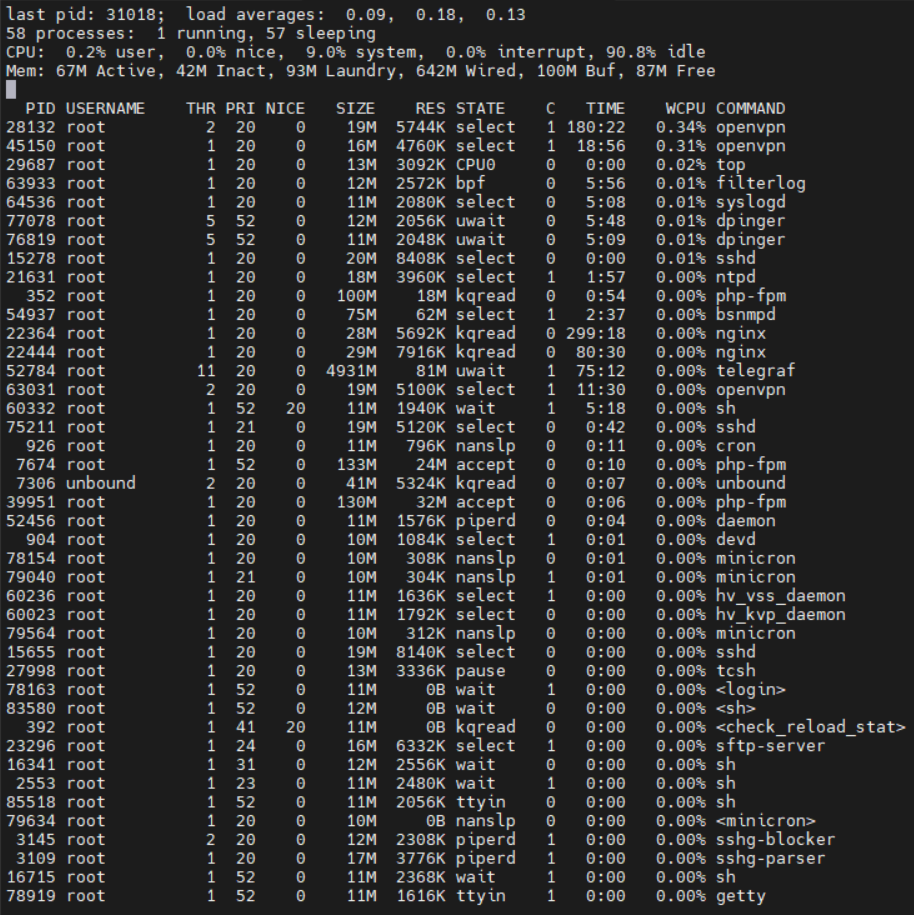
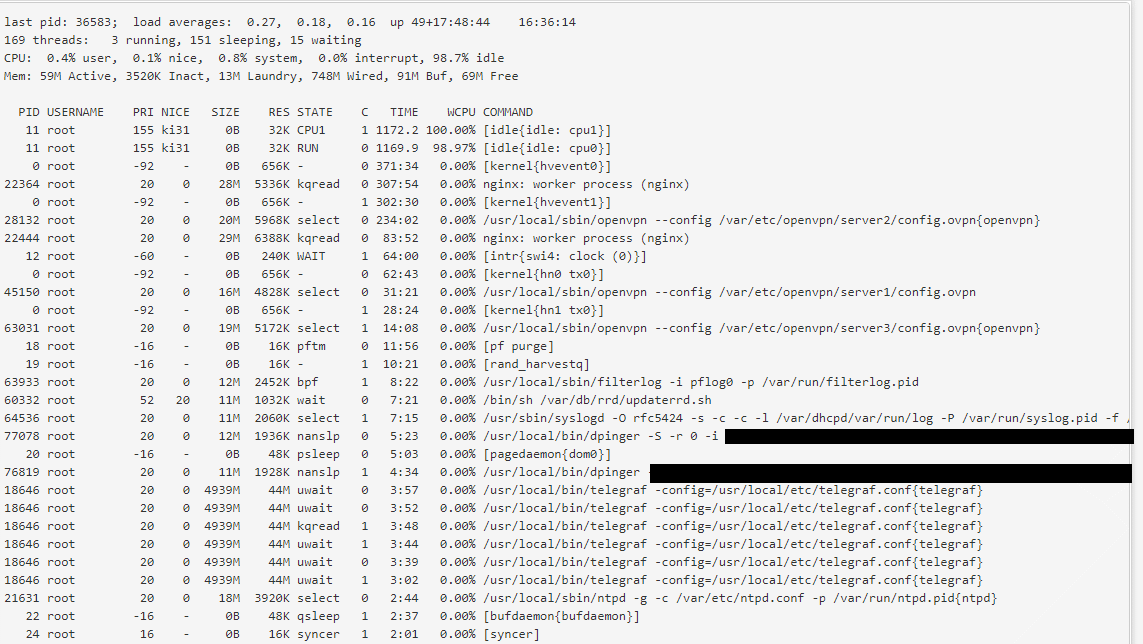
top:

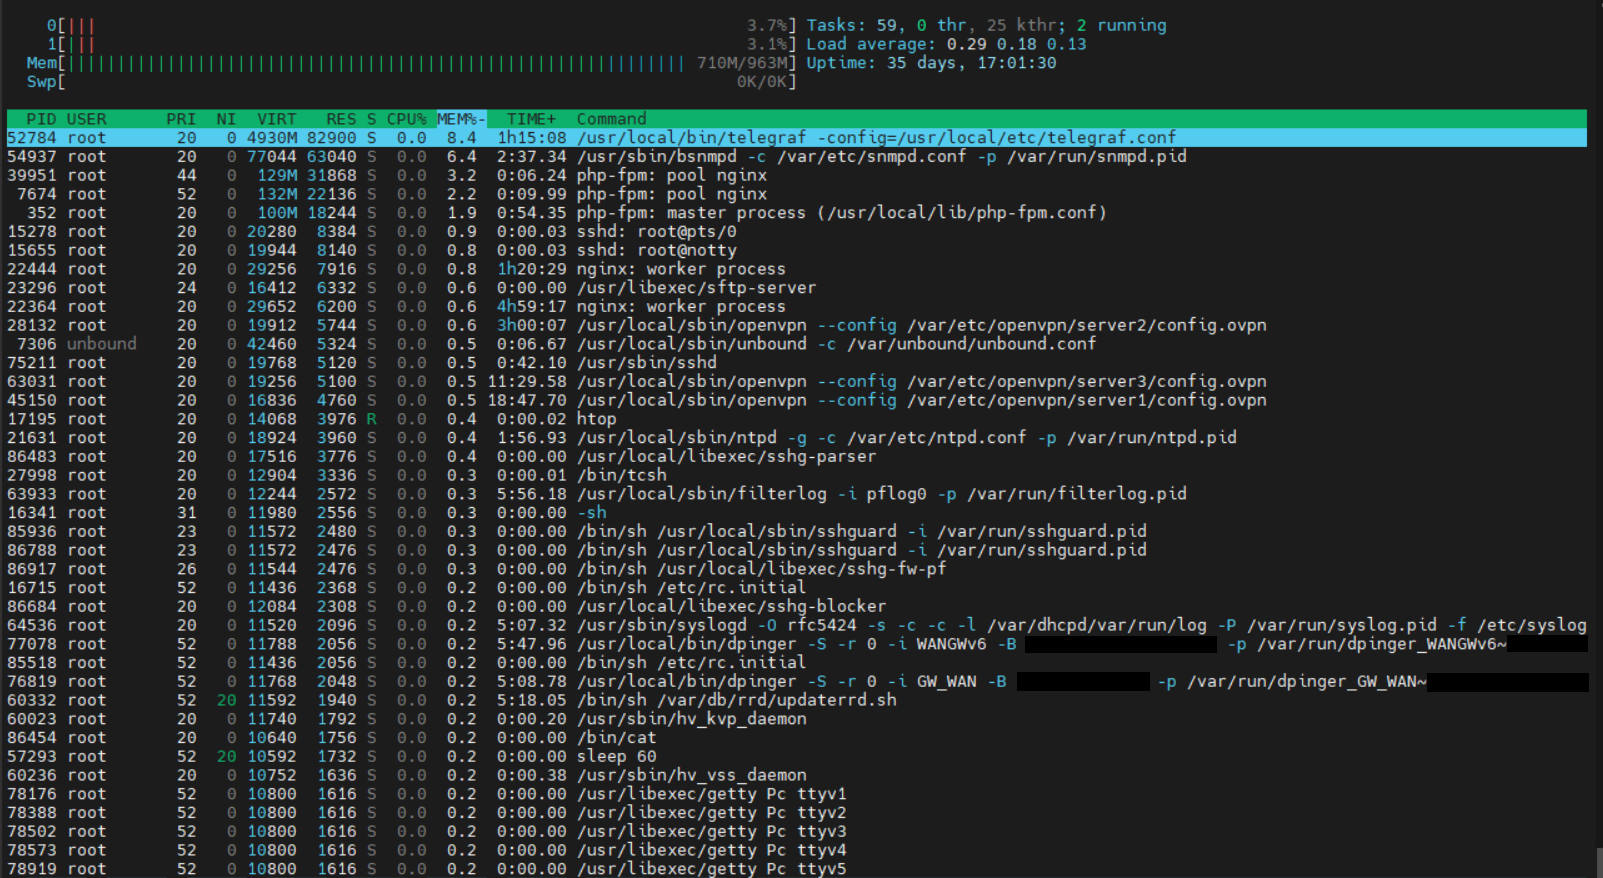
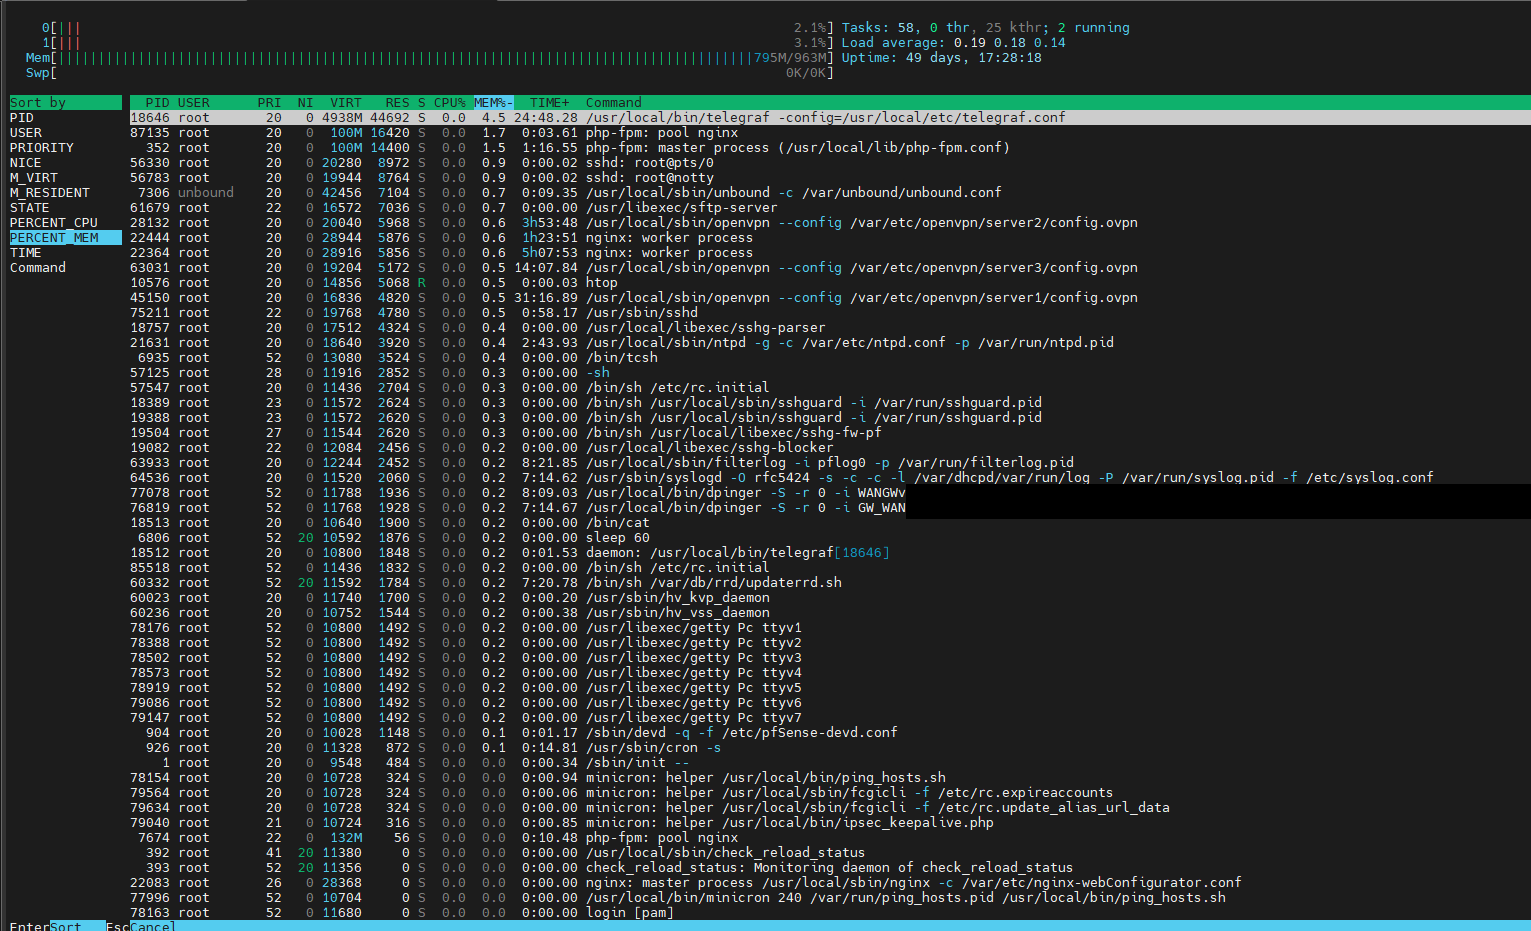
htop:
And a second one:
top:
htop:
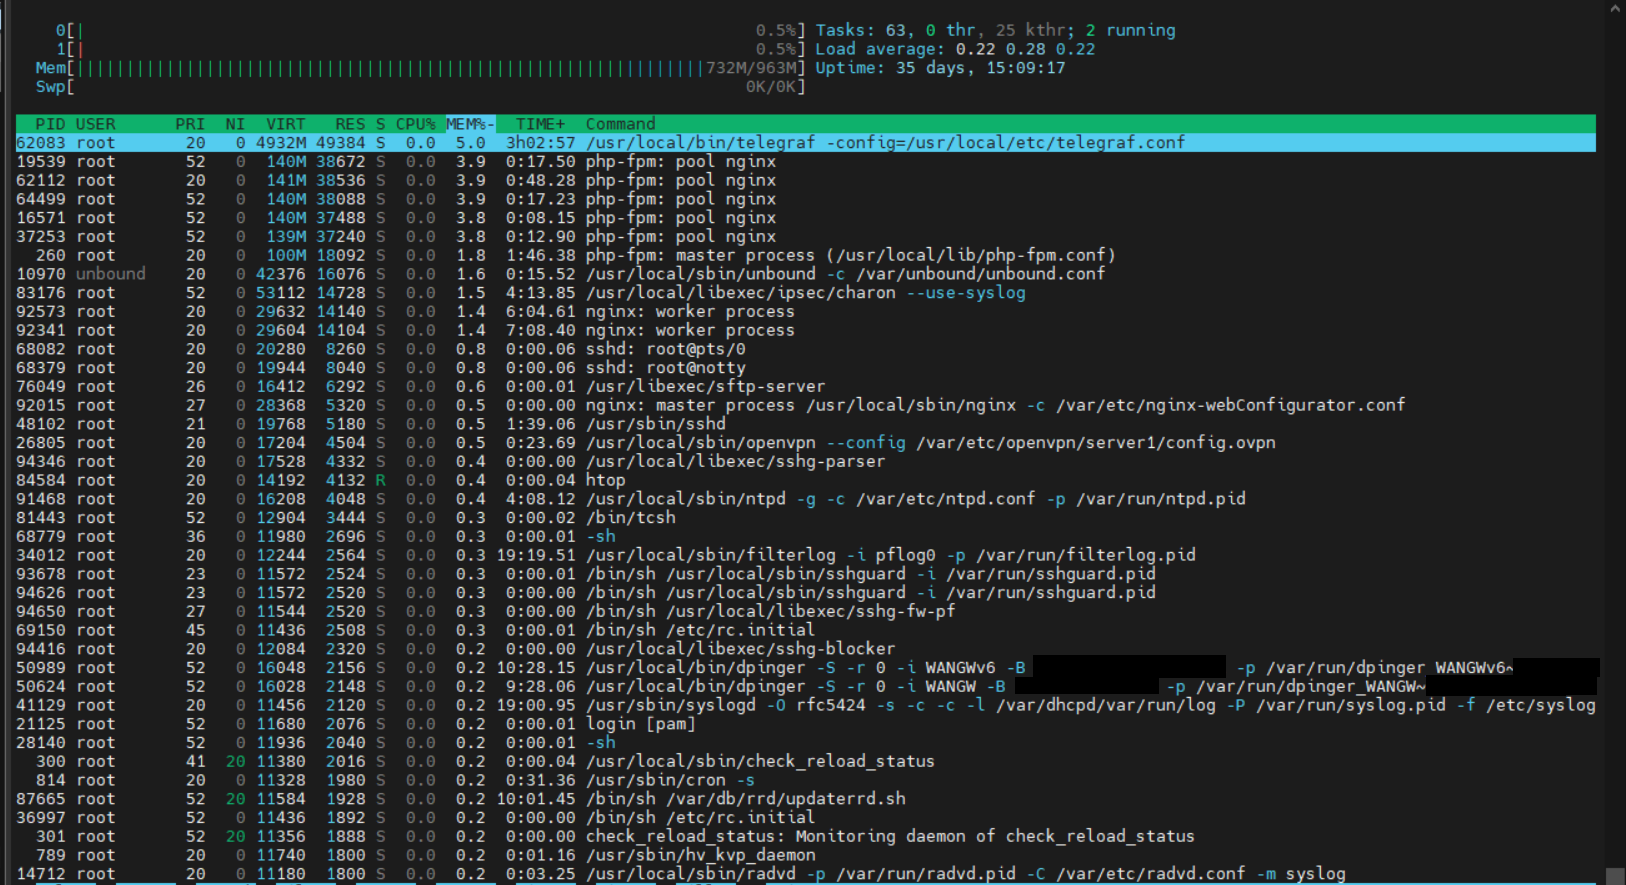
those pfsense have bearly anything to do. No IPsec or large firewall-Rulesets. Only 1-3 ovpn Tunnels for Client-Access
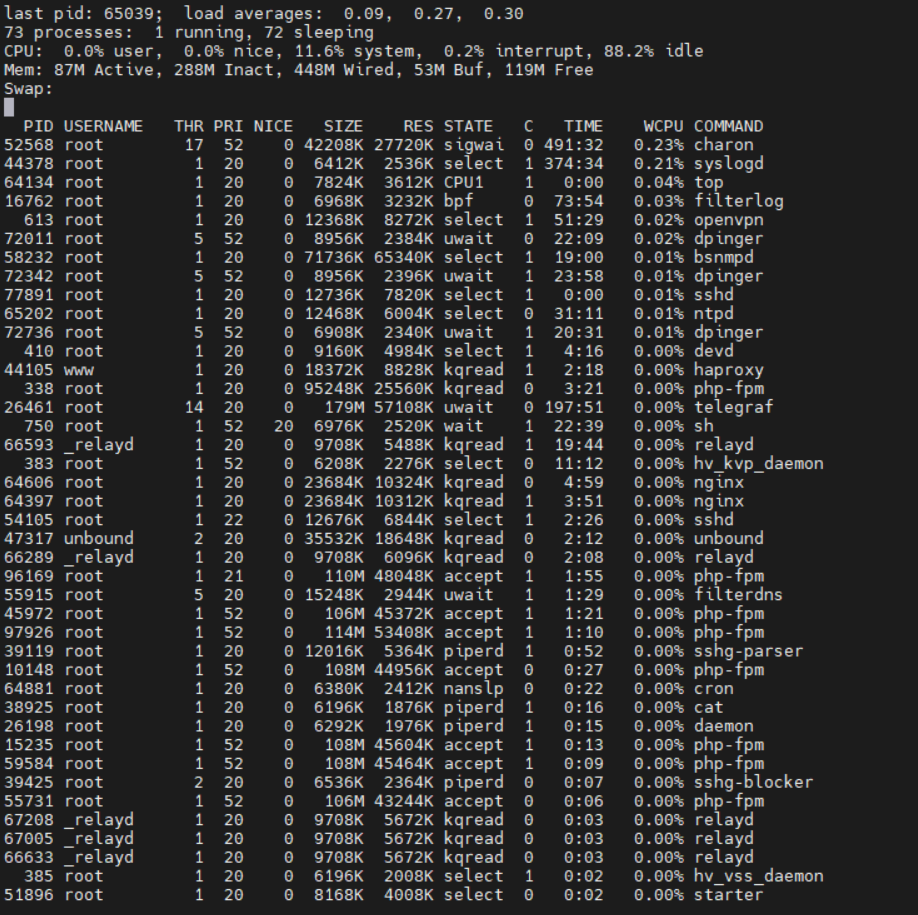
For comparison here are the stats of one of our biggest pfsense we have running.
Same Specs
2 Core CPU
1 GB RAM
5 GB SSD
different Version:
Version 2.4.540+ IPsec Tunnels
5+ ovpn
4 Interfaces with extensive firewalling
HA Proxygrafana:
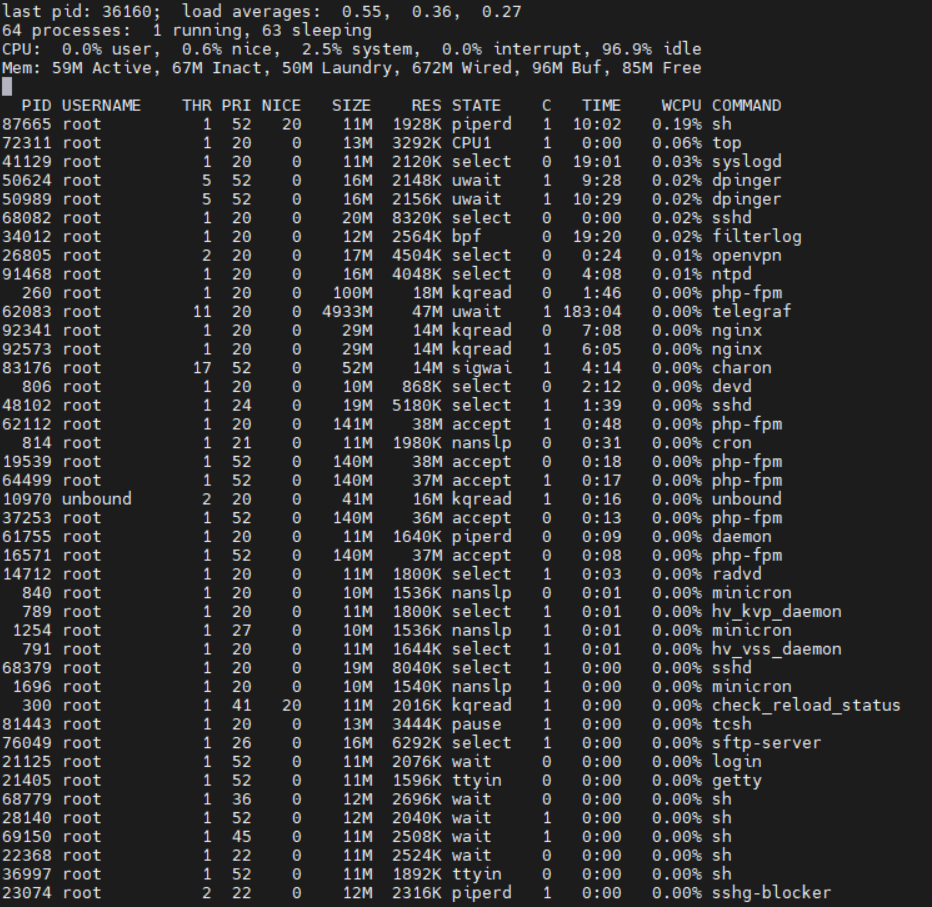
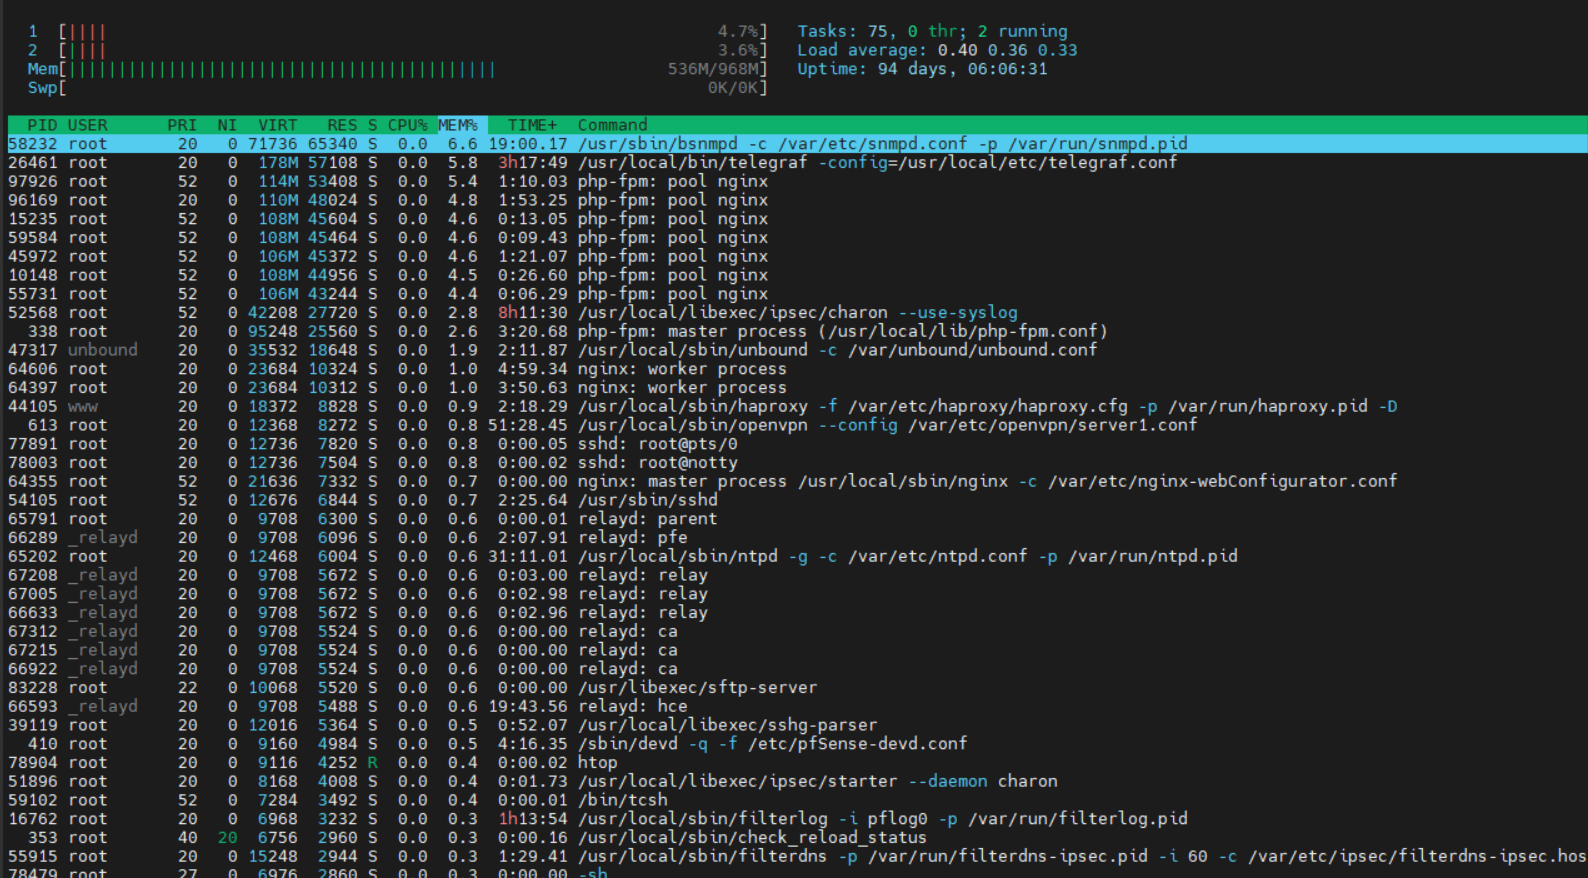
top:
htop:
-
Try restarting Telegraf. Look at the difference in memory usage there.
Steve
-
Hey stephen,
thanks for your help.
I followed your suggestion and deactivated/restarted the telegraph service. However, the effect was to be expected, only a slight decrease in memory consumption.
Telegraf off:
Telegraf on:
We also have a System, that we rebooted a few times:
Interesting is the memory behaviour after a reboot. Usually the memory drops down to "normal" levels and starts creeping up again. All services as for example Telegraf are running all the time, no config changes.
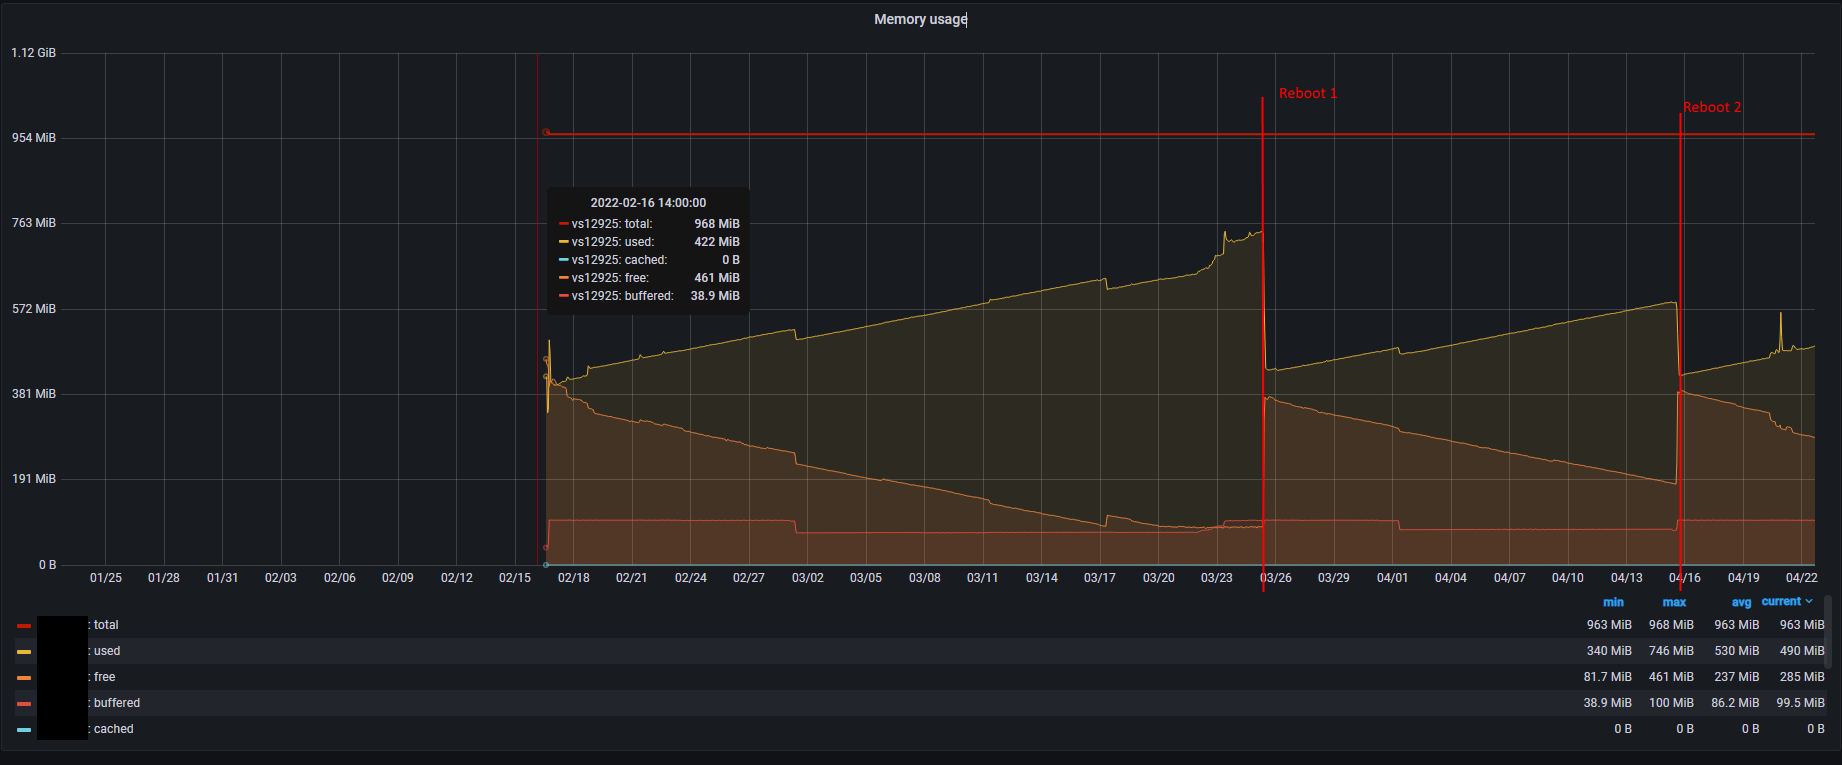
Here you can see the that the memory comes down after rebooting and creeps up again over a week or two. Also interesting is the fact that a system "reroot" does not have the same outcome. When rerooting, the memory stays at the same level es before.
any other suggestions?
-
Hmm, I wonder why it's using ~5GB virtual on the box in question but only ~200M on the other VMs.
Has it ever exhausted the free memory? What failed, if anything? -
Thats a good question. I will see if i can find the answer, why the telegraf need more on one system than on the others.
To your question:
We have not yet run any of our productive 2.6 pfSensen so long without reboot that the memory would be completely used up. However, I have deployed a few test systems, one of which is at about 93% after 31 days. I will run these until I can determine a failure.I have to play it safe with the others.
-
@techniker_ctr said in Continuously increasing memory usage since the update to 2.6:
I will run these until I can determine a failure.
It may well not fail, just start freeing unused memory when it gets close.
It would be interesting to see.Steve
-
I think i can see (On pfSense+)
A continuous slow growth too , i have 8GB Ram , and am now on 36% used.
I tried to stop ntopng, and wait a few minutes ... It fell to 34%I noticed a kazillion filterdns processes in Diagnostic --> System Activity
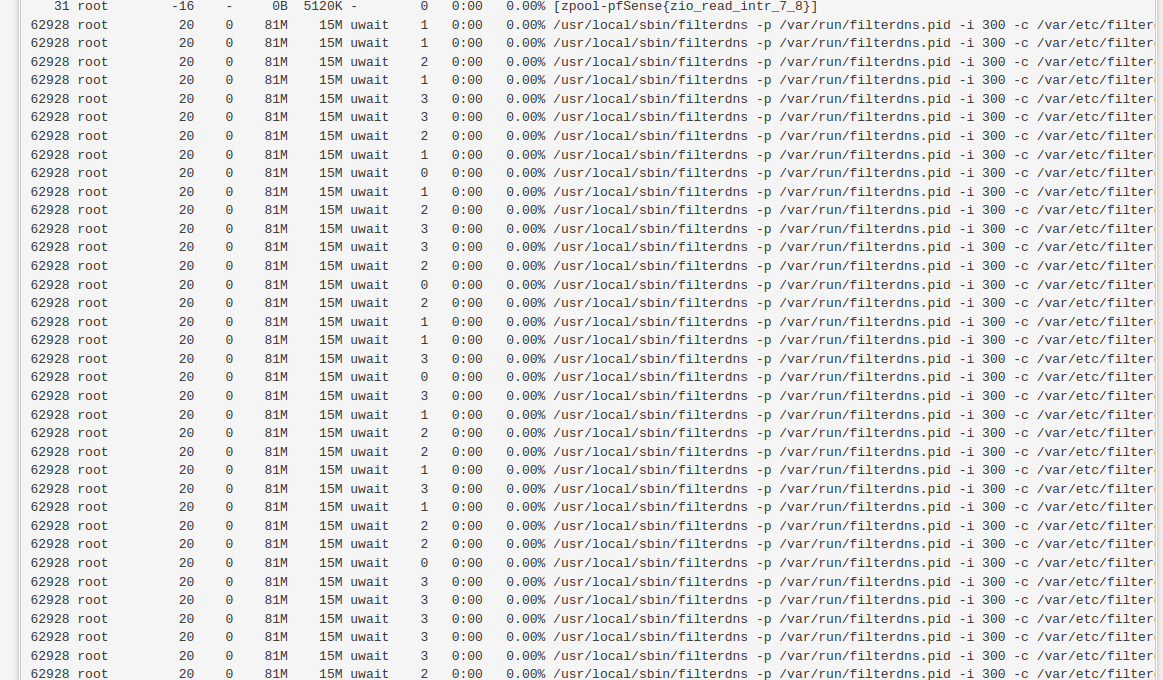
I tried to see the in a CLI with : ps -aux (i'm a linux guy) - But they're not shown with that command.
What cli command will show those filterdns processes And the many ntopng's i see too.
Edit:
I have a DOH blocklist loaded via web , does that create a filterdns per "host" or ??/Bingo
-
Yes, it can create a lot of filterdns processes. Especially if some things are failing to resolve.
Check the Resolver logs for errors. Prune any old entries that no longer resolve if you can. -
@stephenw10
I see no resolver errors
Everything is resolvable.How does that resolverstuff work ?
Is it a timed job that spawns a resolver for every entry ?Is it run every 10 min ?
/Bingo
-
-
Well to reply (to my self) on how to list the filterdns
processesthreads (process number is the same)jimp gave a hint here
https://redmine.pfsense.org/issues/8758Use
ps uxHaww | grep filterdnsroot 62928 0.0 0.2 82100 14760 - Is Wed16 0:00.00 /usr/local/sbin/filterdns -p /var/run/filterdns.pid -i 300 -c /var/etc/filterdns.conf -d 1 root 62928 0.0 0.2 82100 14760 - Is Wed16 0:00.00 /usr/local/sbin/filterdns -p /var/run/filterdns.pid -i 300 -c /var/etc/filterdns.conf -d 1 root 62928 0.0 0.2 82100 14760 - Is Wed16 0:00.00 /usr/local/sbin/filterdns -p /var/run/filterdns.pid -i 300 -c /var/etc/filterdns.conf -d 1 root 62928 0.0 0.2 82100 14760 - Is Wed16 0:00.00 /usr/local/sbin/filterdns -p /var/run/filterdns.pid -i 300 -c /var/etc/filterdns.conf -d 1 root 62928 0.0 0.2 82100 14760 - Is Wed16 0:00.00 /usr/local/sbin/filterdns -p /var/run/filterdns.pid -i 300 -c /var/etc/filterdns.conf -d 1 root 62928 0.0 0.2 82100 14760 - Is Wed16 0:00.00 /usr/local/sbin/filterdns -p /var/run/filterdns.pid -i 300 -c /var/etc/filterdns.conf -d 1 root 62928 0.0 0.2 82100 14760 - Is Wed16 0:00.00 /usr/local/sbin/filterdns -p /var/run/filterdns.pid -i 300 -c /var/etc/filterdns.conf -d 1 [22.01-RELEASE][admin@..]/root: ps uxHaww | grep filterdns | wc 132 2501 20780Sending the output to wc shows 132 line matches , that seems to be in (Is) "Idle state"
The file : /var/etc/filterdns.conf seems to contain my DNS resolvable aliases , and i have 66 of these.
[22.01-RELEASE][admin@..../root: cat /var/etc/filterdns.conf | wc
      66     198    2832
Strange that the # of filterdns
processesthreads are excactly the double of the DNS entries in /var/etc/filterdns.conf
But i suppose there is a tech (OS) reason for that , since it's excactly double, and i just don't know enough of the inner work.Now to find out how Netgate gets the "filterdns" DNS name shown in the Diagnostics --> System Activity
ps uxHaww | grep filterdnsDoesn't show the DNS name to be resolved.
@jimp - Any hint here ?62928 root 20 0 80M 14M uwait 0 0:00 0.00% /usr/local/sbin/filterdns -p /var/run/filterdns.pid -i 300 -c /var/etc/filterdns.conf -d 1{bigdata.adsunflower} 62928 root 20 0 80M 14M uwait 2 0:00 0.00% /usr/local/sbin/filterdns -p /var/run/filterdns.pid -i 300 -c /var/etc/filterdns.conf -d 1{choice.microsoft.co}Well beside the filterdns
processesthreads being the double # of the /var/etc/filterdns.conf entries , I see no increase inprocessesthreads etc. So my guess is that the filterdns stuff is behaving as expected , and not causing memory growth , unless you add more entries to resolve./Bingo
-
That output is from
top -aSHyou should be able to see them there. Though you are limited by the terminal size.Steve
-
Greetings,
I ran our test systems for a while and it seems that the RAM has settled at around 90%. This is not optimal, as we cannot use our monitoring effectively with such high values.
So far, I have not been able to detect any failure due to the increase in RAM consumption.
I have now deployed a test system with 2 GB RAM to see whether the RAM increase settles back at 90% or whether it remains at around 50%. After the deployment, the RAM on the test system is at 26%. I would provide feedback if I have any further information on this.
In the meantime, do you have any other ideas about the reason for the continuous increase in RAM?
-
Still no obvious process with increasing usage?
-
Not that i can see, here is the same system output side by side:
System as posted before:
top:
Before:
Today:
All I see is an increase in the "wired" memory
htop:
Before:

Today:
telegraf needs even less RAM than in the last analysis, I suspect that telegraf did just not compiled any data at this point.
Therefore, I do not see any really meaningful indications as to why the RAM is rising.
-
What does that usage look like in the pfSense monitoring graphs?
On my own 22.01 system I see wired use increase but that's not necessarily a problem. The is no need for the kernel to release RAM until the available free ram becomes too low for the requests using it.
Steve
-
@Techniker_ctr
@stephenw10 said in Continuously increasing memory usage since the update to 2.6:On my own 22.01 system I see wired use increase but that's not necessarily a problem. The is no need for the kernel to release RAM until the available free ram becomes too low for the requests using it.
Is it possible that this is a discussion of an old missunderstanding of memory usage in unix systems?