Netgate Discussion Forum
    • Categories
    • Recent
    • Tags
    • Popular
    • Users
    • Search
    • Register
    • Login

    22.05 snaps paused?

    Scheduled Pinned Locked Moved Plus 22.05 Development Snapshots (Retired)
    17 Posts 7 Posters 2.2k Views
    Loading More Posts
    • Oldest to Newest
    • Newest to Oldest
    • Most Votes
    Reply
    • Reply as topic
    Log in to reply
    This topic has been deleted. Only users with topic management privileges can see it.
    • luckman212L
      luckman212 LAYER 8
      last edited by

      Just wondering if the 22.05 snaps are still building? Last one reported on my test system is 22.05.a.20220426.1313 which is about a week and a half old already.

      chpalmerC 1 Reply Last reply Reply Quote 0
      • chpalmerC
        chpalmer @luckman212
        last edited by

        @luckman212 2.7 snaps also stopped that date.

        Triggering snowflakes one by one..
        Intel(R) Core(TM) i5-4590T CPU @ 2.00GHz on an M400 WG box.

        cmcdonaldC 1 Reply Last reply Reply Quote 0
        • cmcdonaldC
          cmcdonald Netgate Developer @chpalmer
          last edited by cmcdonald

          We temporarily stopped publishing snapshots publicly as we were merging in a lot of new code over the past week, and smoke testing ZFS boot environment work... Snapshots will resume with the 22.05 beta which should be very soon.

          Need help fast? https://www.netgate.com/support

          1 Reply Last reply Reply Quote 2
          • luckman212L
            luckman212 LAYER 8
            last edited by

            I see the snapshots have resumed! Let the testing commence! 😳

            jimpJ 1 Reply Last reply Reply Quote 1
            • jimpJ
              jimp Rebel Alliance Developer Netgate @luckman212
              last edited by

              @luckman212 said in 22.05 snaps paused?:

              I see the snapshots have resumed! Let the testing commence! 😳

              Yup! There will be a blog post coming shortly with more info.

              Remember: Upvote with the 👍 button for any user/post you find to be helpful, informative, or deserving of recognition!

              Need help fast? Netgate Global Support!

              Do not Chat/PM for help!

              1 Reply Last reply Reply Quote 1
              • jimpJ
                jimp Rebel Alliance Developer Netgate
                last edited by

                https://www.netgate.com/blog/pfsense-plus-software-beta-version-22.05-now-available-for-testing

                Remember: Upvote with the 👍 button for any user/post you find to be helpful, informative, or deserving of recognition!

                Need help fast? Netgate Global Support!

                Do not Chat/PM for help!

                Bob.DigB 1 Reply Last reply Reply Quote 0
                • Bob.DigB
                  Bob.Dig LAYER 8 @jimp
                  last edited by Bob.Dig

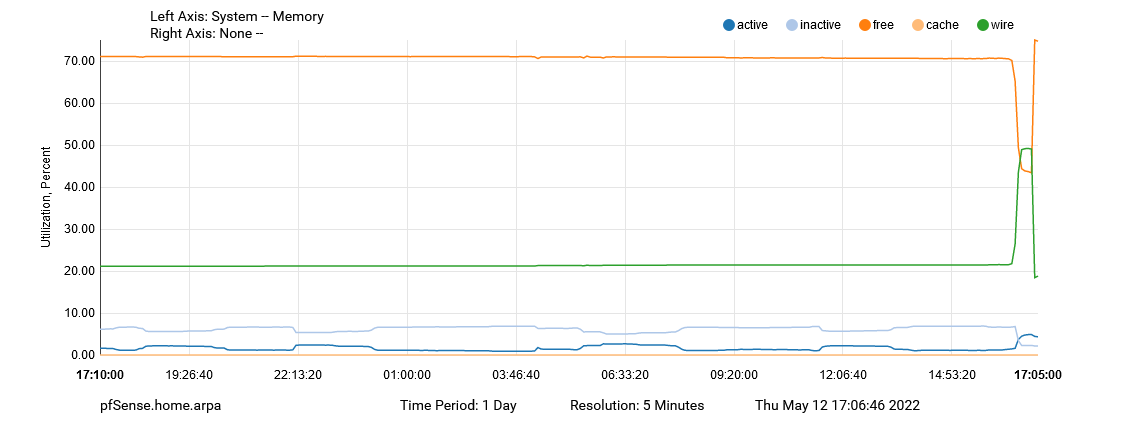
                  @jimp So I did the upgrade to the beta and afterwards I noticed a high memory usage. So I rebooted again and it is gone.

                  I am new to "beta testing" and it is probably nothing.


                  Screenshot 2022-05-12 at 17-07-26 pfSense.home.arpa - Status Monitoring.png

                  G 1 Reply Last reply Reply Quote 1
                  • stephenw10S
                    stephenw10 Netgate Administrator
                    last edited by

                    Any idea what was using it at the time?

                    It's not unusual to see memory use like that following an upgrade, especially if you have a bunch of packages that all reinstall.

                    Steve

                    Bob.DigB 1 Reply Last reply Reply Quote 0
                    • G
                      gabacho4 Rebel Alliance @Bob.Dig
                      last edited by

                      @bob-dig I had the same issue after upgrading on an 5100. Stupid me forgot to look at where the memory was being used. I just rebooted the router once more and memory usage was right back to where it was before. There were no packages that were reinstalling or anything else updating that I could discern. Sorry for being a bad troubleshooter guys.

                      1 Reply Last reply Reply Quote 0
                      • Bob.DigB
                        Bob.Dig LAYER 8 @stephenw10
                        last edited by Bob.Dig

                        @stephenw10 Today, after updating from beta to RC, I noticed it again. RAM usage was doubled after the upgrade. No problem for me though 36% RAM usage instead of 17% RAM usage, what I got after rebooting manually.

                        1 Reply Last reply Reply Quote 0
                        • stephenw10S
                          stephenw10 Netgate Administrator
                          last edited by

                          So it doubled after running the upgrade and went back to the previous use after rebooting a second time?

                          G Bob.DigB 2 Replies Last reply Reply Quote 0
                          • G
                            gabacho4 Rebel Alliance @stephenw10
                            last edited by

                            @stephenw10 I’m seeing the same thing on my 5100. Memory use is sitting at 43% when it’s normally in the upper teens or maybe 20s. Is there a command I can run that would be more helpful for you all as far as profiling this? This makes two updates, beta and RC where I see this type of memory use post upgrade. I’m confident a reboot would cause the memory use to go back to normal. I’m not worried but don’t want to destroy data that might help you all.

                            stephenw10S 1 Reply Last reply Reply Quote 0
                            • stephenw10S
                              stephenw10 Netgate Administrator @gabacho4
                              last edited by

                              Look at the output of top -HaSP, sort by 'res' to see what's using it.

                              If it's not shown there then it's kernel memory and probably just a remainder from the update process. I would expect it to be freed after some time.

                              Steve

                              G 1 Reply Last reply Reply Quote 0
                              • G
                                gabacho4 Rebel Alliance @stephenw10
                                last edited by

                                @stephenw10 hope this is of help

                                
                                  PID USERNAME    PRI NICE   SIZE    RES STATE    C   TIME    WCPU COMMAND
                                 1928 root         52    0   136M    48M accept   3   0:45   0.00% php-fpm: pool nginx (php-fpm){php-fpm}
                                 1927 root         21    0   135M    47M accept   2   0:39   0.00% php-fpm: pool nginx (php-fpm){php-fpm}
                                 2278 root         52    0   136M    47M accept   2   0:41   0.00% php-fpm: pool nginx (php-fpm){php-fpm}
                                69795 root         52    0   136M    47M accept   2   0:49   0.00% php-fpm: pool nginx (php-fpm){php-fpm}
                                 4537 root         52    0   135M    46M accept   3   0:03   0.00% php-fpm: pool nginx (php-fpm){php-fpm}
                                47460 root         52    0   135M    46M accept   3   0:10   0.00% php-fpm: pool nginx (php-fpm){php-fpm}
                                31785 root         21    0    62M    39M nanslp   3   0:06   0.01% php_wg: WireGuard service (php_wg)
                                 1926 root         20    0   103M    28M kqread   0   0:00   0.00% php-fpm: master process (/usr/local/lib/php-fpm.conf) (php-fpm)
                                40635 unbound      20    0    58M    27M kqread   3   0:00   0.00% /usr/local/sbin/unbound -c /var/unbound/unbound.conf{unbound}
                                40635 unbound      20    0    58M    27M kqread   1   0:00   0.00% /usr/local/sbin/unbound -c /var/unbound/unbound.conf{unbound}
                                40635 unbound      20    0    58M    27M kqread   0   0:00   0.00% /usr/local/sbin/unbound -c /var/unbound/unbound.conf{unbound}
                                40635 unbound      20    0    58M    27M kqread   2   0:00   0.00% /usr/local/sbin/unbound -c /var/unbound/unbound.conf{unbound}
                                47115 dhcpd        20    0    24M    12M select   3   0:00   0.01% /usr/local/sbin/dhcpd -user dhcpd -group _dhcp -chroot /var/dhcpd -cf /etc/dhcpd.conf -pf /var/run/dhcpd.pid ix0 ix1.20 ix1.40 ix1.200
                                30377 root        -52   r0    10M    11M nanslp   0   0:00   0.00% /usr/sbin/watchdogd -t 128
                                49273 root         20    0    49M    10M select   1   0:01   0.00% /usr/local/sbin/zebra -d{zebra}
                                49273 root         20    0    49M    10M select   2   0:00   0.00% /usr/local/sbin/zebra -d{zebra}
                                49273 root         20    0    49M    10M select   2   0:00   0.00% /usr/local/sbin/zebra -d{zebra}
                                49273 root         52    0    49M    10M select   3   0:00   0.00% /usr/local/sbin/zebra -d{zebra}
                                49273 root         52    0    49M    10M select   0   0:00   0.00% /usr/local/sbin/zebra -d{zebra}
                                49273 root         52    0    49M    10M uwait    2   0:00   0.00% /usr/local/sbin/zebra -d{zebra}
                                62943 root         20    0    29M  9520K kqread   1   0:02   0.00% nginx: worker process (nginx)
                                50947 root         20    0    20M  9508K select   3   0:00   0.00% sshd: admin@pts/0 (sshd)
                                62843 root         20    0    29M  9408K kqread   0   0:02   0.00% nginx: worker process (nginx)
                                50652 root         20    0    19M  9240K select   0   0:00   0.00% sshd: /usr/sbin/sshd [listener] 0 of 10-100 startups (sshd)
                                51355 root         20    0    21M  7952K select   0   0:02   0.01% /usr/local/sbin/ospfd -d
                                62725 root         30    0    28M  7672K pause    3   0:00   0.00% nginx: master process /usr/local/sbin/nginx -c /var/etc/nginx-webConfigurator.conf (nginx)
                                49850 root         20    0    17M  7036K select   1   0:00   0.00% /usr/local/sbin/openvpn --config /var/etc/openvpn/server2/config.ovpn{openvpn}
                                49850 root         52    0    17M  7036K kqread   0   0:00   0.00% /usr/local/sbin/openvpn --config /var/etc/openvpn/server2/config.ovpn{openvpn}
                                61971 root         20    0    19M  6984K select   1   0:02   0.00% /usr/local/sbin/ntpd -g -c /var/etc/ntpd.conf -p /var/run/ntpd.pid{ntpd}
                                50178 root         20    0    20M  6948K select   1   0:00   0.00% /usr/local/sbin/staticd -d
                                52494 root         20    0    19M  6156K select   0   0:01   0.00% /usr/local/sbin/watchfrr -d -r /usr/local/etc/rc.d/frrbBrestartbB%s -s /usr/local/etc/rc.d/frrbBstartbB%s -k /usr/local/etc/rc.d/frrbB
                                62911 root         20    0    17M  5528K piperd   0   0:00   0.00% /usr/local/libexec/sshg-parser
                                
                                
                                1 Reply Last reply Reply Quote 0
                                • stephenw10S
                                  stephenw10 Netgate Administrator
                                  last edited by stephenw10

                                  Not really, that all looks normal. So I'd have to say it's probably kernel memory.

                                  A 5100 here looks like:

                                  last pid: 22317;  load averages:  0.10,  0.09,  0.08                                                                                                                           up 1+03:53:33  21:10:46
                                  220 threads:   5 running, 189 sleeping, 26 waiting
                                  CPU 0:  0.4% user,  0.0% nice,  0.8% system,  0.0% interrupt, 98.8% idle
                                  CPU 1:  0.0% user,  0.0% nice,  0.0% system,  0.0% interrupt,  100% idle
                                  CPU 2:  0.0% user,  0.0% nice,  0.0% system,  0.0% interrupt,  100% idle
                                  CPU 3:  0.0% user,  0.0% nice,  0.8% system,  0.0% interrupt, 99.2% idle
                                  Mem: 41M Active, 133M Inact, 456M Wired, 243M Buf, 3215M Free
                                  Swap: 1527M Total, 1527M Free
                                  
                                    PID USERNAME    PRI NICE   SIZE    RES STATE    C   TIME    WCPU COMMAND
                                    288 root         52    0   146M    51M accept   0   0:12   0.00% php-fpm: pool nginx (php-fpm){php-fpm}
                                  39028 root         52    0   146M    50M accept   2   0:19   0.00% php-fpm: pool nginx (php-fpm){php-fpm}
                                  32595 root         52    0   145M    48M accept   1   0:06   0.00% php-fpm: pool nginx (php-fpm){php-fpm}
                                    289 root         52    0   144M    47M accept   2   0:12   0.00% php-fpm: pool nginx (php-fpm){php-fpm}
                                  66903 root         52    0   148M    47M accept   0   0:04   0.00% php-fpm: pool nginx (php-fpm){php-fpm}
                                  59263 root         21    0    70M    46M nanslp   3   2:15   0.02% php_wg: WireGuard service (php_wg)
                                    287 root         20    0   103M    26M kqread   2   0:03   0.00% php-fpm: master process (/usr/local/lib/php-fpm.conf) (php-fpm)
                                  73516 unbound      20    0    62M    26M kqread   1   0:00   0.00% /usr/local/sbin/unbound -c /var/unbound/unbound.conf{unbound}
                                  73516 unbound      20    0    62M    26M kqread   0   0:00   0.00% /usr/local/sbin/unbound -c /var/unbound/unbound.conf{unbound}
                                  73516 unbound      20    0    62M    26M kqread   3   0:00   0.00% /usr/local/sbin/unbound -c /var/unbound/unbound.conf{unbound}
                                  73516 unbound      20    0    62M    26M kqread   2   0:00   0.00% /usr/local/sbin/unbound -c /var/unbound/unbound.conf{unbound}
                                  99809 root         20    0    71M    20M uwait    0   0:01   0.03% /usr/local/libexec/ipsec/charon --use-syslog{charon}
                                  99809 root         20    0    71M    20M uwait    1   0:01   0.00% /usr/local/libexec/ipsec/charon --use-syslog{charon}```
                                  1 Reply Last reply Reply Quote 0
                                  • G
                                    gabacho4 Rebel Alliance
                                    last edited by

                                    Good to know. I’ll just restart it at the next opportunity I have when I won’t have to endure the sound of voices suddenly crying out in terror as the Netflix is suddenly silenced.

                                    1 Reply Last reply Reply Quote 1
                                    • Bob.DigB
                                      Bob.Dig LAYER 8 @stephenw10
                                      last edited by Bob.Dig

                                      @stephenw10 said in 22.05 snaps paused?:

                                      So it doubled after running the upgrade and went back to the previous use after rebooting a second time?

                                      Yes. I am just mentioning it again because there might be installations where this is troublesome? But from now on I will be silent about the RAM usage just after upgrading. In the end, RAM is there to be used anyway. 😉

                                      1 Reply Last reply Reply Quote 0
                                      • First post
                                        Last post
                                      Copyright 2025 Rubicon Communications LLC (Netgate). All rights reserved.