High memory usage/leak on PF+ 22.05
-
Doing some research into the Wired memory, it looks like the kernel decides how much memory it will allocate to itself, and with ZFS sometimes it chooses to use too much. One solution I've seen is to edit /boot/loader.conf and configure vfs.zfs.arc_max to a specific acceptable value.
Is there a way to edit the vfs.zfs.arc_max setting through pfsense without manually editing the loader.conf file, which I presume gets overwritten at some point? I didn't see it in the tunable section, but wasn't sure if it may be hidden somewhere I'm not looking.
I was going to try and set it to: vfs.zfs.arc_max="12G"
That would limit it to about half the total memory, plus what is used by other services, which should still leave me a solid at least 25-35% free. I also don't want to set it incorrectly and end up with a system that isn't able to boot to the OS.
I don't mind if ZFS prefers to use more memory, but I don't like it running that close to max if other services need it and ZFS doesn't release enough in time.
-
Create the file /boot/loader.conf.local and add custom loader variables there. That is kept across upgrades etc and not overwritten by other setting changes.
Steve
-
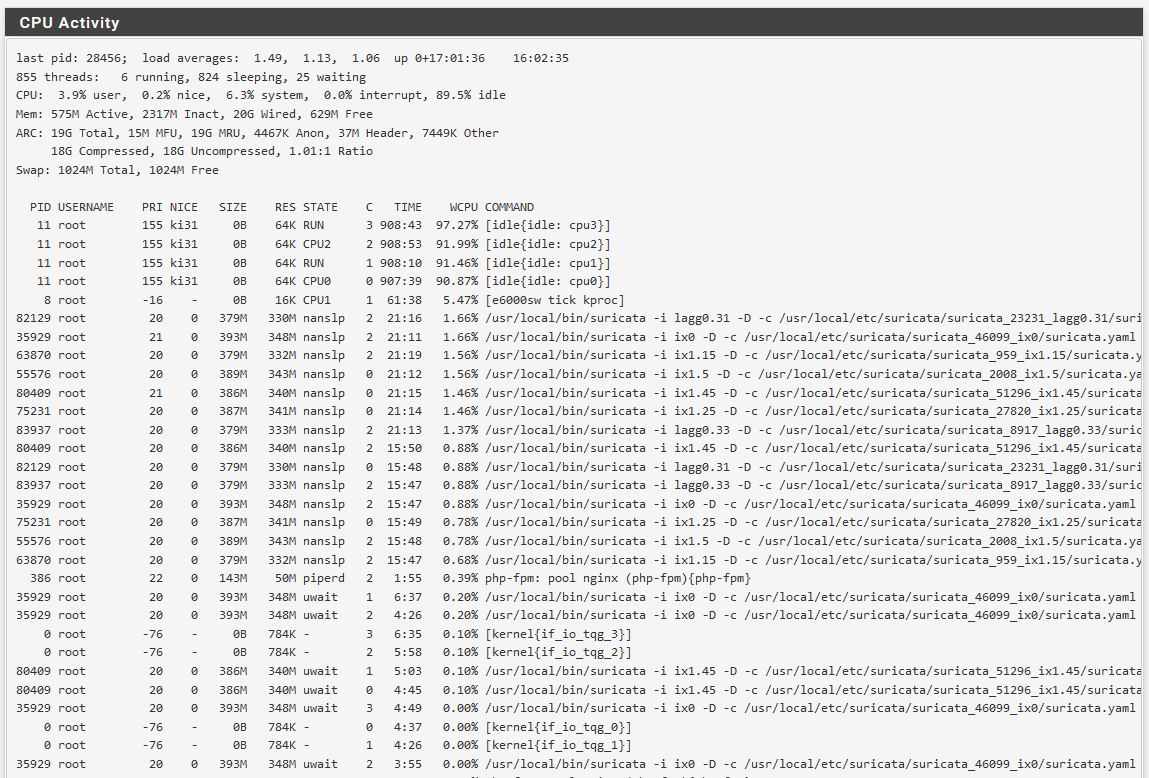
Something is wrong with your Suricata configuration on that box. Look at how many duplicate Suricata processes you have running. Not saying that is the only cause of your memory issue, but it certainly is one of them. For example, I see four duplicate Suricata processes for VLAN 45. And I see two each for VLAN 14 and VLAN 25. You should have only a single Suricata instance running per interface (or VLAN).
-
@stephenw10 Thanks, that's what I needed. Last night I added vfs.zfs.arc_max="12884901888" to the /boot/loader.conf file just to test. I watched as the ARC slowly increased the memory usage again, maybe 1-3M every second or two. It leveled off at 12G, as configured. I'm not sure if maybe the updated kernel released with 22.05 changed how it handles not having a configured max arc setting, and increased the usage to 20G out of 24G total memory.
I know from reading what I could find that ARC will release the memory when needed, but not always in time. I definitely don't want to get to where swap memory is being used. I'm going to move the config line into the /boot/loader.conf.local like you recommended to stay persistent across updates/upgrades. I think I'm good to go now, and rather prefer being able to control the max arc storage. That would be a great setting to add into the tunable advanced screen.
-
@bmeeks I noticed that too, but when I looked into it further, the duplicate entries for each VLAN are running under the same process (same PID), but listed with different states (nanslp, uwait, etc). When I check the process list (ps aux), there is only a single suricata process for each interface configured for monitoring. So, I can't explain why it lists like that on the activity screen, but it looks to be ok overall. Each instance is using around 360M, which I'm fine with since I have 24G total.
-
@sgnoc said in High memory usage/leak on PF+ 22.05:
@bmeeks I noticed that too, but when I looked into it further, the duplicate entries for each VLAN are running under the same process (same PID), but listed with different states (nanslp, uwait, etc). When I check the process list (ps aux), there is only a single suricata process for each interface configured for monitoring. So, I can't explain why it lists like that on the activity screen, but it looks to be ok overall. Each instance is using around 360M, which I'm fine with since I have 24G total.
Doh! My bad, that would be the separate threads assigned to a particular interface. So there appear to be 4 threads running on the VLAN 45 interface. That's fine.
-
Hmm, that's interesting. What size is the boot drive on that 7100?
Steve
-
@stephenw10 The freebsd-boot partition is 512K and is on the same drive as the OS, which is a 256G M.2 SATA drive. The /boot folder is around 105M, though.
-
Thanks. Not something we've seen here but we are investigating.
-
Sounds good. Thanks for the help. With the /boot/loader.conf.local variable change, I've been running for more than a day now and it all seems stable with much lower memory utilization. I feel a lot more comfortable with 58% utilized compared to the 88%, especially if I have a sudden increase in traffic or encrypted tunnels, I know there are enough resources available to handle anything thrown at it.