92% mem at all times after virtualizing the Router
-
Hi all,
I didn't notice til this morning as everything is running fine but I can hear a LOT of chugging from the virtual machine server (esxi 6.7).
Recently I had an issue with 99% cpu on pfsense when it was on a standalone box and the fans were crazy loud, that was a logging compression issue... which was fixed.
so I decided to check the router in this case. The chugging (hard drive sounds) stops and starts up again sometimes so it might not even be related to pfsense but the memory is still spiked. The server is in a closet next to my desk so I'm next to it every day for hours and this is out of the ordinary.
I donno if this issue has been happening since the change over last weekend or just this morning. I tried rebooting but no change.
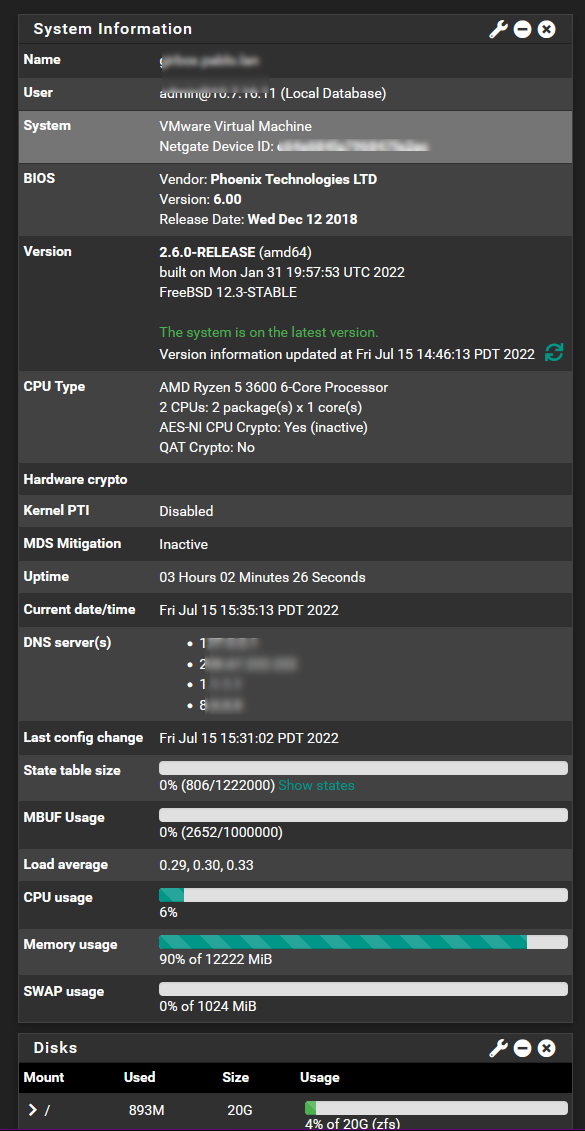
It was on a quad core 22gb mem standalone pc before and I moved it over to an esxi 6.7 server where most of my labs are. I moved the 3pci NICs over as well so from the router's point of view, nothing has really changed. Everything is working fine but I don't remember the memory ever being this high. I did check on it a few days after the change over and it was using about 70% of the 6gb RAM i gave it initially, so I upped it to 12 and its now using 92-94% always.
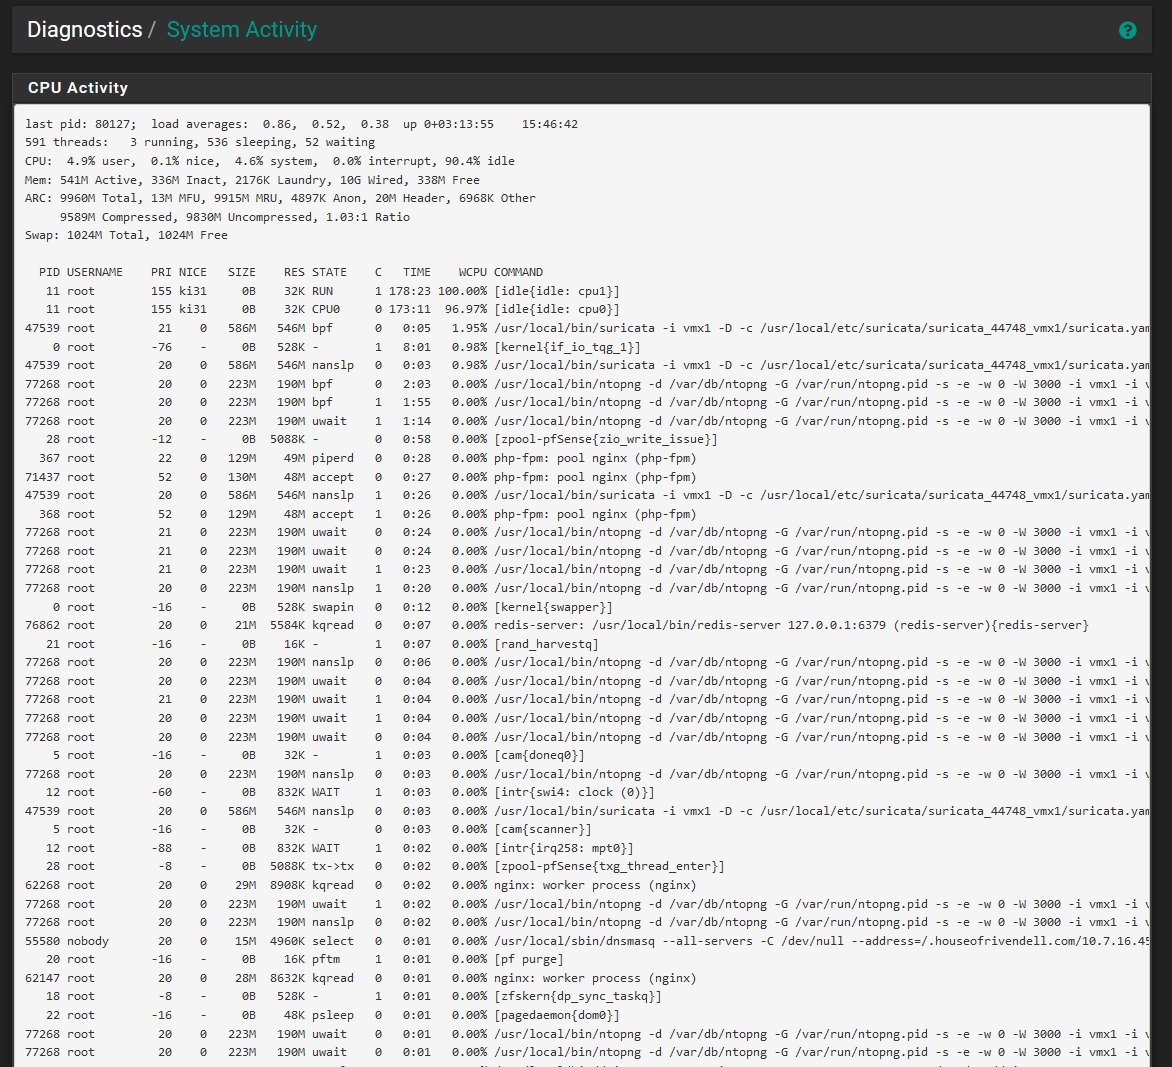
Is this normal? I checked the running processes and Suricata seemed to be the highest usage so I disabled it but it made no difference, so i turned it back on. Any thoughts on this? thx!
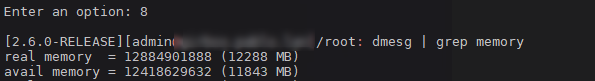
the UI shows 94% right now but when I check in CLI its not really? so im confused.
-
Disabling Suricata and ntop-ng actually made no difference?
Did you reboot with those disabled?
You might also try this sicne you're running ZFS: https://forum.netgate.com/post/1051183
Steve
-
@stephenw10 hey thanks.
I only stopped suricata for the test and confirmed it wasnt running anymore with no change. I didnt reboot and check tho.I did try adjusting that setting in the thread you sent.
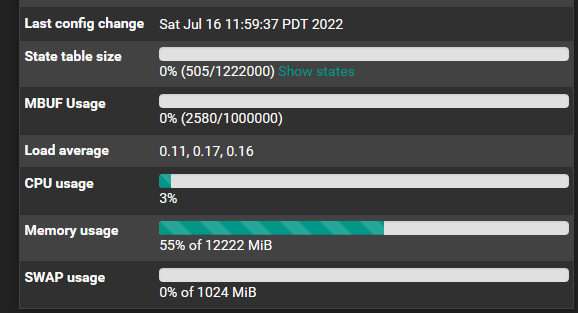
at 55% now. So this feels better.
-
@stephenw10 ya its back up to 92% again :/
-
@sdok What's chewing up the RAM? The System Activity page will help you with that.
-
@sdok
To get the processes with the highest mem usage, enter the command prompt in the console and runtop -o res -
@rcoleman-netgate I did look there initially and posted a screenshot of it up top. I couldnt tell what was taking ram up there really. Looked more like it was sorted by cpu usage.
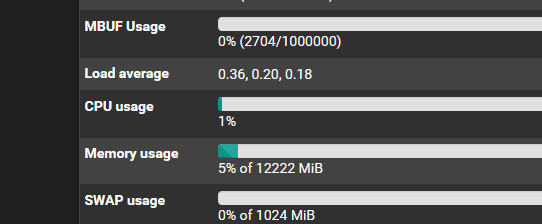
I disabled suricata and ntopng. Now memory is showing 5%. So I'll re-enable suricata today since its been running almost a day now at 5%. I dont really use ntopng anymore so if thats causing it, I can just leave that off.
-
@sdok looks like ntopng was the problem. just posting the resolution in case anyone else has the issue. thx for the replies.