pfSense Plus
-
Your reboot times from the posted log snippet do not line up as I would expect with the daily rules update jobs (every 6 hours). If Suricata was the root cause here I would expect the reboot times to be pretty much identical within 30 seconds or so. There is a random 30 seconds added to the rules update time to help balance the load on the update servers by not having all the configured Suricata installs out there on pfSense all hammer the server at the same time.
Notice in your original post your log shows the gateway alarm and other failures occurring at 04:55 or so, and then the reboot being commanded at 04:56.22. That is quite a long time from 4:25 when your Suricata rules job ran. Rules update jobs typically take only about a minute or two to complete. There is about 30 minutes of normal operation between those two events.
Now perhaps you have some Suricata rule triggering that is resulting in blocked pings. Have you investigated that avenue?
-
@bmeeks I did suspect it could be a signature ID that I'm blocking but I didn't have much to go on but their names and what I could search out. The below are the only drops I have entered into SID Mgmt:
ET SCAN Sipvicious Scan
ET SCAN Sipvicious User-Agent Detected (friendly-scanner)
ET SCAN Suspicious inbound to MSSQL port 1433
ET SCAN Suspicious inbound to Oracle SQL port 1521
SURICATA STREAM 3way handshake SYNACK with wrong ack
ET SCAN Suspicious inbound to mSQL port 4333
ET COMPROMISED Known Compromised or Hostile Host Traffic group 3
ET COMPROMISED Known Compromised or Hostile Host Traffic group 4
ET COMPROMISED Known Compromised or Hostile Host Traffic group 5
ET COMPROMISED Known Compromised or Hostile Host Traffic group 6
ET SCAN Suspicious inbound to mySQL port 3306
SURICATA Applayer Detect protocol only one direction
SURICATA STREAM Packet with invalid timestamp
SURICATA STREAM bad window update
ET SCAN Suspicious inbound to PostgreSQL port 5432
SURICATA ICMPv4 invalid checksum
SURICATA STREAM ESTABLISHED SYNACK resend with different ACK
SURICATA STREAM ESTABLISHED SYNACK resend with different seq
SURICATA STREAM ESTABLISHED SYN resend
SURICATA STREAM FIN out of window
SURICATA STREAM TIMEWAIT ACK with wrong seq
SURICATA TCP header length too small
SURICATA TLS invalid handshake message
SURICATA TLS invalid record/traffic
SURICATA STREAM CLOSEWAIT FIN out of windowI'm wondering if it could be the SURICATA ICMPv4 invalid checksum. This is a head scratcher for me.
-
@newuser2pfsense said in pfSense Plus:
@bmeeks I did suspect it could be a signature ID that I'm blocking but I didn't have much to go on but their names and what I could search out. The below are the only drops I have entered into SID Mgmt:
ET SCAN Sipvicious Scan
ET SCAN Sipvicious User-Agent Detected (friendly-scanner)
ET SCAN Suspicious inbound to MSSQL port 1433
ET SCAN Suspicious inbound to Oracle SQL port 1521
SURICATA STREAM 3way handshake SYNACK with wrong ack
ET SCAN Suspicious inbound to mSQL port 4333
ET COMPROMISED Known Compromised or Hostile Host Traffic group 3
ET COMPROMISED Known Compromised or Hostile Host Traffic group 4
ET COMPROMISED Known Compromised or Hostile Host Traffic group 5
ET COMPROMISED Known Compromised or Hostile Host Traffic group 6
ET SCAN Suspicious inbound to mySQL port 3306
SURICATA Applayer Detect protocol only one direction
SURICATA STREAM Packet with invalid timestamp
SURICATA STREAM bad window update
ET SCAN Suspicious inbound to PostgreSQL port 5432
SURICATA ICMPv4 invalid checksum
SURICATA STREAM ESTABLISHED SYNACK resend with different ACK
SURICATA STREAM ESTABLISHED SYNACK resend with different seq
SURICATA STREAM ESTABLISHED SYN resend
SURICATA STREAM FIN out of window
SURICATA STREAM TIMEWAIT ACK with wrong seq
SURICATA TCP header length too small
SURICATA TLS invalid handshake message
SURICATA TLS invalid record/traffic
SURICATA STREAM CLOSEWAIT FIN out of windowI'm wondering if it could be the SURICATA ICMPv4 invalid checksum. This is a head scratcher for me.
Rules that trigger a DROP of traffic will print the alert in red text on the ALERTS tab.
@newuser2pfsense said in pfSense Plus:
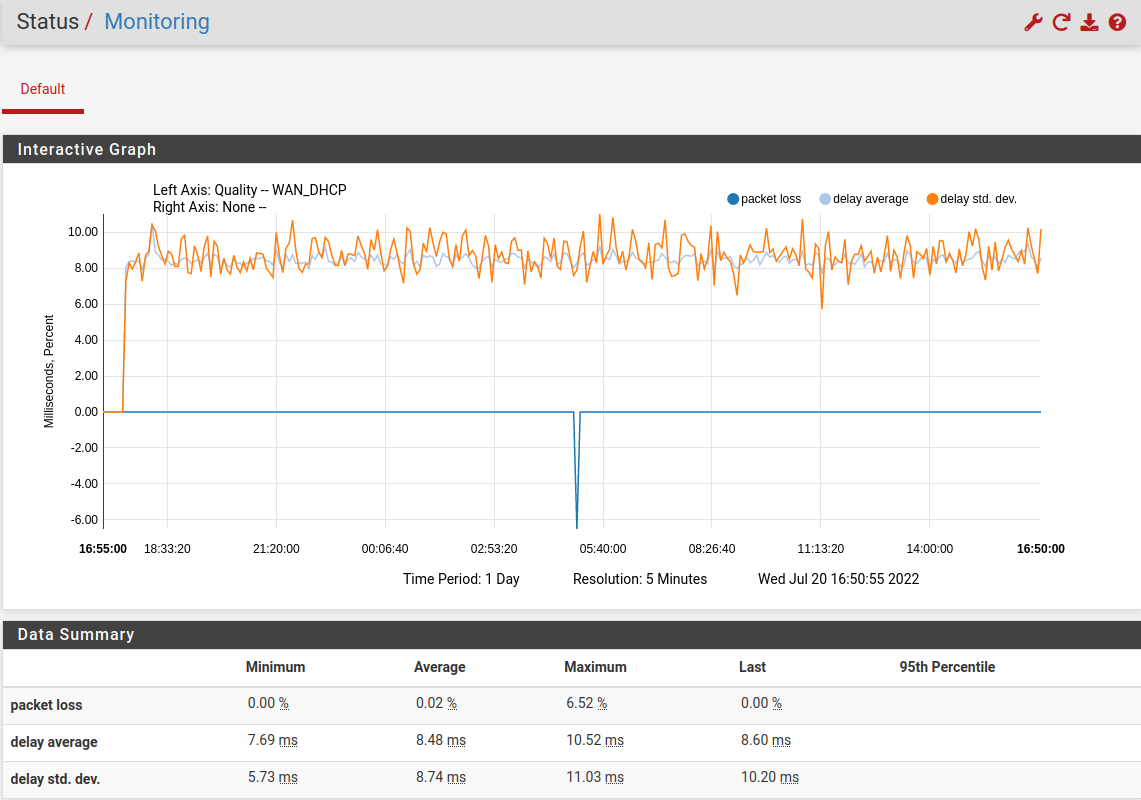
I have been watching the restarts since October of 2021 until now. Hoping for a solution.
This statement is puzzling and I can't reconcile it with your statement in the original post at the top of this thread where you say you installed Suricata two days ago and configured it. If you have been having to reboot to restore connectivity since October of 2021, yet you only installed and configured Suricata two days ago, I'm having trouble connecting Suricata directly to your issue. It seems I am misunderstanding something in your timeline of events.
-
@bmeeks I'm sorry for the confusion. Yes, I've been using Suricata for several years with the issue we've been discussing - connectivity drops.
I wanted to update to pfSense+ from the community edition so a few days ago now I installed a fresh 2.6.0 CE and updated successfully to pfSense+ 22.05. I ran pfSense+ without Suricata for a couple of days with no issues, no connectivity drops at all and no CRON/script restarts. It was working well.
I then installed Suricata on pfSense+ 22.05 and configured it on all 3 of the interfaces and began seeing the same issue that I had seen in the past - daily connectivity drops causing my CRON/script to restart pfSense. I was trying to figure out what was going on and I narrowed it down to Suricata. That's when I posted. I now know not to enable Suricata on the WAN which in the last day has worked, at least so far. I hope that makes a little more sense.
I do see the dropped alerts in red text on the ALERTS tab.
Are there any other reasons why I would be getting the drops even with the Live Rule Swap on Update enabled? Just wondering. I'm now more than just a little curious.
-
@newuser2pfsense said in pfSense Plus:
@bmeeks I'm sorry for the confusion. Yes, I've been using Suricata for several years with the issue we've been discussing - connectivity drops.
I wanted to update to pfSense+ from the community edition so a few days ago now I installed a fresh 2.6.0 CE and updated successfully to pfSense+ 22.05. I ran pfSense+ without Suricata for a couple of days with no issues, no connectivity drops at all and no CRON/script restarts. It was working well.
I then installed Suricata on pfSense+ 22.05 and configured it on all 3 of the interfaces and began seeing the same issue that I had seen in the past - daily connectivity drops causing my CRON/script to restart pfSense. I was trying to figure out what was going on and I narrowed it down to Suricata. That's when I posted. I now know not to enable Suricata on the WAN which in the last day has worked, at least so far. I hope that makes a little more sense.
I do see the dropped alerts in red text on the ALERTS tab.
Okay, that helps me understand the timeline better.
Those Suricata Stream Events rules such as those beginning with SURICATA STREAM can be somewhat prolific. I would NOT set any of those rules to DROP. If you want to see that traffic, leave them at alert. But honestly, a lot of users don't use those at all as they tend to be somewhat noisy.
-
@bmeeks Are there any other reasons why I would be getting the connectivity drops even with the Live Rule Swap on Update enabled? Just wondering. I'm now more than just a little curious. I'm still not going to enable Suricata on the WAN but I guess I'm just trying to understand better and what could actually be causing it.
-
@newuser2pfsense said in pfSense Plus:
@bmeeks Are there any other reasons why I would be getting the connectivity drops even with the Live Rule Swap on Update enabled? Just wondering. I'm now more than just a little curious. I'm still not going to enable Suricata on the WAN but I guess I'm just trying to understand better and what could actually be causing it.
I see and respond to quite a number of different posts day to day, and I sometimes get the facts from each co-mingled in my brain.
Looking again in detail at your first post, what I do not see in your log snippets is any actual interface down/up events being logged. If netmap was bringing down the interface, that would be noted in the logs. So that proves the Live Rule Swap code is not actually restarting Suricata and thus netmap is not cycling the interface.
Not all hardware NICs are exactly the same. They can have different firmware versions and thus interact differently with the generic FreeBSD NIC driver for that family. It is not out of the realm of possibility that your particular NIC is not behaving well when in netmap mode. Do you have the same type of NIC on all interfaces, or do they differ? Is your WAN NIC perhaps a "notorious" Realtek device? Those can be really squirrelly on FreeBSD.
-
@bmeeks I have 2, 4 port, GbE, SuperMicro nics installed; same models - SUPERMICRO AOC-SGP-I4. I believe they are both Intel based. My WAN is on one nic by itself and the LAN and WLAN are on the other nic.
-
@newuser2pfsense said in pfSense Plus:
@bmeeks I have 2, 4 port, GbE, SuperMicro nics installed; same models - SUPERMICRO AOC-SGP-I4. I believe they are both Intel based. My WAN is on one nic by itself and the LAN and WLAN are on the other nic.
That card should be using em driver as best I can determine. There are at least two open FreeBSD bugs against that chipset (not Supermicro itself but the underlying Intel chip on the NIC).
This one seems similar to what you are seeing, but not exactly the same: https://bugs.freebsd.org/bugzilla/show_bug.cgi?id=235031.
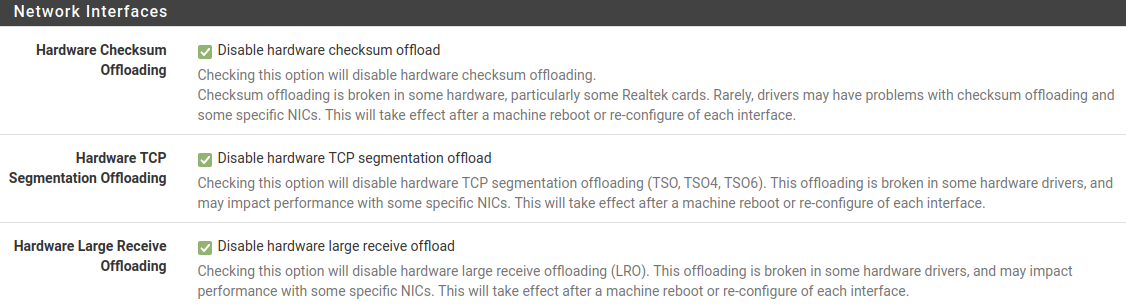
Do you have all of the hardware offloading disabled for the NICs?
The only connection to Suricata I can see would be the use of netmap for Inline IPS operation. You could try swapping over to Legacy Blocking Mode for a test and enable the option for "Block DROPS Only". That would use your existing SID MGMT configuration just without netmap and Inline IPS Mode. If things are stable there, then you have your answer -- it would be a netmap compatibility issue with your NIC.
-
@bmeeks pfSense is showing me it's using igb (igb0, igb1, igb7).
Here is the offloading:
Is there a specific Intel based NIC card that you would recommend that doesn't have any issues with pfSense? Just wondering.