Gre tunnel to protect IP.
-
You need to have a routed subnet. So that means the provider at the remote side needs to route the /28 to you via the WAN IP which must be in a different subnet.
Then you can route traffic to/from that subnet however you wish. Including routing it across the GRE tunnel and using it directly on clients at the local end.Steve
-
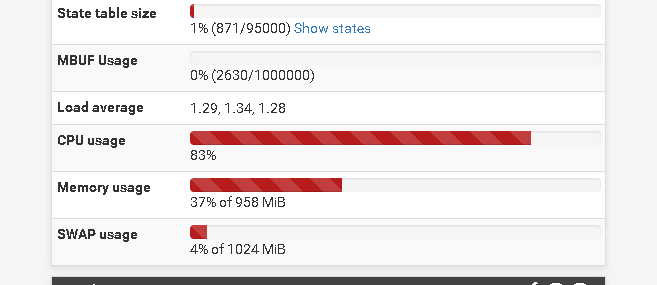
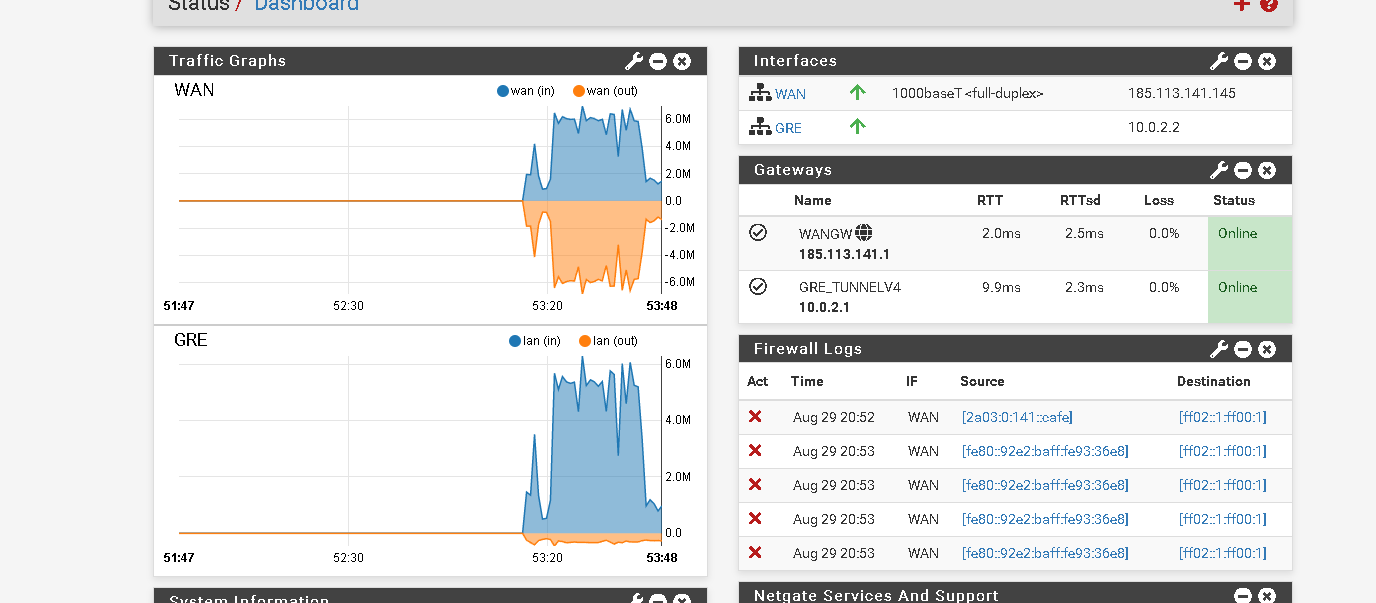
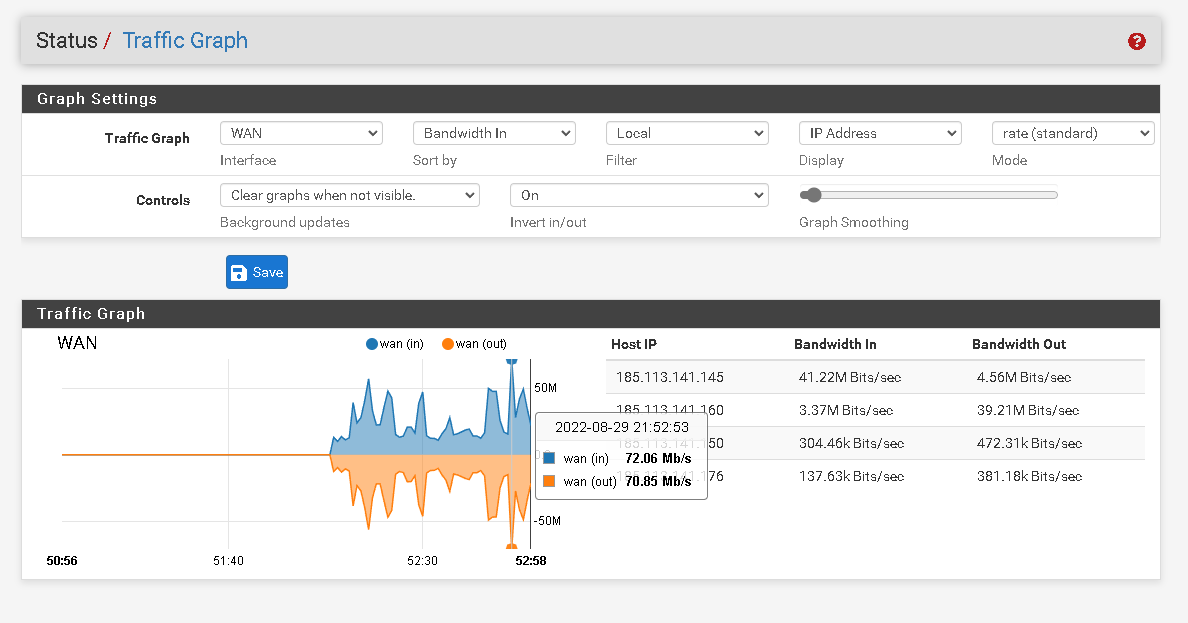
I've been having a problem which is high CPU utilization on the remote host. The system only has 1 vCPU 3.40Ghz but I think I must have something wrong. I had to check and in the traffic graph option the wan interface of the pfsense remote is using a lot of bandwidth and in the dashboard it doesn't happen.
I send the prints below so you can better understand the problem.Thanks
-
Hmm, curious. Those graphs should show the same data.
What are the IPs shown as generating the traffic there? .145 and .160?
Check the state tables. What are the states being created by that?
Steve
-
The ip .145 is the remote pfsense ip used only to access the pfsense graphical interface and to establish the gre tunnel with the local pfsense. The other ip's are from virtual machines that probably run game servers.
Thanks
States: https://pastebin.com/JzsHJezE
-
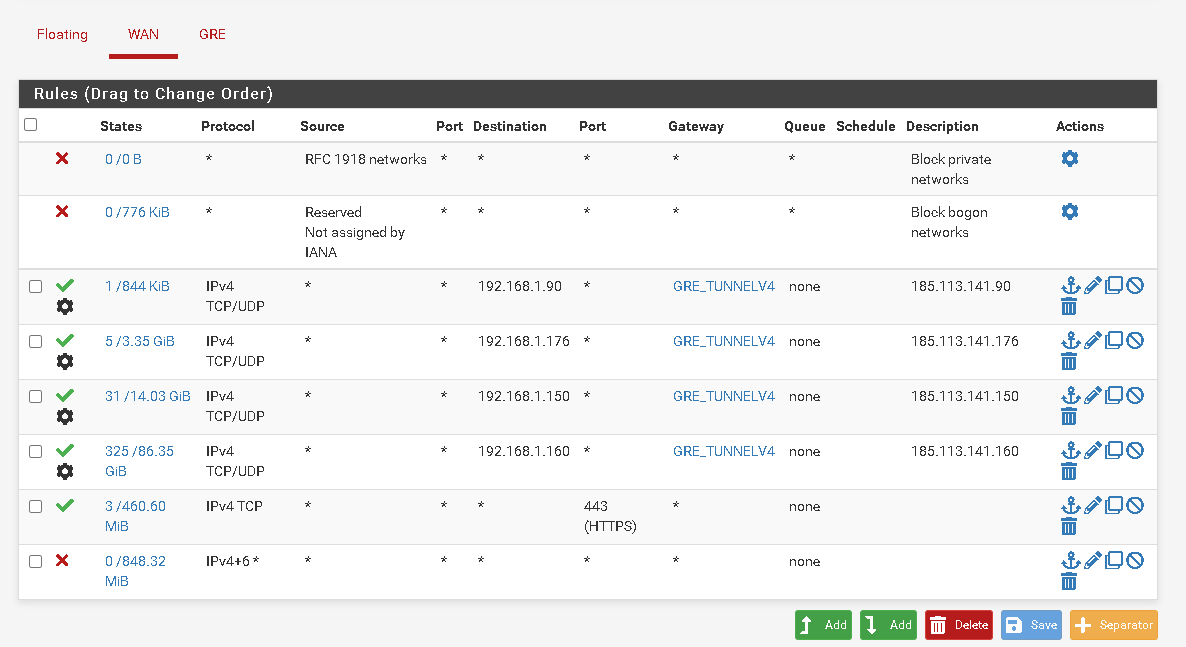
Hmm, all of those states are to/from one host at .160.
No traffic is show from .145 at all.
There is no GRE state on WAN and that should always be there.
Was the table filtered when you took that data?What is the WAN bandwidth at the local end? Or the bandwidth on GRE?
Steve
-
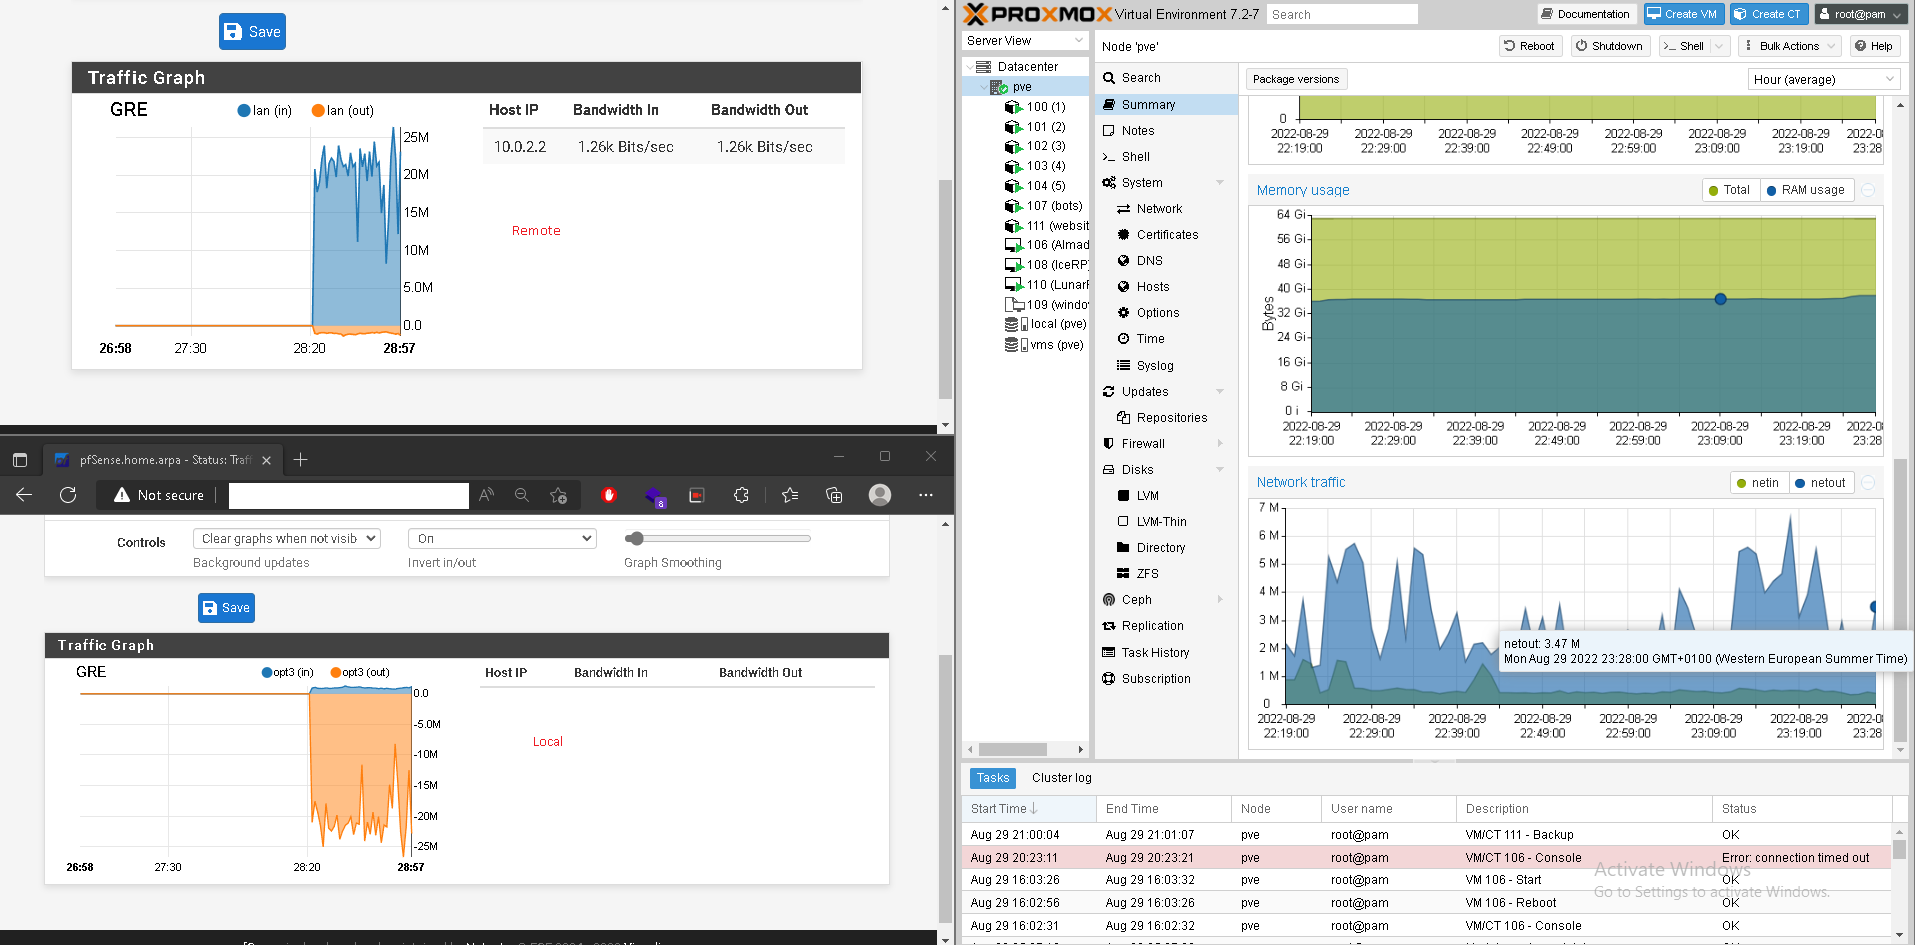
On the proxmox server the traffic seems to be clean and it's the only machine I have connected to the local pfsense so the problem I think must be in the pfsense. It looks like it's tripling the bandwidth coming out of the server inside the gre tunnel.
-
Mmm, but you're seeing ~25Mbps there. Check the history in Status > Monitoring for the GRE interface at each end. That should be showing the same thing.
-
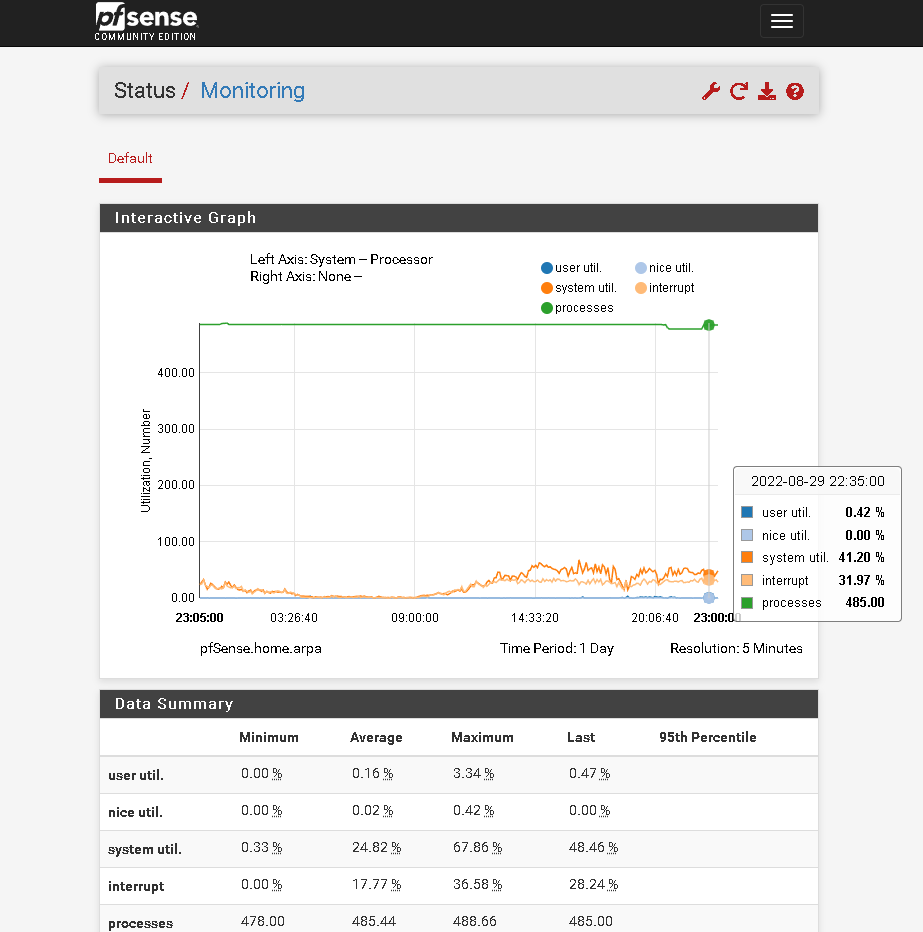
Remote pfsense
Local pfsense
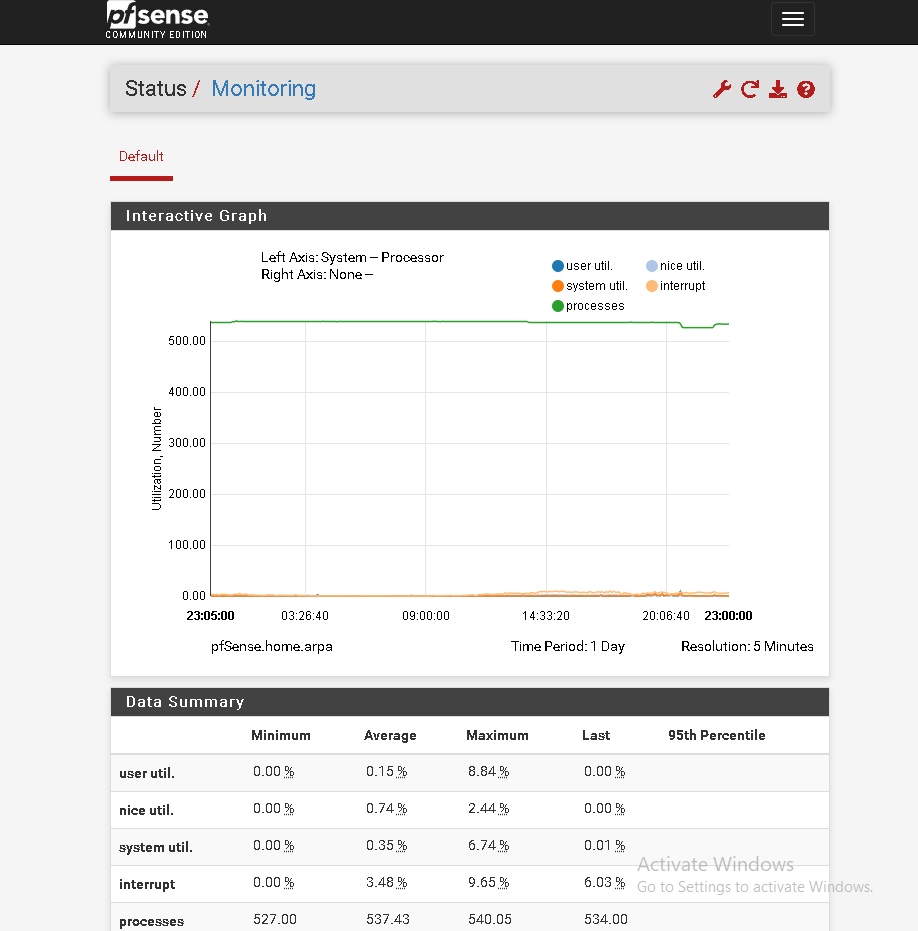
I didn't quite understand what you meant. In status -> monitor I only have this. Thanks
-
Sorry I mean hit the 'wrench' icon and update the graphs for traffic on the GRE interface. Like:
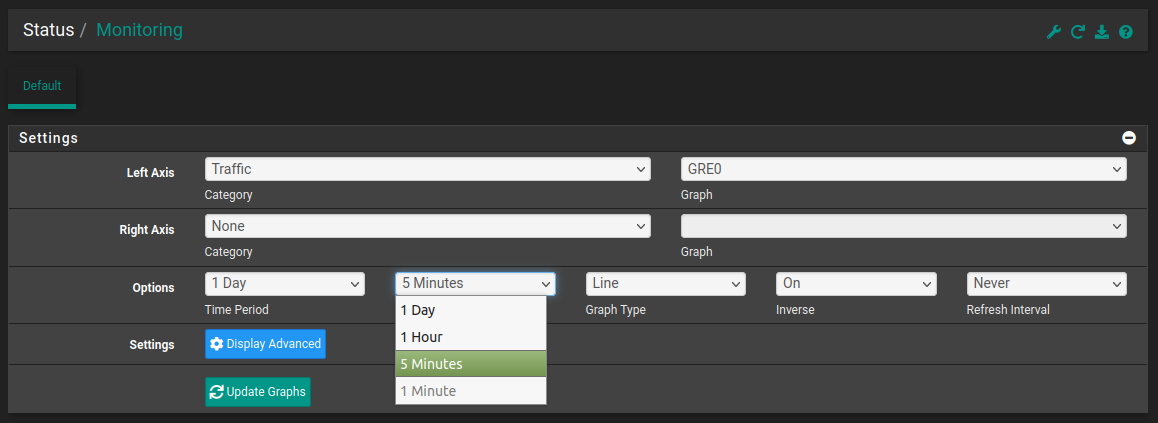
-
It's a little different on one site it's using 6 mb/s on another 60 mb/s.
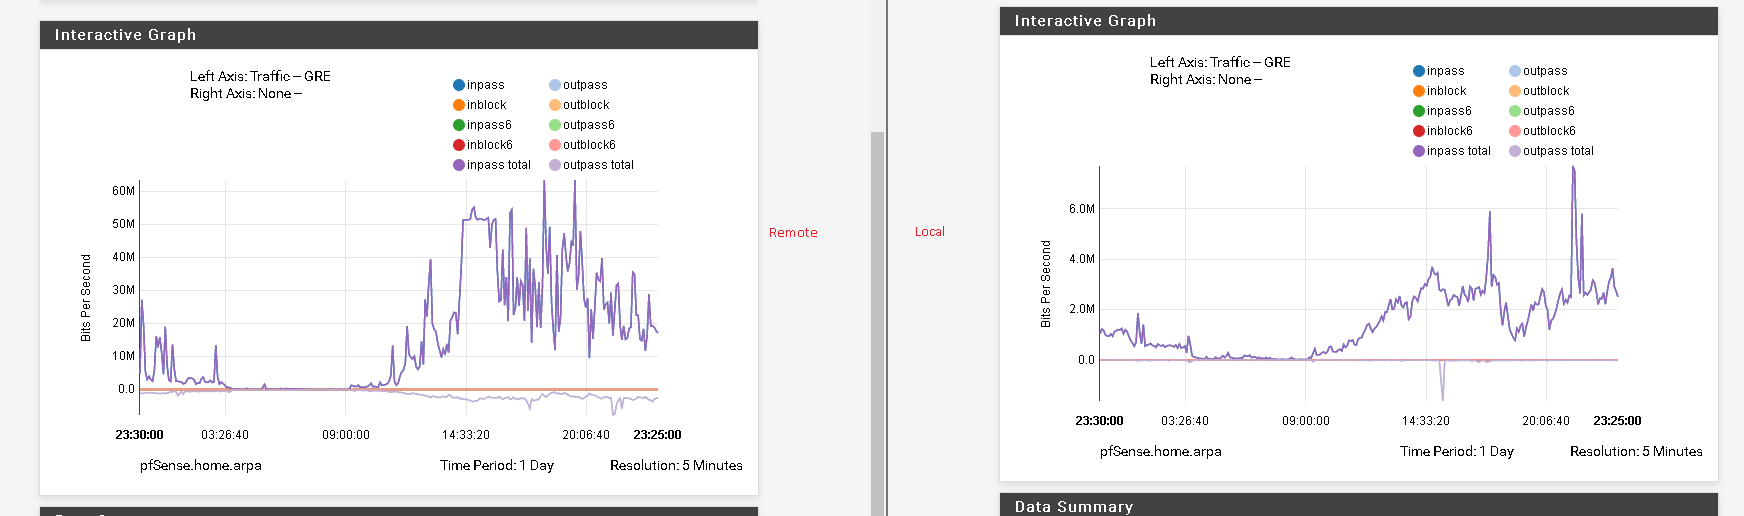
Thanks
-
Hmm, I assume the 6Mbps side is local, where the servers are?
There is almost no outbound traffic there which seems odd. I would expect games servers to send more than they receive.
The traffic across the tunnel should show as reversed also. I could believe that's shown in the outbound at the remote side. Hard to say because the graph is swamped by the inbound. You can disable that by clicking the dot there.
I wonder if you just have a lot of inbound GRE traffic that's being incorrectly passed?
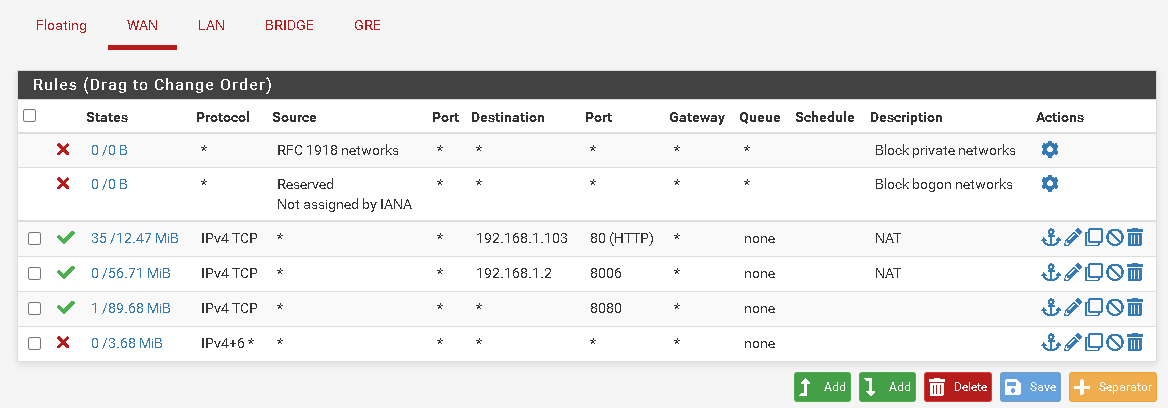
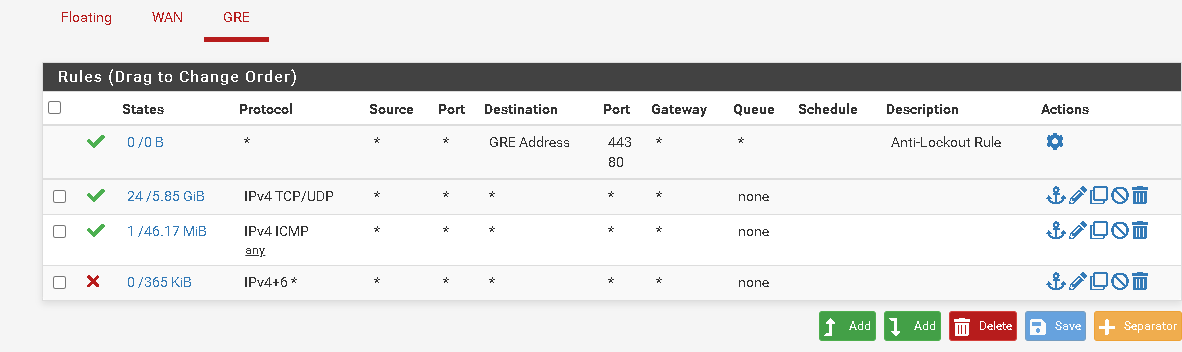
Check the state table for all GRE states at the remote site. If there is any GRE traffic from anywhere but your own local site then make sure the WAN firewall rules are not passing that.
Steve
-
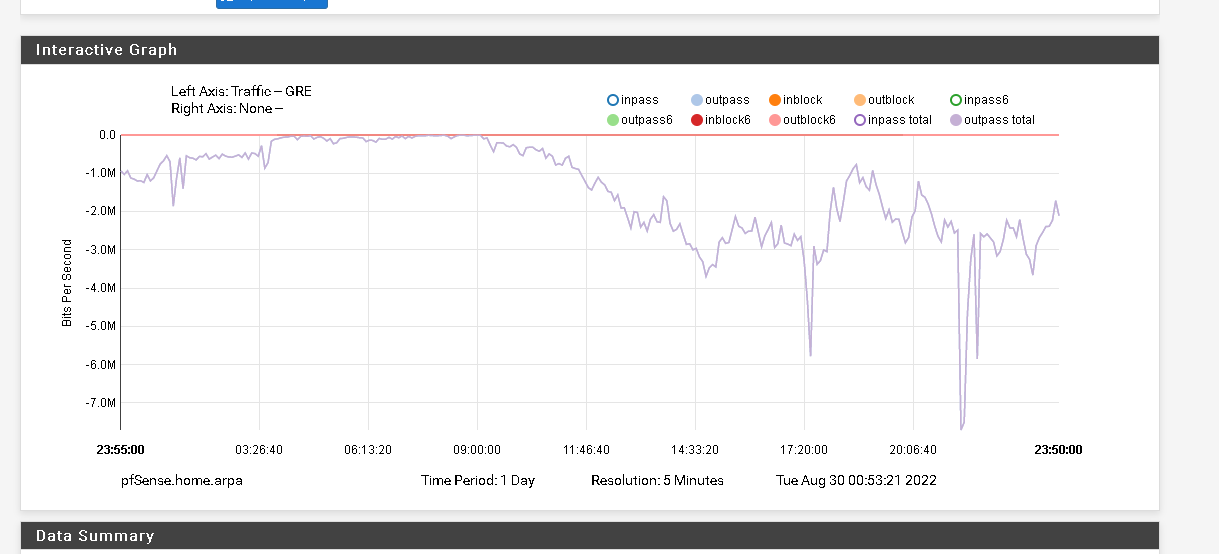
Yes, the 6 mbps is the local side where the server is.
Local Side
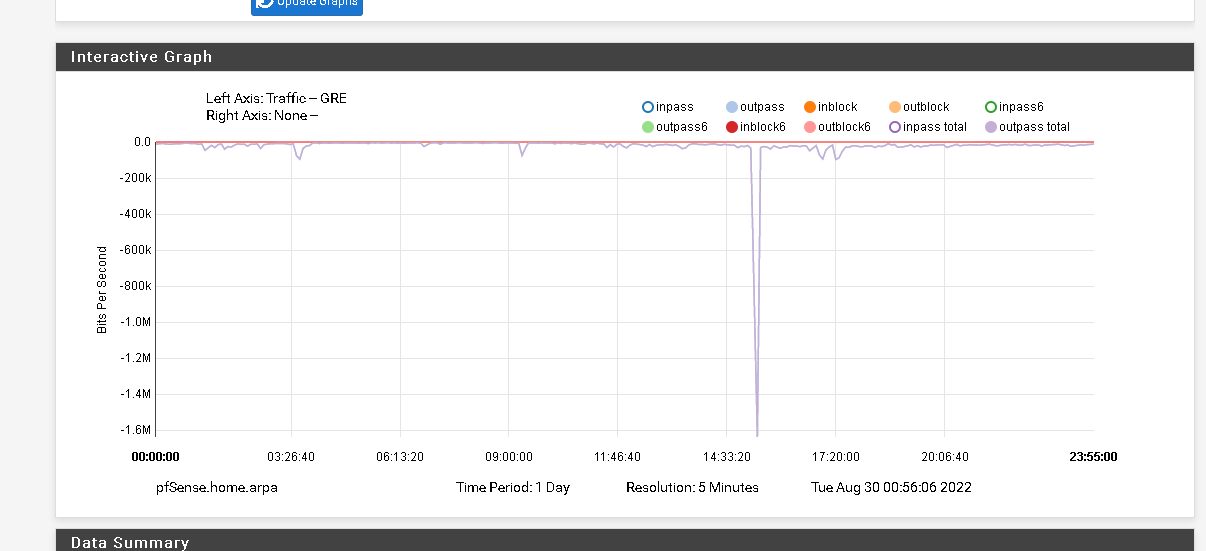
Remote Side
@stephenw10 said in Gre tunnel to protect IP.:
I wonder if you just have a lot of inbound GRE traffic that's being incorrectly passed?
Yeah probably, I'm not very expert yet.
GRE States on remote side: https://pastebin.com/2ZyHg09V
Thanks
-
There are no GRE states shows there, only TCP/UDP states on the GRE interface.
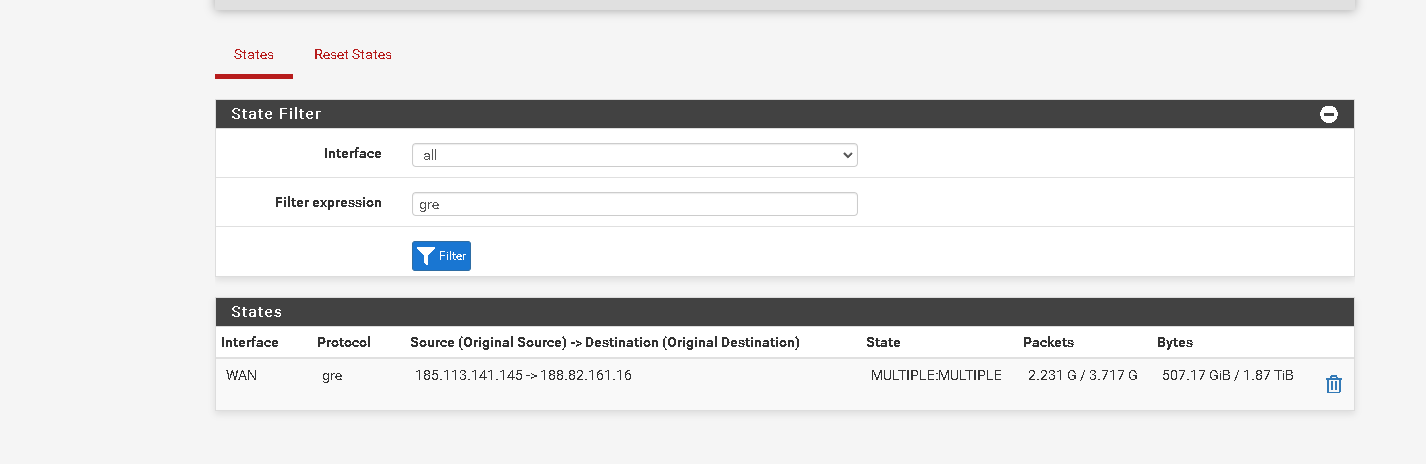
You need to look for gre states on WAN like:
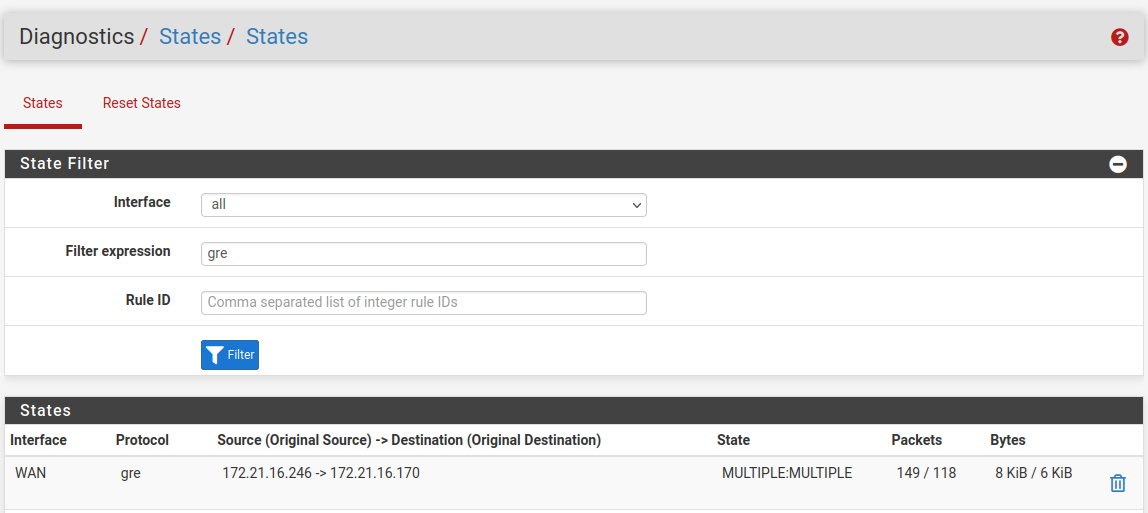
-
-
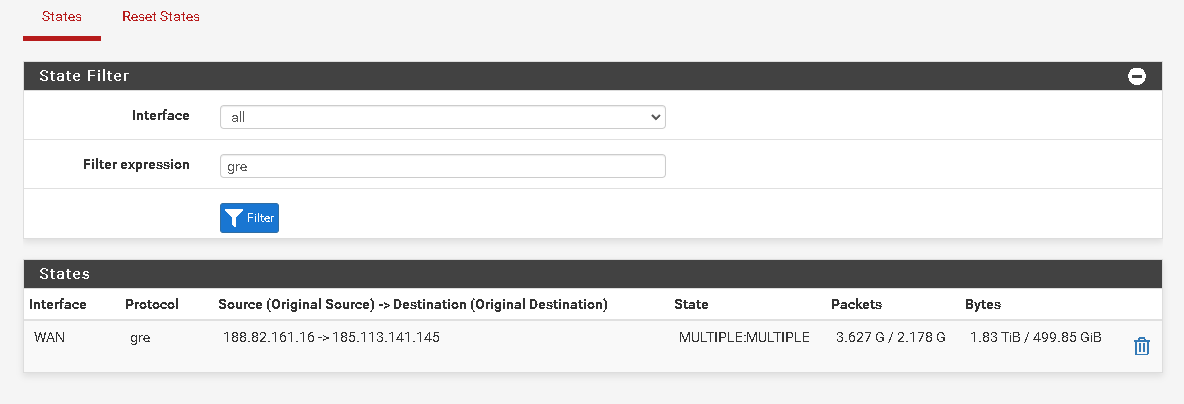
Mmm, that looks OK then. The end end show similar states? Data ratios the same?
-
-
Ok that looks good.
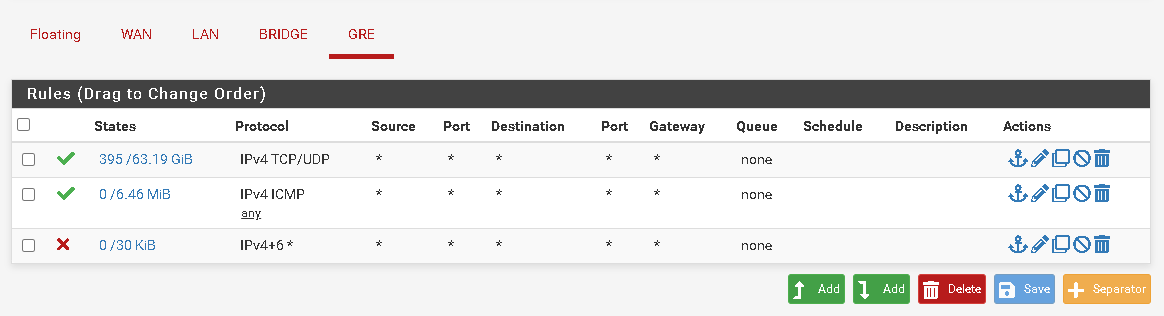
Are you still seeing the extra traffic on the remote WAN? It could be there is simply no traffic right now.
Make sure the rules allowing GRE on WAN there only allow it from the local site.
Steve
-
-
Ok, so in that case the local site always has to establish the tunnel since it is not allowing gre in at all. That's fine.
What rules do you have at the remote site? -