4100 Max - CPU and Temps
-
I just put my new 4100 Max into production (at home) and the temps are running at 50c, CPU usage fluctuates from 30-99% a lot. I'm getting the CPU usage from the graph on the front page. The unit is in a cooler basement.
I have 4 VLANs with light traffic, other than an NVR that as two cameras that are constantly recording. I'm running WireGuard (no connections right now) and pfBlockerNG.
Switch Port 24 has all VLANs tagged and 24 uplinks to LAN1 on the 4100.
last pid: 54563; load averages: 1.16, 1.45, 1.22 up 0+10:19:43 10:02:28 540 threads: 3 running, 504 sleeping, 33 waiting CPU: 27.1% user, 0.1% nice, 18.9% system, 0.0% interrupt, 53.8% idle Mem: 115M Active, 548M Inact, 756M Wired, 2386M Free ARC: 219M Total, 120M MFU, 93M MRU, 677K Anon, 1247K Header, 3769K Other 114M Compressed, 366M Uncompressed, 3.20:1 Ratio PID USERNAME PRI NICE SIZE RES STATE C TIME WCPU COMMAND 11 root 155 ki31 0B 32K RUN 1 333:47 65.87% [idle{idle: cpu1}] 11 root 155 ki31 0B 32K CPU0 0 333:13 64.36% [idle{idle: cpu0}] 92547 root 52 0 61M 38M piperd 1 5:29 0.39% /usr/local/bin/php_pfb -f /usr/local/pkg/pfblockerng/pfblockerng.inc filterlog 90171 root 52 0 61M 38M piperd 1 5:29 0.29% /usr/local/bin/php_pfb -f /usr/local/pkg/pfblockerng/pfblockerng.inc filterlog 0 root -76 - 0B 640K - 0 1:03 0.00% [kernel{if_io_tqg_0}] 0 root -76 - 0B 640K - 1 0:55 0.00% [kernel{if_config_tqg_0}] 0 root -76 - 0B 640K - 1 0:40 0.00% [kernel{if_io_tqg_1}] 85806 unbound 20 0 489M 459M kqread 0 0:31 0.00% /usr/local/sbin/unbound -c /var/unbound/unbound.conf{unbound} 32 root -12 - 0B 5088K - 1 0:28 0.00% [zpool-pfSense{zio_write_issue}] 0 root -16 - 0B 640K swapin 1 0:26 0.00% [kernel{swapper}] 85806 unbound 20 0 489M 459M kqread 1 0:23 0.00% /usr/local/sbin/unbound -c /var/unbound/unbound.conf{unbound} 8956 root 21 0 63M 39M nanslp 1 0:10 0.00% php_wg: WireGuard service (php_wg) 49865 root 27 0 132M 48M accept 0 0:09 0.00% php-fpm: pool nginx (php-fpm) 19 root -16 - 0B 16K pftm 0 0:09 0.00% [pf purge] 12 root -60 - 0B 528K WAIT 0 0:08 0.00% [intr{swi4: clock (0)}] 20 root -16 - 0B 16K - 1 0:08 0.00% [rand_harvestq] 67253 root 52 20 11M 2664K wait 0 0:08 0.00% /bin/sh /var/db/rrd/updaterrd.sh 32 root -8 - 0B 5088K tx->tx 1 0:08 0.00% [zpool-pfSense{txg_thread_enter}] 44264 root 52 0 132M 47M accept 0 0:08 0.00% php-fpm: pool nginx (php-fpm) 382 root 52 0 132M 47M accept 0 0:06 0.00% php-fpm: pool nginx (php-fpm) 16768 root 20 0 14M 2724K nanslp 0 0:06 0.00% /usr/local/bin/dpinger -S -r 0 -i WAN_DHCP6 -B fe80::92ec:77ff:fe34:8810%ix3 -p /var/run/dpinger_WAN_DHCP6~fe80::92ec:77ff:fe34:8810%ix3~fe80::217:10ff:fe91:261e%ix3.pid -u /var/run/dpinger_WAN_DHCP6~fe80::92ec:77ff:fe34:8810%ix3~fe80::217:10ff:fe91:261e%ix3.sock -C /etc/rc.gateway_alarm -d 1 -s 500 -l 2000 -t 60000 -A 1000 -D 500 -L 20 fe80::217:10ff:fe91:261e%ix3{dpinger} 75575 root 21 0 132M 48M piperd 0 0:05 0.00% php-fpm: pool nginx (php-fpm) 8676 root 52 0 132M 48M accept 1 0:05 0.00% php-fpm: pool nginx (php-fpm) 16204 root 20 0 11M 2628K nanslp 0 0:05 0.00% /usr/local/bin/dpinger -S -r 0 -i WAN_DHCP -B 67.246.51.16 -p /var/run/dpinger_WAN_DHCP~67.246.51.16~67.246.48.1.pid -u /var/run/dpinger_WAN_DHCP~67.246.51.16~67.246.48.1.sock -C /etc/rc.gateway_alarm -d 1 -s 500 -l 2000 -t 60000 -A 1000 -D 500 -L 20 67.246.48.1{dpinger} 71598 root 20 0 11M 2184K select 1 0:05 0.00% /usr/sbin/powerd -b hadp -a hadp -n hadp 87354 root 20 0 18M 7928K kqread 1 0:05 0.00% /usr/local/sbin/lighttpd_pfb -f /var/unbound/pfb_dnsbl_lighty.conf 383 root 23 0 132M 49M accept 1 0:04 0.00% php-fpm: pool nginx (php-fpm) 83998 dhcpd 20 0 24M 12M select 0 0:03 0.00% /usr/local/sbin/dhcpd -user dhcpd -group _dhcp -chroot /var/dhcpd -cf /etc/dhcpd.conf -pf /var/run/dhcpd.pid igc0 igc0.20 igc0.30 igc0.90 igc0.200 igc0.10 90838 root 20 0 19M 6872K select 0 0:03 0.00% /usr/local/sbin/ntpd -g -c /var/etc/ntpd.conf -p /var/run/ntpd.pid{ntpd} 47477 root 20 0 12M 2984K bpf 1 0:03 0.00% /usr/local/sbin/filterlog -i pflog0 -p /var/run/filterlog.pid 26 root -16 - 0B 48K psleep 1 0:03 0.00% [pagedaemon{dom0}] 85983 dhcpd 20 0 20M 8944K select 1 0:03 0.00% /usr/local/sbin/dhcpd -6 -user dhcpd -group _dhcp -chroot /var/dhcpd -cf /etc/dhcpdv6.conf -pf /var/run/dhcpdv6.pid igc0 2735 root 20 0 11M 2664K select 0 0:02 0.00% /usr/sbin/syslogd -s -c -c -l /var/dhcpd/var/run/log -P /var/run/syslog.pid -f /etc/syslog.conf 93576 root 52 0 132M 49M accept 0 0:02 0.00% php-fpm: pool nginx (php-fpm) 6 root -8 - 0B 528K - 0 0:02 0.00% [zfskern{dp_sync_taskq}] 92461 root 20 0 11M 2208K kqread 0 0:02 0.00% /usr/bin/tail_pfb -n0 -F /var/log/filter.log 89855 root 20 0 11M 2208K kqread 1 0:02 0.00% /usr/bin/tail_pfb -n0 -F /var/log/filter.log 12 root -80 - 0B 528K WAIT 0 0:02 0.00% [intr{irq265: nvme0:io0}] 12 root -80 - 0B 528K WAIT 1 0:02 0.00% [intr{irq266: nvme0:io1}] 32 root -16 - 0B 5088K - 1 0:02 0.00% [zpool-pfSense{zio_null_issue}] 16204 root 20 0 11M 2628K sbwait 1 0:01 0.00% /usr/local/bin/dpinger -S -r 0 -i WAN_DHCP -B 67.246.51.16 -p /var/run/dpinger_WAN_DHCP~67.246.51.16~67.246.48.1.pid -u /var/run/dpinger_WAN_DHCP~67.246.51.16~67.246.48.1.sock -C /etc/rc.gateway_alarm -d 1 -s 500 -l 2000 -t 60000 -A 1000 -D 500 -L 20 67.246.48.1{dpinger} 381 root 20 0 103M 28M kqread 1 0:01 0.00% php-fpm: master process (/usr/local/lib/php-fpm.conf) (php-fpm) 12 root -60 - 0B 528K WAIT 0 0:01 0.00% [intr{swi4: clock (1)}] -
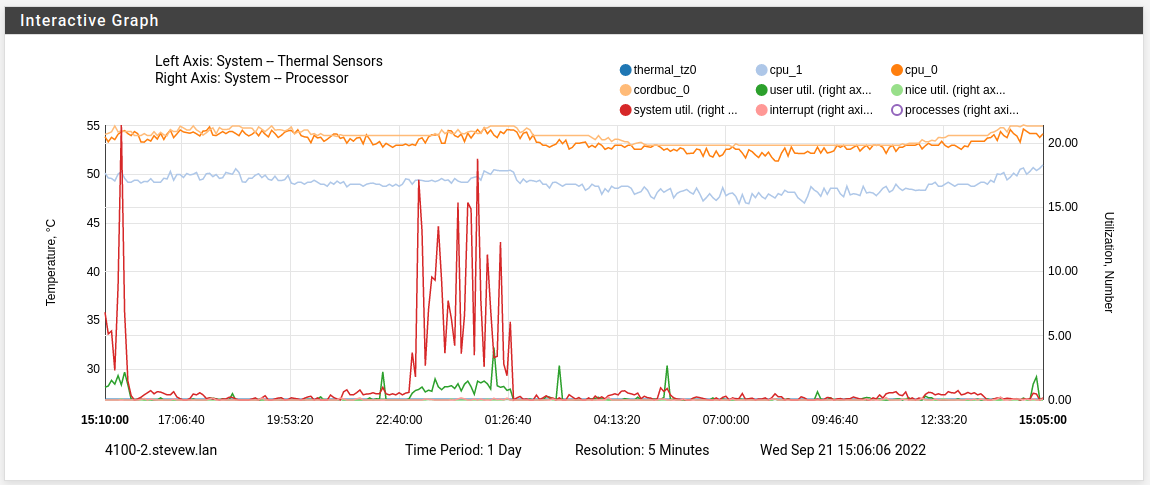
That seems about right. Here's a test 4100 I have, you can see it's running slightly hotter but is mostly idle. It's stacked with some other test devices though. (don't do that!
 )
)
Steve
-
@stephenw10
OK- Wasn't sure as 50 seems high, is that just the norm for Atom CPUs? I don't notice any slowness. -
Yes, that's well inside the expected range for passive cooling. No problem there I can see.
-
@stephenw10 Ah, passive cooling- I should have thought of that- I knew that there was no fan but just forgot to consider that. Thanks again,
-
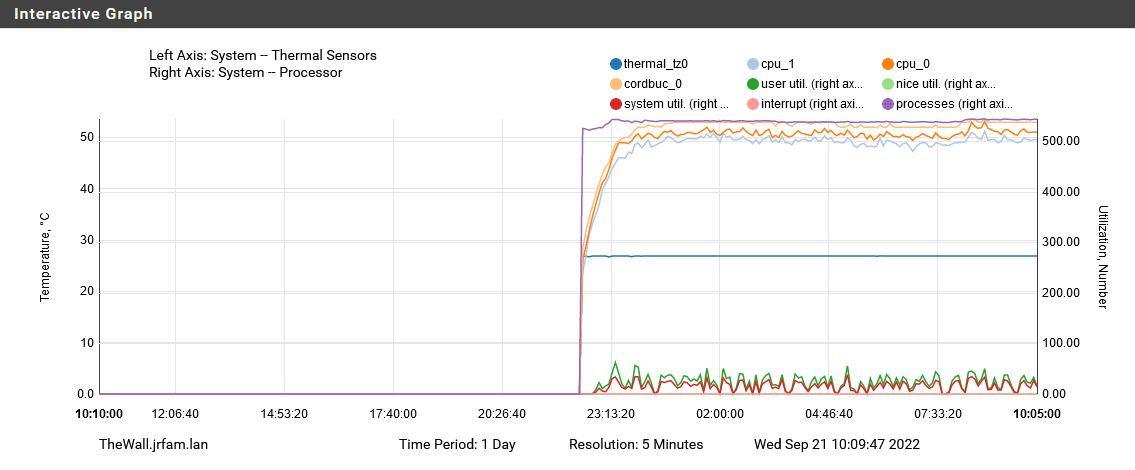
@creationguy My new 6100 was holding at 50.0°C+ until I put a fan in front of it and now's it's happy at 27.0°C. The heat sink could use a little airflow to stay cool. It's hot to the touch without any air movement, but it doesn't appear to impact the performance either way.
-
@creationguy Temps are what i have as well. Mine was in an open rack in an open basement and i would get around 53. I have the 6100 and the temps are the exact same.