Monitoring Gateway
-
*update
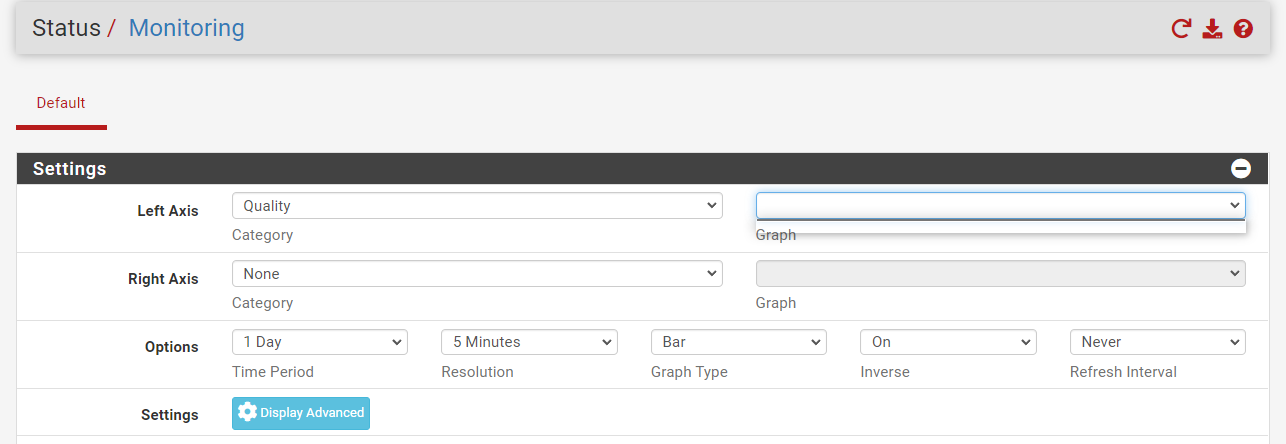
Status / Monitoring - nothing works there... -
I just tried it, and it works. Can you try different browser ?
-
@hendi I use that all the time, never any issues.. Do other tabs work other than quality, or you can not change that either?
What browser are you using?
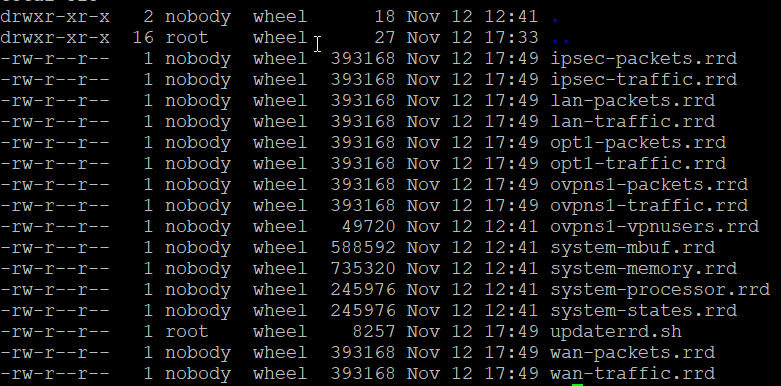
If you look in
/var/db/rrd
do you see anything for your wan gateway?
Here is mine for example

-
I tried with chrome and edge.

-
@hendi
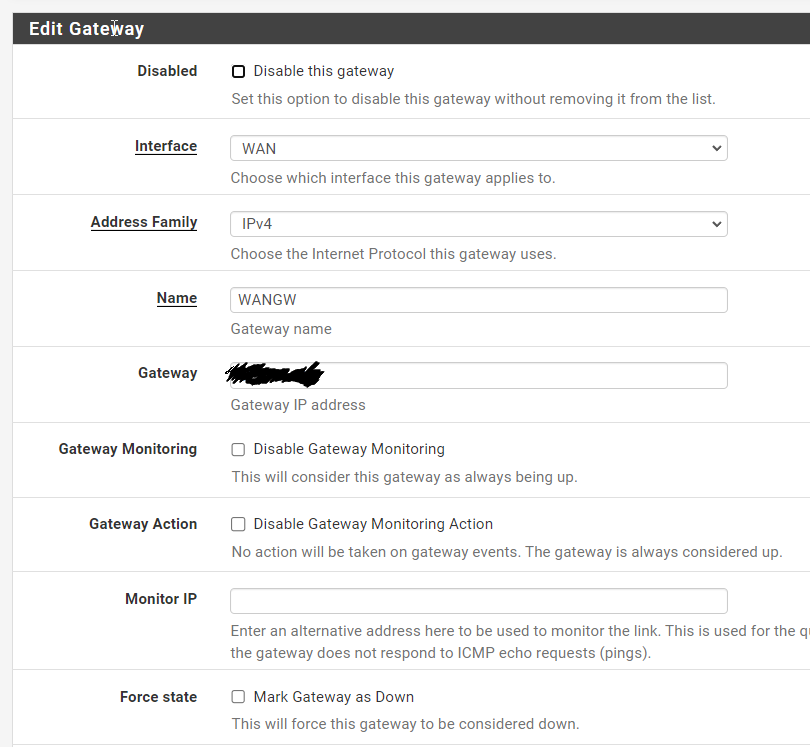
Did you even enable monitoring in the gateway settings? -

check disable, enable..no update..
-
@johnpoz nothing works in Status / Monitoring
I can select system-memory e.g click update but i have no data in graph.
-
I would try resetting the graph data in the advanced settings. It clearly can't read it for some reason.
Steve
-
@stephenw10
I did reset graph, reboot pfsense. Now i can select gw in quality and everything else in monitoring but the graph does not update. -
I did change hostname in System - General Setup a while ago.
Maybe it has something to do with it? -
About 3 weeks ago I added another network card. I have wan, lan and guest. It is possible that since then the graphics no longer work.
-
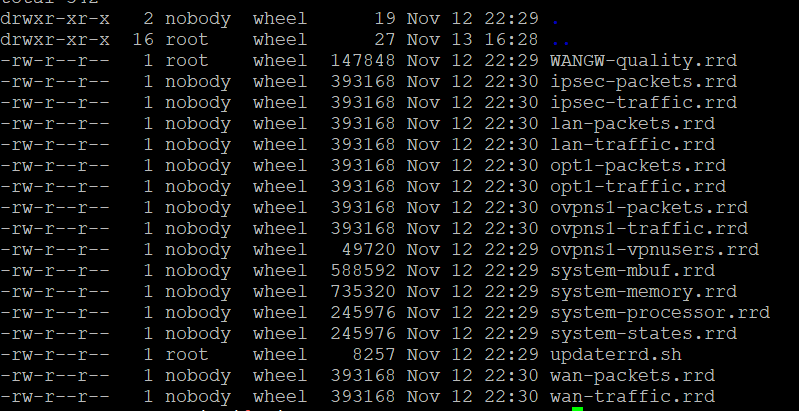
Shouldn't make any difference to the RRD data. Do you see the RRD files being updated?
You may just need to wait for it to add some data. If you're running ram disks you might be hitting some issue with it recovering the old data at boot.
Steve
-
-
Is that file date/time when you reset the RRD files?
-
@stephenw10 Is the date of reboot pfsense.
-
Was that before you reset the RRD data? No updates since the reset or since the reboot?
Do you see updaterrd.sh running in the System Activity or output of
ps -auxwwd?Steve
-

After installation, the graphics worked until a certain moment when I noticed that it stopped recording data. I don't know what moment it coincided with, it's possible that it stopped after I added a new interface for the "guest" network, but I'm not sure.
At the moment, no data appears on the graphs. Nor about memory usage, CPU usage, gateway monitoring. traffic data, etc. -
Hmm, is that showing the process was started on Sat 22nd Oct? That seems unlikely. Unless it didn't actually reboot. The date/time format isn't what I see from that command. Might just be compressed display output. That does change at reboot I assume?
root 15711 0.1 0.1 5052 2596 - SN 27Oct22 26:52.97 |-- /bin/sh /var/db/rrd/updaterrd.sh root 17825 0.1 0.1 4156 1896 - SNC 17:04 0:00.00 | `-- sleep 60 -
-
@stephenw10 said in Monitoring Gateway:
updaterrd.sh


Another reboot now. Waiting for some data on graph..


