pfSense GUI damn(!) slow due to ^Firewall Logs^ widget
-
Hmm, I can't replicate this.
Do you have so few entries there that 20 lines of blocked traffic means opening all the compressed files?
I'm testing on an internal device that doesn't see much logging and the firewall logs widget really doesn't seem to add much at all. -
I just logged in via SSH and I have three filter log files.
- one compressed date 16 november 16:25 (log.1.bz2)
- one compressed date 16 november 19:40 (log.0.bz2)
- one not compressed date 16 november 20.10 (log) (5 minutes old)
And I am quite sure that each of them has many more than 20 lines with blocked traffic. About 50% of the logged messages are related to blocked traffic.
Apart from that, it tail can show 20 lines in an instant, I do not see any reason why the app could not !!!
-
Yup, those logs are rotating quite often. It should not be opening more than one file.
I would disable compression with that sort of rotation rate. At the very least it can pu8t a big load spike on the firewall more often than you'd want.But a 16s delay is huge. I'm seeing nothing approaching that. What other widgets do you have there/ Perhaps it's a combination creating that.
-
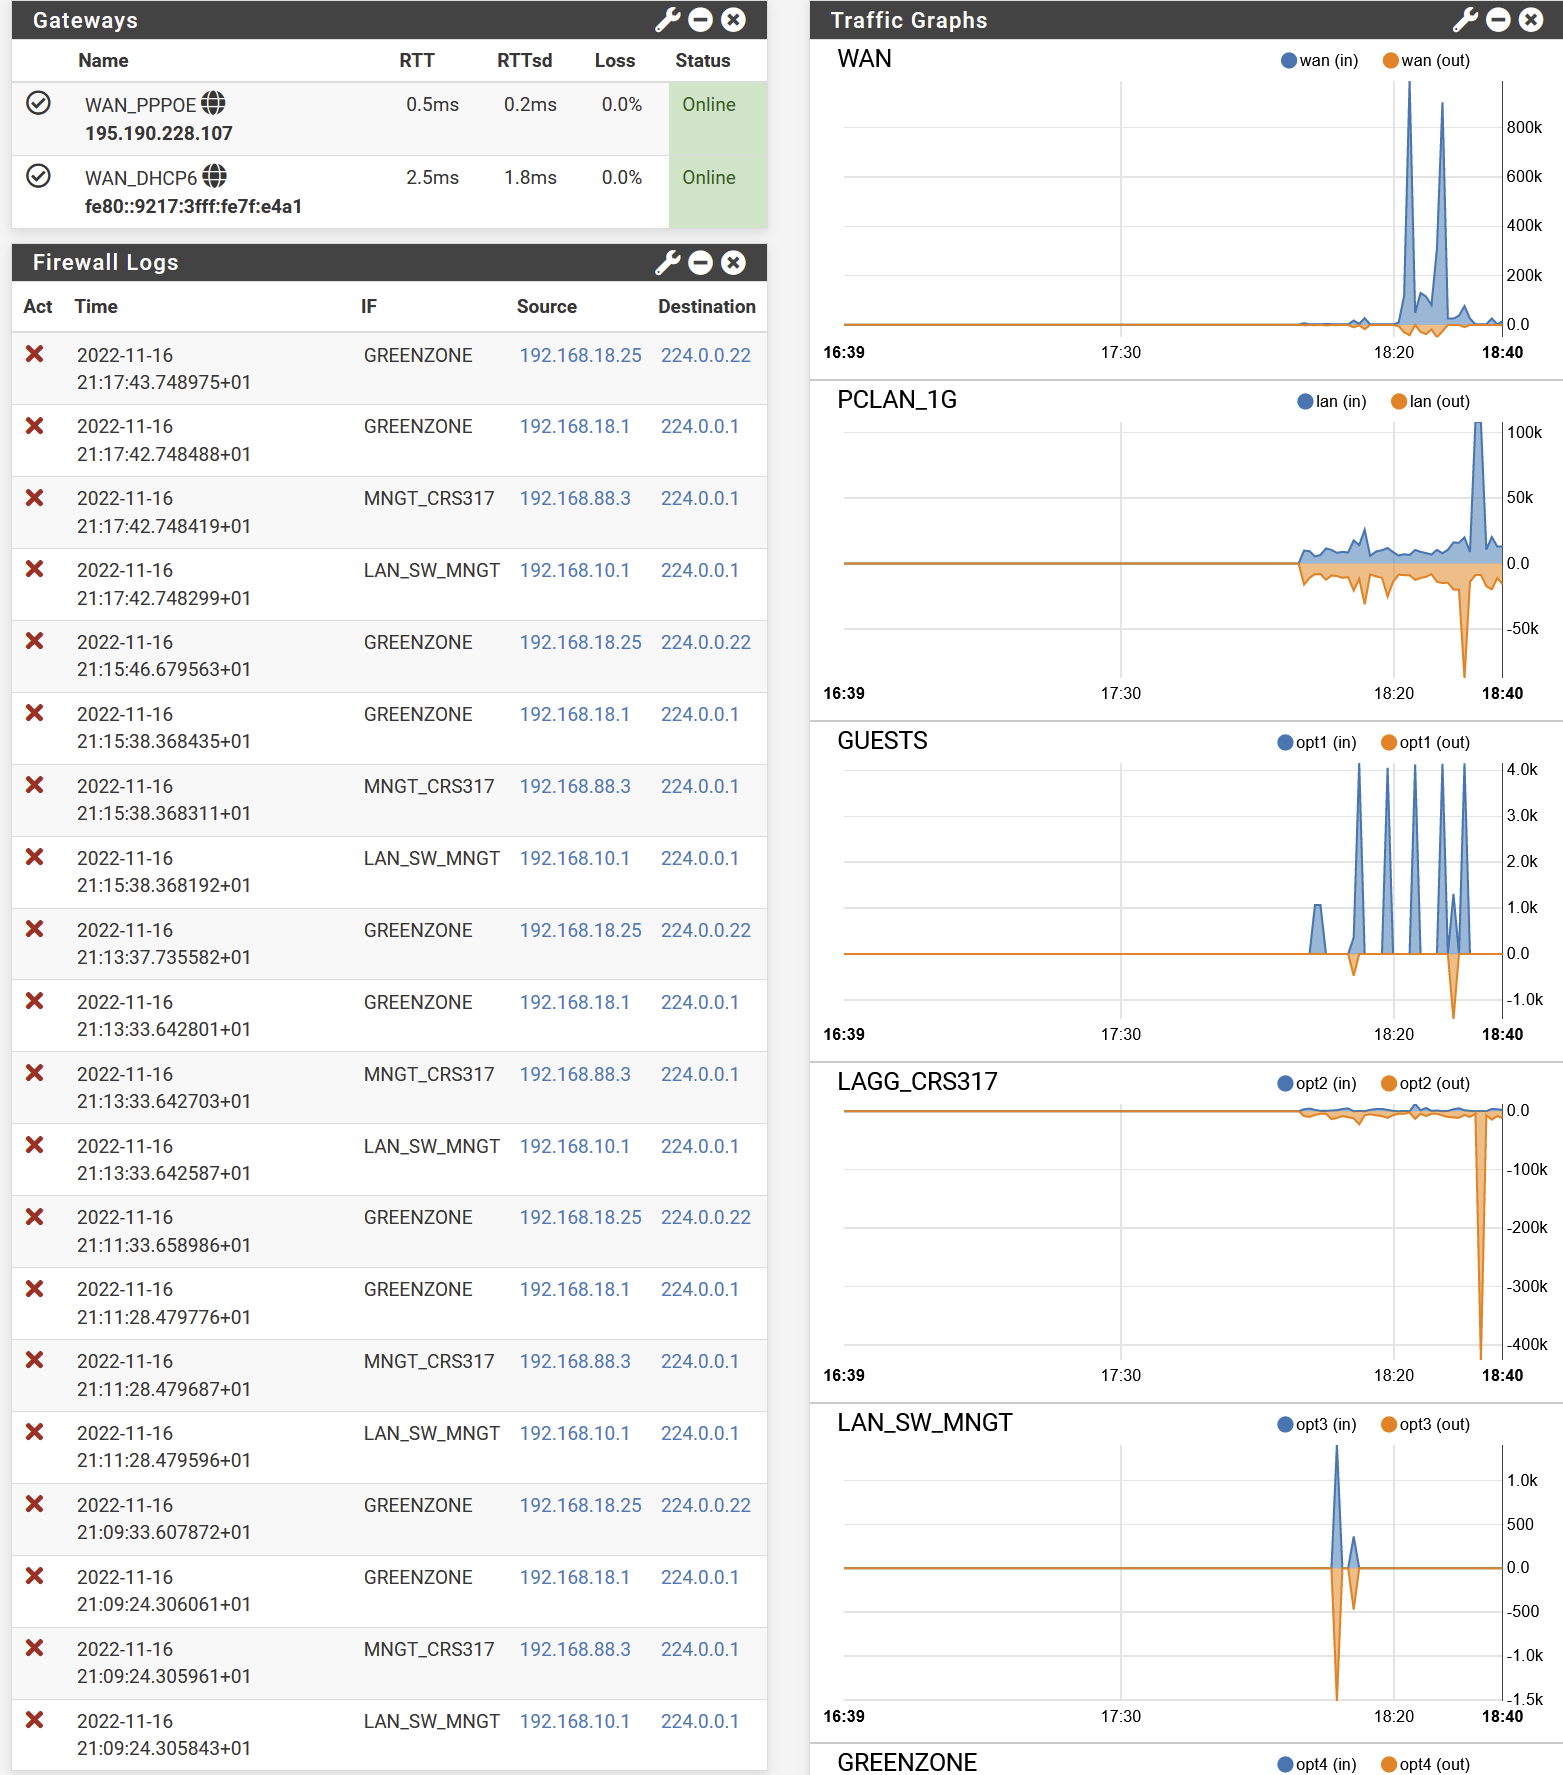
Here two screenshots, note that the alarms you see are not representative, there a lot more 224.0.0.x alarms than normal. I have to find out why.
However the overall behavoir is not different than in the past.
A couple of vlans are not in use they are there in favor of a future virtual machine.
Louis
-
Hmm, of the things your have there I would expect the traffic graphs to be a far larger delay than the firewall logs. Though testing it here I still only see ~3s with that loaded. And I'm testing on a 4100 which is far lower powered than your hardware.
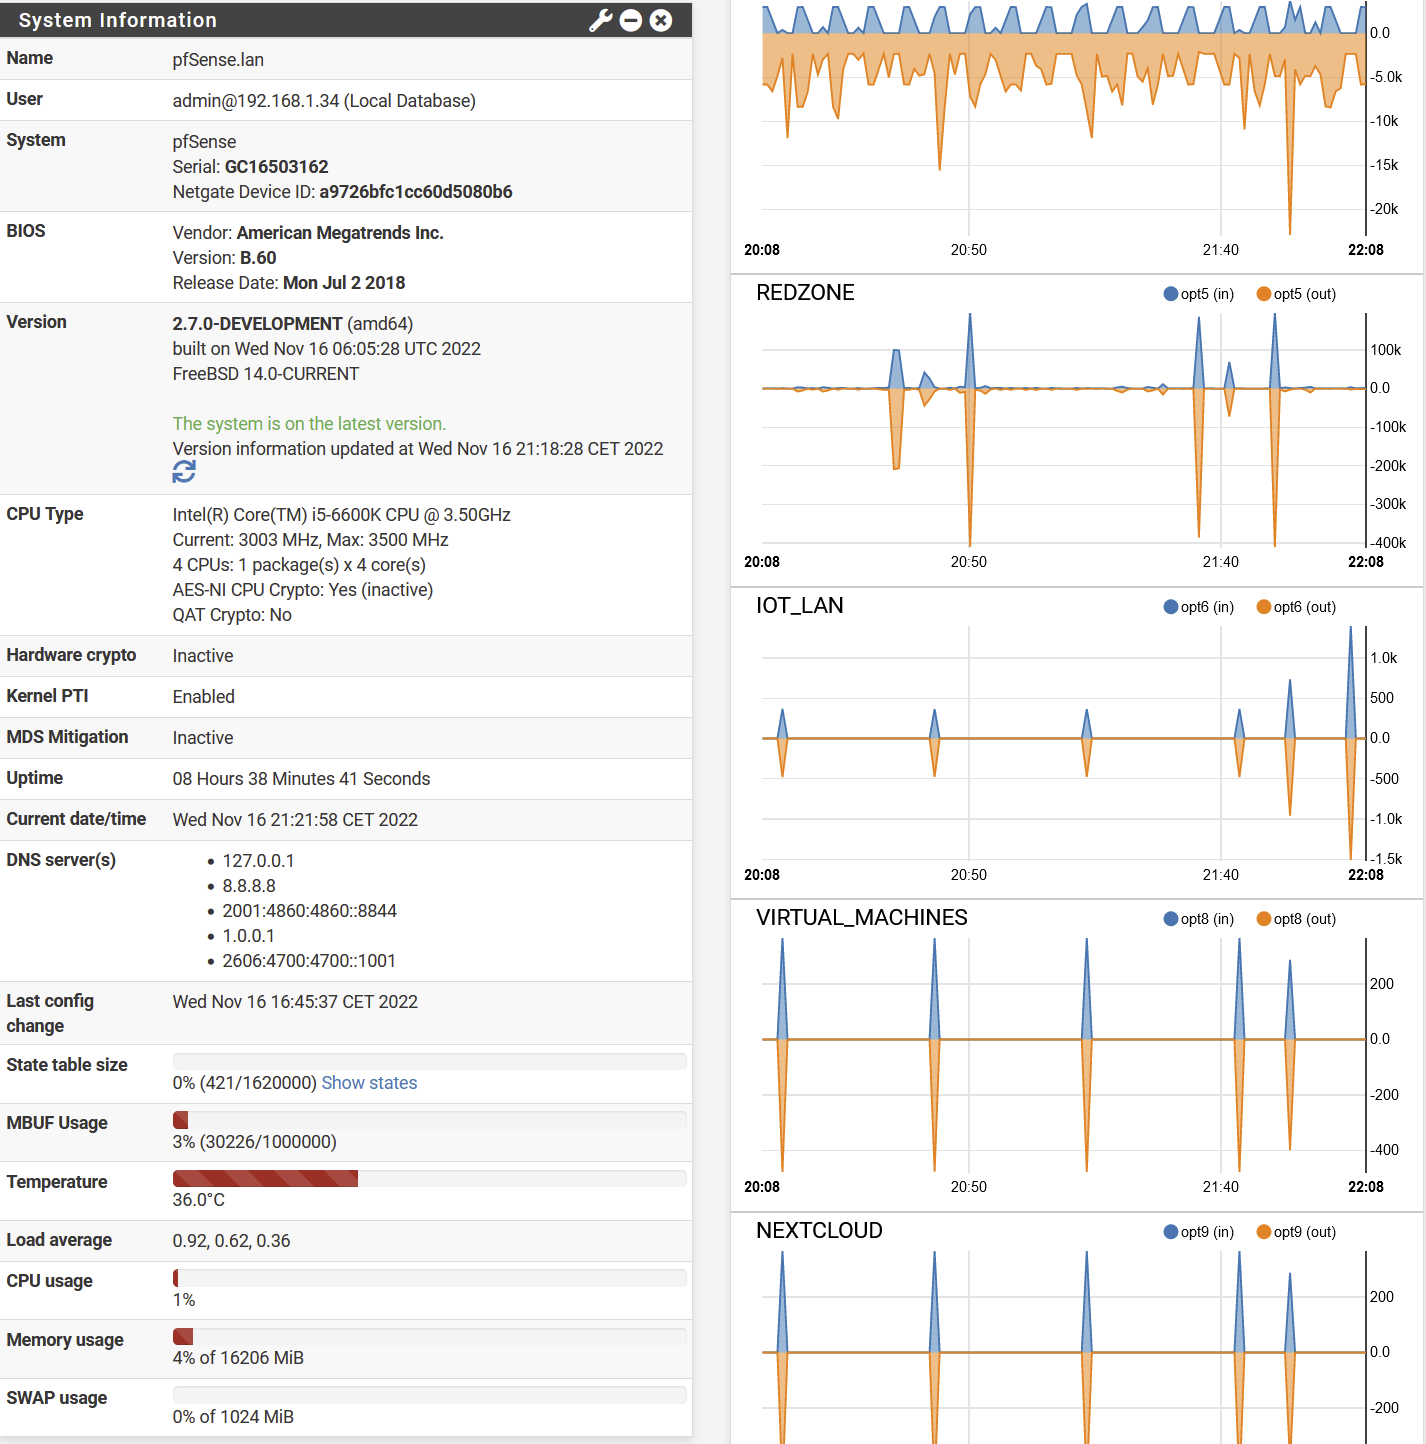
Is that installed bare metal on that i5? -
Yep it is bare metal. It is really not a slow system for an firewall. Note that part of the network is 10G.
Apart from that, I would have expected that the graphs would cost far more delay than the IMHO simple message log representation. But not true. If I login with the firewall log enabled or change to that screen there is at lease 16 seconds delay, where I can not properly measure the delay, if I remove the firewalllog widget, so lets say below 2 seconds
So I really thing there is something terrible wrong with the design of the code of that widget
-
There must be something else in play here, I can't replicate that even on a low powered VM.
Is it only the dashboard that's slow? Viewing the firewall logs via the System Logs page is OK?
-
Looking at the logs via the status menu behaves normal. It is just the dashboard which is so damn slow.
That is relevant when
- login
- and when returning form whatever menu towards the dashboard.
I think that a better action then testing would be exterminating the widget code and perhaps (if necessary) adding a couple of time measurement debug statements.
If I can find the code related to the widget on github, I intent to have a look at the code myself as well
-
@louis2 said in pfSense GUI damn(!) slow due to ^Firewall Logs^ widget:
If I can find the code related to the widget on github,
No need to go that far.
/usr/local/www/widgets/widgets/log.widget.phpor here : https://github.com/pfsense/pfsense/blob/master/src/usr/local/www/widgets/widgets/log.widget.php
Looks the same to me.
@louis2 said in pfSense GUI damn(!) slow due to ^Firewall Logs^ widget:
and perhaps (if necessary) adding a couple of time measurement debug statements

The interesting part, I guess, is :
from line 80 to 101.
There are a couple of assignments and a function called conv_log_filter().
Add a log line with a time stamp : you will know quickly what function or place in the code eats up all the time.
Then, go to that function, and repeat adding log lines with time stamps.Afterwards, you'll find the classic foreach part that constructs the page.
-
Gertjan could you place the link to the code?
Other point is that I would like to see the rule name in the widget. Perhaps as a second line under IF
Sorry you did already provide some links
-
I am not a php or java expert, and I only reviewed the first part of the code but some remarks below.
First and most important one is that 'conv_log_filter' is fed with the total $filter_logfile = "{$g['varlog_path']}/filter.log"
Which does not seem clever to meI would only insert lets say max the last 100 lines of the filter log into the conv_log_filter ....
As said I did not look through all code and I am not a java, ajax or php expert, but here some things I was thinking waling through the first part of the code
Initial thoughts (note I am not an expert in gui programming)
if (is_numeric($_POST['filterlogentries'])) {
I would have expected an default value in case not numeric
I would also have expected a max value
$acts = array();
is an array containing the the choosen filter, but why is it an array since it contains only one valueThe widget key seems upperlevel to me, I do not understand why there is an an relation with a setting like != "All")
I understand there is a relation in regard to update frequency$filter_logfile = "{$g['varlog_path']}/filter.log";
that is clear it only looks into the actual (not compressed) log$filterlog = conv_log_filter($filter_logfile, $nentries, 50, $filterfieldsarray);
I wonder for which reason the 50 is there (50 lines max?), if so I think the max should be about 5 times the requested number of entrys since at this point you do not know the type of the fetched lines -
@louis2 said in pfSense GUI damn(!) slow due to ^Firewall Logs^ widget:
First and most important one is that 'conv_log_filter' is fed with the total $filter_logfile = "{$g['varlog_path']}/filter.log"
Which does not seem clever to meNoop.
$filter_logfile contains the path and file name of the log file.
/var:log/filter.log in this case.Then the conv_log_filter() set up a boat load of parser items, and calls finally :
/bin/cat '/var/log/filter.log.0' '/var/log/filter.log' | /usr/bin/tail -r -n 10000(I'm not bzipping my logs so this is a basic command line tail command)
It executes very fast.Then the resultant is filtered, and sorted if needed.
It took about half a second for my filter.log (864 Kbytes) and filter.log.0 (1069 Kbytes) to get the first 10000 lines, filter and sort, and show up the result - the widget.
As far as I can see, I found no DNS or other time consuming requests are needed
I'm using a Netgate 4100 on 22.05 btw (pfSense Plus), not the neck and code breaking 2.7.0. dev ;)
-
I simply do not know, I have to dig deeper. I had a short look at the filter.log, which seems a deep down pf log.
So it is clear that a couple of lookups are needed to convert the output to what is represented on the GUI.
I not even find source and destination in that file so that has to be correlated as well.
So it is not simply select a few records and show them in the widget.
The processing is of cause all most identical as the one used when showing the firewall log under system logs. I Had expect ^a logfiles on an higher level^
Whats ever I have to dig deeper and it would help if I could edit the code, compile it install and remove it with pkg for testing changes.
-
@louis2 The most time consuming / performance hungy widget in our experience are firewall logs (that don't make sense for me on a dashboard as theres less info then necessary for me to look at) and the traffic graphs. Removing those widgets were always a huge performance boost and all nagging about "pfsense / the firewall being super slow" vanished instantly.
So would be interesting in your case to remove them both and check the speed of the dashboard again?
Cheers
-
Since I am investigating, I am sitting behind the pc, and did test it instantly.
But it is not true, it is really the firewall log widget ! Removing the traffic graphs has no or little impact
-
I am analyzing the widget. From what I think to know now.
Layout ^filter.log^
<134>1
2022-11-17 # date
T11:03:43.334983+01:00 # time
pfSense.lan # # pfsense domain
filterlog 72303 - - # ?
963, # ?
, # ?
, # ?
1558685482, # ?
lagg1.18, # vlan
match, # mached a rule
block, # result = block
in, # ?
4, # ?
0x0, # ?
, # ?
1, # ?
62353, # ?
0, # ?
none, # ?
103, # ?
pim, # protocol ?
46, # ?
192.168.18.1, # source
224.0.0.13, # destination
datalength=26 # package lengthColumns shown in widget
Act Time IF Source Destination$user_settings # the user defined settings
$nentries # seems to define the filter based on user settings
$iface_descr_arr # used to convert technical interface name to ^IF^
$filterfieldsarray # ?? During filling of the the array interface technical names are converted to interface names using the $filterfieldsarray
$filterlog # ??? Filerlog is filled using >>conv_log_filter<< which is using the $filter_logfile and $filterfieldsarray and also the user defined $nentries
$filterent # Seems to be an element of $filterlog
$filterent # Seems to be an array as well haveing the following fields: 'rulenum' 'tracker' 'act' 'time' 'interface' 'srcIP' 'dstIP' 'dstport'
There seems to be an option for an reverse DNS-lookupAmong other things for better understanding:
- need the definition of the logfile
- need the code / of "conv_log_filter"
ANd it would be nice to have a function to lookup the firewall rule attributes among them "description" ion order to add that to the widget layout !!!

-
@louis2 said in pfSense GUI damn(!) slow due to ^Firewall Logs^ widget:
But it is not true, it is really the firewall log widget ! Removing the traffic graphs has no or little impact
Interesting. In a few cases that really had more impact than the firewall one, but good to know. Personally I don't see much use for the firewall widget but it shouldn't slow the dash down so much, sure.
Nevertheless we never got much use out of that small widget concerning rulesets as either there's too much to display (too many pps that are displayed for it to make sense) or if there IS an interesting hit, it can go away too quickly or doesn't display the information needed. So I have to hop to the firewall log screen anyway. -
If I log into the FW for some reason, to add or change something, I am not always going to check the logs.
However the first thing I do after a login, is look at e.g. that Firewall widget to see if there is something strange.
For a deeper investigation, I use the logs and or perhaps even more often wireshark
-
@louis2 said in pfSense GUI damn(!) slow due to ^Firewall Logs^ widget:
However the first thing I do after a login, is look at e.g. that Firewall widget to see if there is something strange.
Just curious: How long is your widget to display? I have a great number of customers where that wouldn't do anything to help me see "anything strange" as the default blocking on WAN is simply too much noise and disabling it you don't see the stuff that hits you anymore. But in bigger setups those logs are shipped off the firewall to log/monitoring systems (like graylog etc.) to correlate with other systems anyway.
-
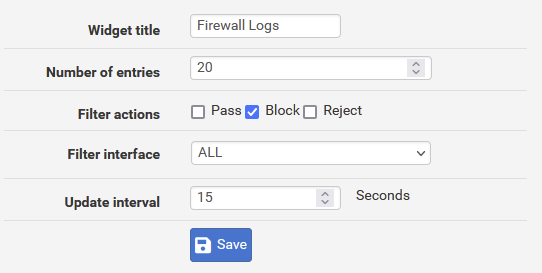
I defined 20 entrys refresh 15 seconds. It just give a first impression. But IHMO not unimportant.
For private use you normally do not have a syslog/greylog server. The local log is mostly enough.
However since 2.7 or at least since that time frame, my IPV6 gateway widget turns red. After some investigation I know, that despite the "interface being red" it is working

For that reason I installed an greylog instance on my NAS, but up to now I could not find a course. In fact I stopped my investigation effort hoping that the problem would be gone with the introduction of FreeBSD 14-current. However the issue is still there
