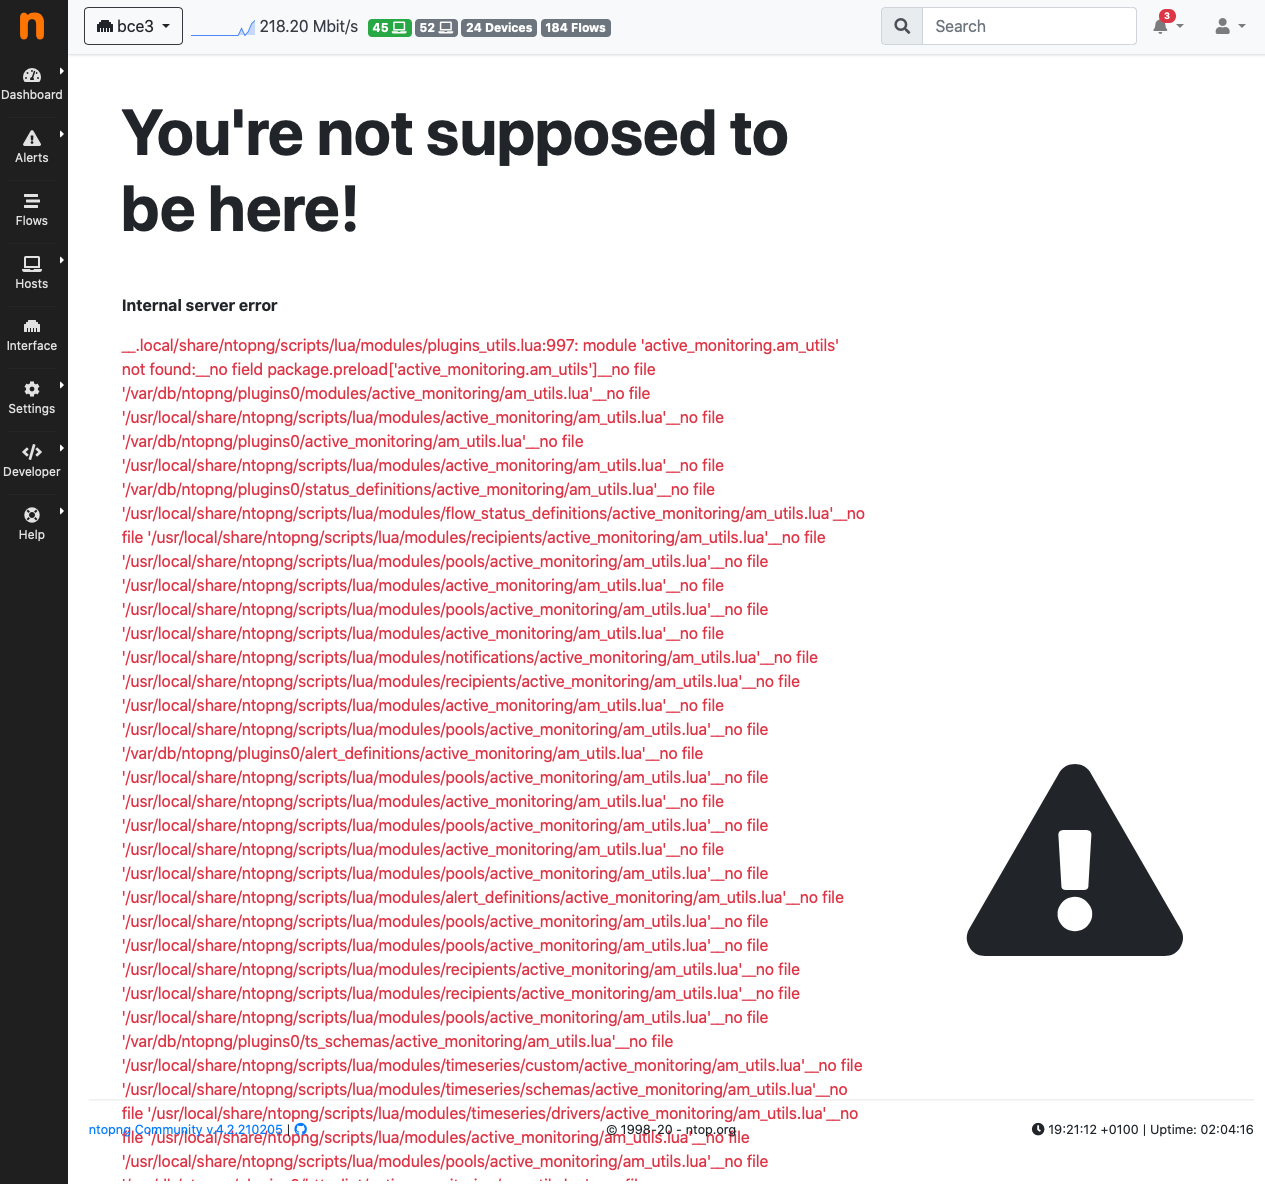
ntopng - You're not supposed to be here!
-
Same issue on PFSense+ 21.02.
-
@sbourdeaud posted a possible fix;
https://forum.netgate.com/topic/161495/solved-ntopng-you-re-not-supposed-to-be-here-missing-lua-module-active_monitoring-am_utils
Have not tried it as after a fresh install I didn't encounter the issue (yet).
-
@florisveulemans After posting here, I removed NTOPNG completely (include the settings), and re-installed it.
That was 3 days ago, seems ok so far. I didn't touch the Timeseries settings. -
@batnun How did you remove all the settings?
Thanks.
-
@pbnet before removing ntopng, uncheck Keep Data/Settings in ntopng settings (enabled by default):
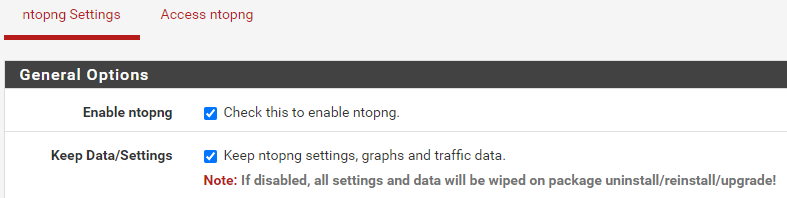
-
@batnun Thanks a lot.
Works great so far on 21.02-RELEASE-p1 -
@pbnet I know that was quite a while ago but I was wondering if you or anyone else were still getting this issue? I'm on 2.5.1 and I reinstalled ntopng and made sure to not save any settings. All works for a few days and then I get that dreaded error message, and only a re-start of the service fixes it (for a few days at least).
-
@silentnomad Im still having these issues so I am interested in seeing how we can get the ntopng package working again
-
deleting my data twice and reinstalling ntopng fixed the problem now.
-
@pwnell a mi me pasa lo mismo al acceder a un host para saber su informacion
-
Curious but do you guys leave ntopng running constantly in the background? Just wondering if you use it for some type of historical feature or something like that.
Firewall: NetGate,Palo Alto-VM,Juniper SRX
Routing: Juniper, Arista, Cisco
Switching: Juniper, Arista, Cisco
Wireless: Unifi, Aruba IAP
JNCIP,CCNP Enterprise -
@michmoor I let it run continiously because “diagnostics use” usually requires quick intervention and perhaps has a great advantage of being able to see trends for the last couple of minutes.
But to be honest ntopng is notoriously buggy, and I have to restart the package once in a while because it stops generating alerts, and starts showing LUA error text instead of trends when clicking on a client.
Also: Ntopng has very little usable historical data.- it only has some client trends, timeline datavolume and protocol distribution. It really is a near realtime/realtime tool.
-
@michmoor Yup, keep it running all the time. It's great to help me see which clients are are consuming bandwidth, for example, and I also look at historic bandwidth usage on an interface.
I've done a complete uninstall and re-install, and disabled some features that I didn't need. It's been quite stable and I no longer get the error messages.
-
As I've stated here
On the left menu bar at the lower end there is the option "Developer"
hoover over it, select "Plugins" on the top right select "Reload Plugins"
It should again be working now -
I tried everything. Even on a fresh install of pfsense - after some time the error would come back. Restarting it fixes it for a while but it always comes back.
But what worked for me is switching the time series database from RRD to InfluxDB. Since doing that the error has never come back. -
@josef said in ntopng - You're not supposed to be here!:
I tried everything. Even on a fresh install of pfsense - after some time the error would come back. Restarting it fixes it for a while but it always comes back.
But what worked for me is switching the time series database from RRD to InfluxDB. Since doing that the error has never come back.Very interesting. Does the package install and configure the influxDB service on its own, or do you have to configure that separately? Perhaps you could post the steps you went through to get it going using influxDB?
-
@josef Bump - Did you see my question in the earlier post?
-
No, unfortunately you will need your own InfluxDB server.
Ntop only provides the ability to connect to and use an external InfluxDB server. -
@josef said in ntopng - You're not supposed to be here!:
No, unfortunately you will need your own InfluxDB server.
Ntop only provides the ability to connect to and use an external InfluxDB server.Thanks for clarifying :-)
-
This post is deleted!

