pfSense and IPSEC lan to lan: a big doubt about the correct implementation
-
Correct, certainly not by IP dircetly. Or on the interface pfSense A is using. It could still be throttling IPSec traffic specifically but that seems unlikely.
In which case it must be some difference between the IPSec setups.
One thing that is different is that because one side is behind NAT the tunnel will be coming up with NAT-T enabled. The UDP encapsulation reduces the MTU. So it's possible you're seeing some packet fragmentation issues that don't happen over the test tunnel.
Try running iperf with a smaller mss values set, the-Mflag.Otherwise I would upgrade the 2.5.2 end to 2.6 so you're matching the test tunnel.
Steve
-
Thanks, Steve. We already scheduled a downtime for tomorrow in order to update pfsense from 2.5.2 to 2.6.
Meanwhile, I would like to execute iperf using -M flag as you suggested.
Unfortunately, I'm not an expert of MTU/MSS and I'm still trying to understand the relation between them. I'm looking for some basic guide to be studied.Could you please say me the mss value I should assign to -M flag to do the test?
Thank you in advance,
Mauro -
I'm still reading something about MSS, but, anyway, I tried to execute the iperf as follows:
iperf2 -c 192.168.120.114 -M 1460
WARNING: attempt to set TCP maximum segment size to 1460, but got 536Client connecting to 192.168.120.114, TCP port 5001
TCP window size: 110 KByte (default)[ 3] local 192.168.118.13 port 55226 connected with 192.168.120.114 port 5001
[ ID] Interval Transfer Bandwidth
[ 3] 0.0-10.0 sec 247 MBytes 207 Mbits/secIs the warning saying that something is going wrong?
-
Hmm, that might imply you have a much smaller tunnel MTU for some reason.
Try running some ping tests with large packets and do-not-fragment set to determine the tunnel MTU.
Check the same over the test tunnel. -
@stephenw10 thanks again for your help.
This is the output of the ping test through the tunnel (host in LAN A <-> host in LAN B)
[/root]> ping 192.168.120.114 -c 10 -M do -s 9000
PING 192.168.120.114 (192.168.120.114) 9000(9028) bytes of data.
ping: local error: Message too long, mtu=9000
ping: local error: Message too long, mtu=9000
ping: local error: Message too long, mtu=9000
^C
--- 192.168.120.114 ping statistics ---
5 packets transmitted, 0 received, +5 errors, 100% packet loss, time 3999ms[/root]> ping 192.168.120.114 -c 10 -M do -s 8972
PING 192.168.120.114 (192.168.120.114) 8972(9000) bytes of data.
^C
--- 192.168.120.114 ping statistics ---
7 packets transmitted, 0 received, 100% packet loss, time 6000ms[/root]> ping 192.168.120.114 -c 10 -M do -s 1500
PING 192.168.120.114 (192.168.120.114) 1500(1528) bytes of data.
^C
--- 192.168.120.114 ping statistics ---
6 packets transmitted, 0 received, 100% packet loss, time 4999ms[/root]> ping 192.168.120.114 -c 10 -M do -s 1472
PING 192.168.120.114 (192.168.120.114) 1472(1500) bytes of data.
1480 bytes from 192.168.120.114: icmp_seq=1 ttl=61 time=2.34 ms
1480 bytes from 192.168.120.114: icmp_seq=2 ttl=61 time=2.24 ms
1480 bytes from 192.168.120.114: icmp_seq=3 ttl=61 time=2.54 ms
1480 bytes from 192.168.120.114: icmp_seq=4 ttl=61 time=2.56 ms
^C
--- 192.168.120.114 ping statistics ---
4 packets transmitted, 4 received, 0% packet loss, time 3004ms
rtt min/avg/max/mdev = 2.242/2.424/2.562/0.143 msPLEASE, NOTE THAT: during this test, for a few seconds, also the MTU 8972 has been accepted. It is very strange.
[/root]> ping 192.168.120.114 -c 10 -M do -s 8972
PING 192.168.120.114 (192.168.120.114) 8972(9000) bytes of data.
8980 bytes from 192.168.120.114: icmp_seq=1 ttl=61 time=3.22 ms
8980 bytes from 192.168.120.114: icmp_seq=2 ttl=61 time=2.93 ms
8980 bytes from 192.168.120.114: icmp_seq=3 ttl=61 time=2.59 ms
^C
--- 192.168.120.114 ping statistics ---
3 packets transmitted, 3 received, 0% packet loss, time 2002ms
rtt min/avg/max/mdev = 2.596/2.917/3.223/0.263 msBut, when I tried again after some seconds, ping with 8972 MTU returned no output
[/root]> ping 192.168.120.114 -c 10 -M do -s 8972
PING 192.168.120.114 (192.168.120.114) 8972(9000) bytes of data.
^C
--- 192.168.120.114 ping statistics ---
6 packets transmitted, 0 received, 100% packet loss, time 5002msUnfortunately, I can't do the test in the "test tunnel" because after I saw that IPSEC worked as expected I removed the virtual machines. I'm sorry for that.
I kept all test results of the iperf, but I haven't the results for the ping -M do -s MTUSIZE. -
Hmm, those ping times are close to double what they were. Are you sure it's not fragmenting there? What happens if you set a much smaller value like 100B?
-
@stephenw10 said in pfSense and IPSEC lan to lan: a big doubt about the correct implementation:
Hmm, those ping times are close to double what they were. Are you sure it's not fragmenting there?
I don't know how to check it, sorry :(
What happens if you set a much smaller value like 100B?
This is the output using 100B
ping 192.168.120.114 -c 10 -M do -s 100
PING 192.168.120.114 (192.168.120.114) 100(128) bytes of data.
108 bytes from 192.168.120.114: icmp_seq=1 ttl=61 time=1.63 ms
108 bytes from 192.168.120.114: icmp_seq=2 ttl=61 time=2.05 ms
108 bytes from 192.168.120.114: icmp_seq=3 ttl=61 time=1.82 ms
108 bytes from 192.168.120.114: icmp_seq=4 ttl=61 time=1.74 ms
108 bytes from 192.168.120.114: icmp_seq=5 ttl=61 time=1.71 ms
108 bytes from 192.168.120.114: icmp_seq=6 ttl=61 time=1.59 ms
108 bytes from 192.168.120.114: icmp_seq=7 ttl=61 time=2.06 ms
108 bytes from 192.168.120.114: icmp_seq=8 ttl=61 time=2.06 ms
108 bytes from 192.168.120.114: icmp_seq=9 ttl=61 time=1.98 ms
108 bytes from 192.168.120.114: icmp_seq=10 ttl=61 time=2.13 ms -
Hello Steve,
I have some important news ( I hope ).
Since I noticed that the host in the LAN at site B has a strange behaviour (the MTU value set on the involved interface revert automatically from 9000 to 1500), I decided to create a virtual machine and I assigned it the following IP address 192.168.120.254.So, without change anything else, I started an iperf2 test from the same host at site A to the VM at site B.
The first attempt was not so lucky, I obtained the same bitrate as before:
[/root]> iperf2 -c 192.168.120.254 (from 192.168.118.13)
Client connecting to 192.168.120.254, TCP port 5001
TCP window size: 325 KByte (default)[ 3] local 192.168.118.13 port 50580 connected with 192.168.120.254 port 5001
[ ID] Interval Transfer Bandwidth
[ 3] 0.0-10.0 sec 223 MBytes 187 Mbits/secBut, when I start incrementing the number of parallel process something magic happens:
[/root]> iperf2 -c 192.168.120.254 -P 16
Client connecting to 192.168.120.254, TCP port 5001
TCP window size: 325 KByte (default)[ 18] local 192.168.118.13 port 50952 connected with 192.168.120.254 port 5001
[ 4] local 192.168.118.13 port 50922 connected with 192.168.120.254 port 5001
[ 5] local 192.168.118.13 port 50924 connected with 192.168.120.254 port 5001
[ 6] local 192.168.118.13 port 50926 connected with 192.168.120.254 port 5001
[ 7] local 192.168.118.13 port 50928 connected with 192.168.120.254 port 5001
[ 3] local 192.168.118.13 port 50930 connected with 192.168.120.254 port 5001
[ 9] local 192.168.118.13 port 50934 connected with 192.168.120.254 port 5001
[ 8] local 192.168.118.13 port 50932 connected with 192.168.120.254 port 5001
[ 10] local 192.168.118.13 port 50936 connected with 192.168.120.254 port 5001
[ 12] local 192.168.118.13 port 50938 connected with 192.168.120.254 port 5001
[ 11] local 192.168.118.13 port 50940 connected with 192.168.120.254 port 5001
[ 13] local 192.168.118.13 port 50942 connected with 192.168.120.254 port 5001
[ 14] local 192.168.118.13 port 50944 connected with 192.168.120.254 port 5001
[ 15] local 192.168.118.13 port 50946 connected with 192.168.120.254 port 5001
[ 16] local 192.168.118.13 port 50948 connected with 192.168.120.254 port 5001
[ 17] local 192.168.118.13 port 50950 connected with 192.168.120.254 port 5001
[ ID] Interval Transfer Bandwidth
[ 18] 0.0-10.0 sec 52.9 MBytes 44.3 Mbits/sec
[ 5] 0.0-10.0 sec 57.4 MBytes 48.1 Mbits/sec
[ 10] 0.0-10.0 sec 55.5 MBytes 46.5 Mbits/sec
[ 12] 0.0-10.0 sec 55.8 MBytes 46.7 Mbits/sec
[ 13] 0.0-10.0 sec 57.5 MBytes 48.2 Mbits/sec
[ 15] 0.0-10.0 sec 56.2 MBytes 47.1 Mbits/sec
[ 16] 0.0-10.0 sec 53.8 MBytes 45.1 Mbits/sec
[ 17] 0.0-10.0 sec 60.8 MBytes 50.9 Mbits/sec
[ 4] 0.0-10.0 sec 54.0 MBytes 45.2 Mbits/sec
[ 6] 0.0-10.0 sec 62.2 MBytes 52.1 Mbits/sec
[ 7] 0.0-10.0 sec 58.8 MBytes 49.2 Mbits/sec
[ 3] 0.0-10.0 sec 59.1 MBytes 49.5 Mbits/sec
[ 9] 0.0-10.0 sec 48.8 MBytes 40.8 Mbits/sec
[ 8] 0.0-10.0 sec 52.6 MBytes 44.1 Mbits/sec
[ 11] 0.0-10.0 sec 55.9 MBytes 46.8 Mbits/sec
[ 14] 0.0-10.0 sec 55.5 MBytes 46.5 Mbits/sec
[SUM] 0.0-10.0 sec 897 MBytes 750 Mbits/secAnd this is the output of the ping with MTU 100 and MTU 8972:
[/root]> ping 192.168.120.254 -c 10 -M do -s 100
PING 192.168.120.254 (192.168.120.254) 100(128) bytes of data.
108 bytes from 192.168.120.254: icmp_seq=1 ttl=61 time=1.87 ms
108 bytes from 192.168.120.254: icmp_seq=2 ttl=61 time=1.72 ms
108 bytes from 192.168.120.254: icmp_seq=3 ttl=61 time=1.93 ms[/root]> ping 192.168.120.254 -c 10 -M do -s 8972
PING 192.168.120.254 (192.168.120.254) 8972(9000) bytes of data.
8980 bytes from 192.168.120.254: icmp_seq=1 ttl=61 time=3.09 ms
8980 bytes from 192.168.120.254: icmp_seq=2 ttl=61 time=2.99 ms
8980 bytes from 192.168.120.254: icmp_seq=3 ttl=61 time=3.00 ms
8980 bytes from 192.168.120.254: icmp_seq=4 ttl=61 time=2.81 msI would like to ask you two questions:
- why I need to increment the P value to reach the expected bitrate? Is there something that I can do to obtain a good bitrate with a single stream?
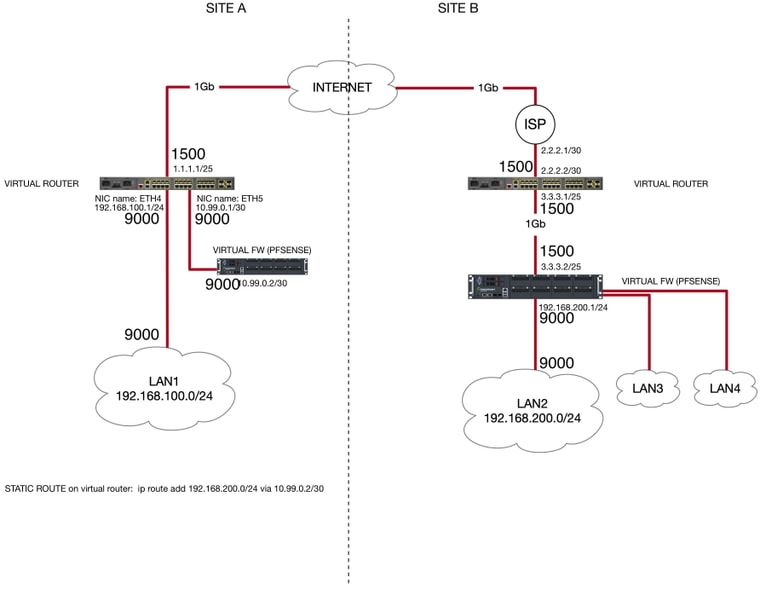
- both the LANs, at each site, are connected to the router (at site A) and to the pfsense (at site B) using a 25Gb/s link. Do you think that it can cause the fragmenting?
- How can I check if it is fragmenting?
I promise that when I will close this task I will not disturb you again :-)
-
I assume that the actual WAN interfaces here are not set to 9000 MTU?
If you are pinging with 9000B packets they must be fragmented.
In your test setup was anything set to 9000 or was it all at the default 1500?
-
@stephenw10 said in pfSense and IPSEC lan to lan: a big doubt about the correct implementation:
I assume that the actual WAN interfaces here are not set to 9000 MTU?
If you are pinging with 9000B packets they must be fragmented.
In your test setup was anything set to 9000 or was it all at the default 1500?@stephenw10 said in pfSense and IPSEC lan to lan: a big doubt about the correct implementation:
I assume that the actual WAN interfaces here are not set to 9000 MTU?
Yes, it is set to 1500 MTU
If you are pinging with 9000B packets they must be fragmented.
Ok, thanks
In your test setup was anything set to 9000 or was it all at the default 1500?
Yes, in my previous test setup LAN 1 at site A and LAN at site B were at 9000.
You can find below the schema with the MTU settings for each involved interface
-
Ok, so one significant difference here is that in the production setup, where pfSense-A is behind NAT, it's WAN is using MTU 9000 and in the test setup it would have been 1500, correct?
That means the IPSec traffic is likely being fragmented by router A rather than any large packets being fragmented in pfSense before being sent over the tunnel.
Since that interface also has to accept the internal connections setting it to MTU 1500 might cause other problems though.
You might try testing from a client set to 1500. Or set an MSS value on the tunnel to be sure TCP packets are not fragmented:
https://docs.netgate.com/pfsense/en/latest/config/advanced-firewall-nat.html#mss-clamping -
You really helped me to solve the issue.
Now the iperf bitrate is about 912 Mbit/s and the throughput captured during a test data transfer between the two LANs is about 102 MB/s.I changed the MSS value on the LANs interface on each pfsense instance and I tuned Tcp window parameters in both the hosts involved (hosts at LAN A and LAN B).
Thank you for your help and patience.
Have a great day,
Mauro -
That's great news.
Did you try setting the MSS value for the tunnel only? Or did you need to set it on the interfaces?
Be good to know for anyone else hitting that issue.
Steve
-
Good morning Steve,
I set the MSS values only for the LAN A and LAN B interfaces on each pfsense instance (please, take a look at the orange circles). Does it make sense in your opinion?
It made VPN working with an acceptable (but still low) throughput 380Mbit/s.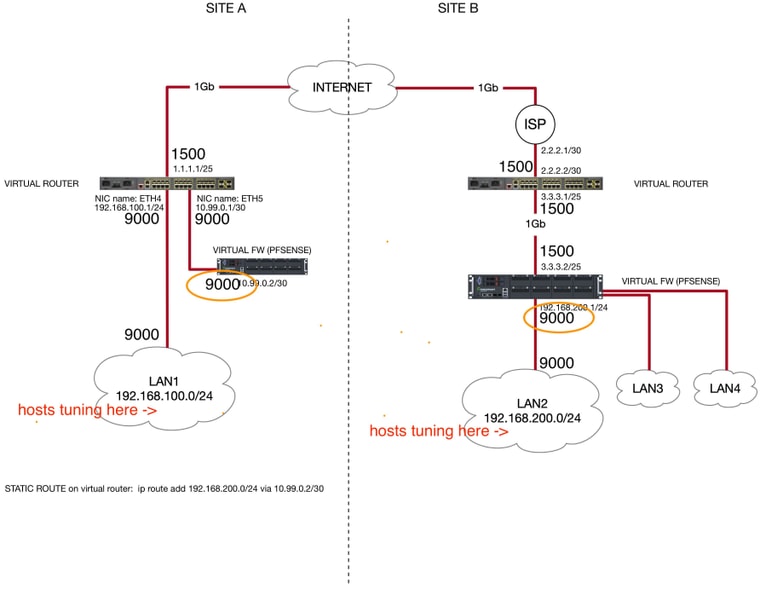
In my case, hosts tuning has been the most important things to do to increase the iperf test results. TCP window, TCP buffer (rmem and wmem), SACK and so on...
Now, everything seems to be ok, but I have to apply some traffic shaping on the IPSEC tunnel
 . Is there some guide about this procedure?
Have a great day,
Mauro -
Ah, traffic shaping is a whole new topic! There are many many variables there.
https://docs.netgate.com/pfsense/en/latest/trafficshaper/index.htmlFirstly what issue are you trying to address with shaping?
Steve
-
Do you prefer I home a new topic?
I'm trying to limit the IPSEC tunnel bandwidth to about 90% (or to 80MB/s).Thank you,
Mauro -
Just a hard limit to allow other traffic outside the tunnel?
-
Mmmh, just a way to limit the traffic through the tunnel.
Now, the IPSEC tunnel has a very good throughput and I already know that users will saturate this channel with their data transfer sessions from LAN at site A to LAN at site B. -
Then I would use a Limiter outbound on the IPSec interface at either end.
https://docs.netgate.com/pfsense/en/latest/trafficshaper/limiters.html
You could also apply that inbound on the source interface if that's known at both ends. Either way it's better to limit at the sending end than receiving.
Steve