Just got a Protectli FW4C!
-
I've had a 100 Mbps IPSec/AES-GCM-128 tunnel between my home office (SG-1100/pf+22.05) and my main office (MBT-2220/pfCE 2.60), despite I have 1000/1000 service in both locations, so I was looking to upgrade my throughput so I can use my home office as an offsite repository for my backup system, and for general WFH productivity.
I saw that Protectli had recently released their FW4C product with 2.5 Gbps ports and ~980 Mbps advertised IPSec/AES-GCM-128 performance, so I bought one to try out at my home office. Protectli was out of stock, but amazon had them available, and I got one the very next day.
Setup was straightforward, although I had to import a config from an APU that preceded the SG-1100, because the FW4C didn't like the config from the SG-1100/pf+22.05. I don't know whether the problem was that it was pf+ vs. CE or whether it's because of the all-VLAN config of the SG-1100, but it was easier to just import the APU config since all the major settings were identical.
After some fiddling I was able to get iperf through the tunnel up to ~150 Mbps:
[ ID] Interval           Transfer     Bandwidth
[  4]   0.00-120.00 sec  2.05 GBytes   147 Mbits/sec                  sender
[  4]   0.00-120.00 sec  2.05 GBytes   147 Mbits/sec                  receiver

iperf Done.
but it's clear from the dashboard that I'm limited by the MBT-2220:
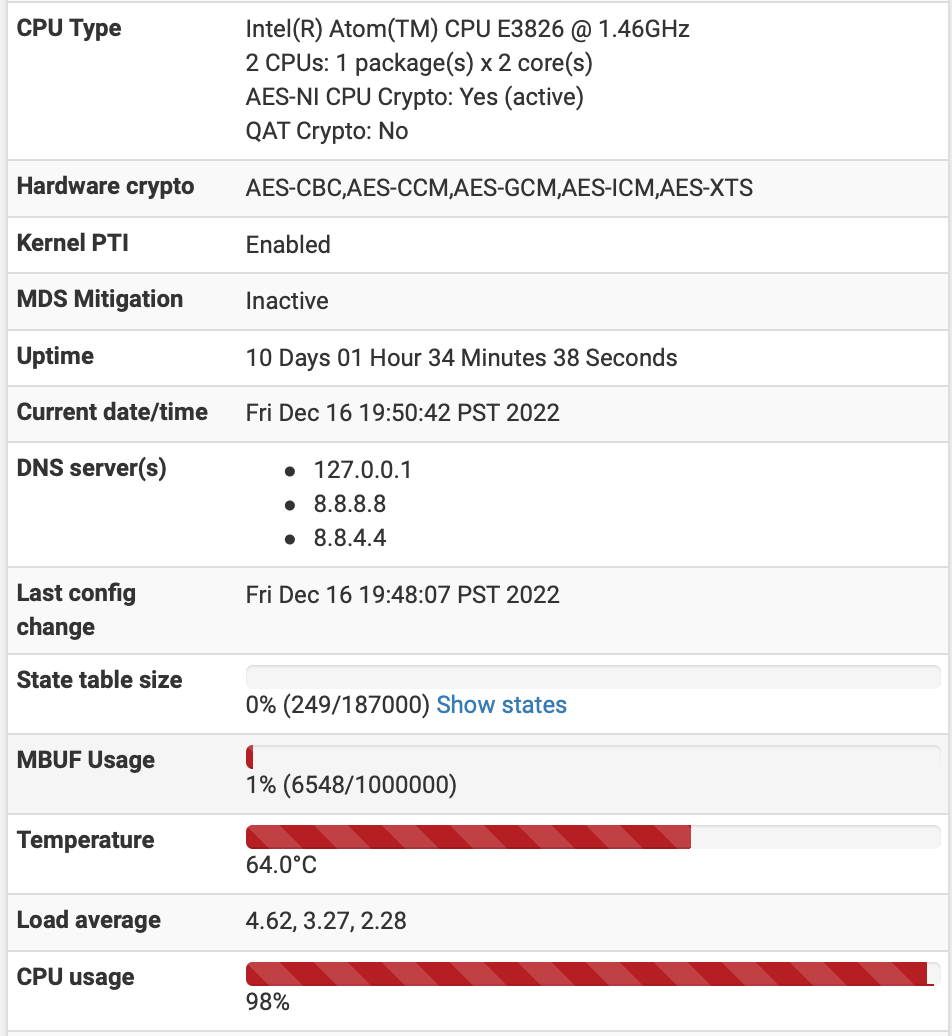
and not by the FW4C:
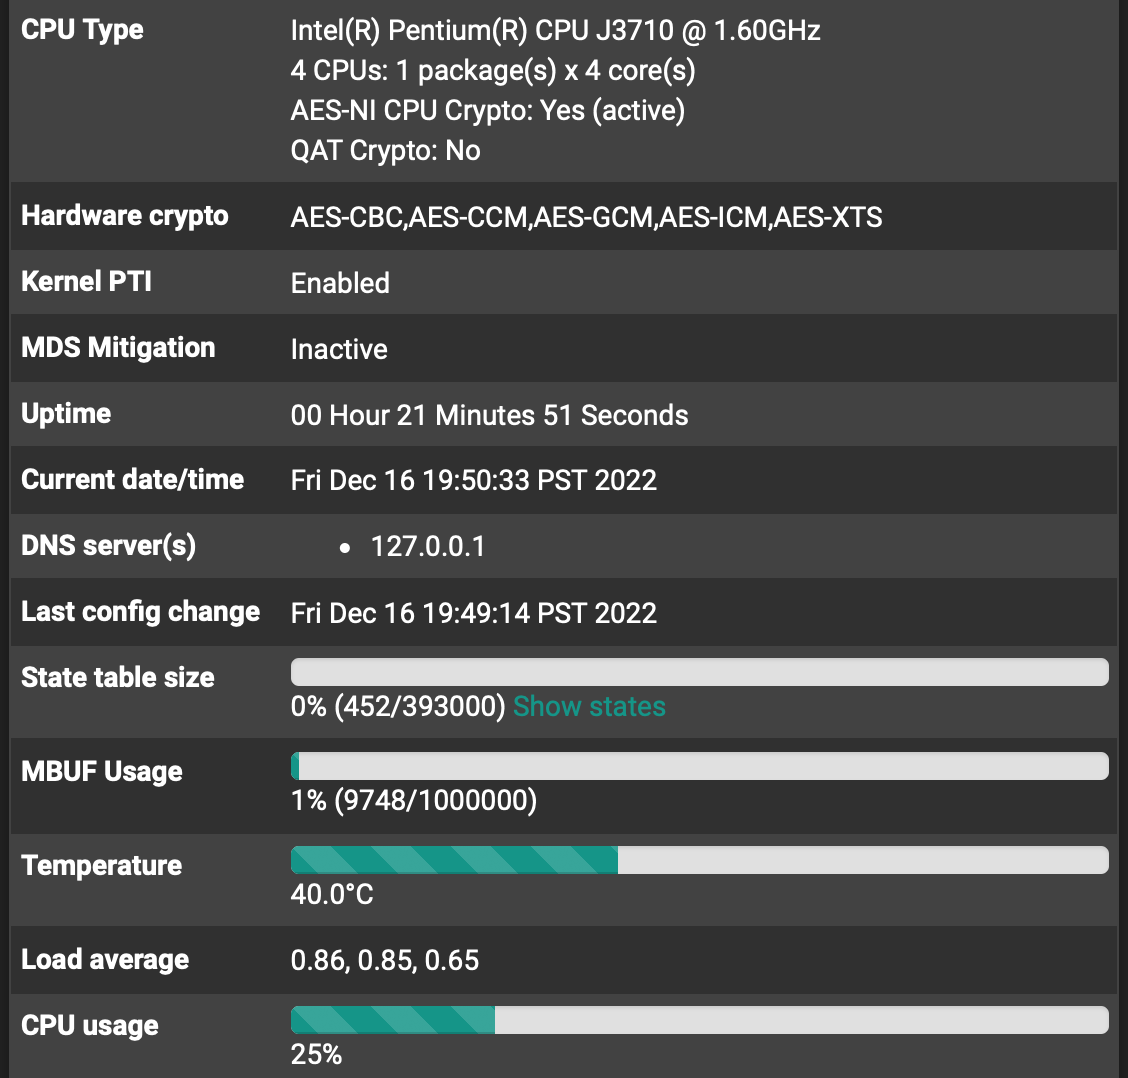
These screen caps were taken during a 120s run of iperf3, between two hosts behind each respective pfsense appliance (e.g. iperf is NOT running on the pfsense box itself), so the CPU and temps had plenty of time to stabilize.
It was interesting to note that enabling async crypto on either box reduced the throughput by ~10%.
So I'm back to where I was with the SG-1100 and AES-GCM/SafeXce

 ️, but hopefully more stable. I did not capture CPU usage between the SG-1100 and the MBT-2220, but maybe I'll do that later tonight when everyone else goes to bed.
Though I'm hoping that upgrading the MBT-2220 box to another FW4C at the main office will get me closer to line rate.
-
@thewaterbug
Other notes:- Nice hardware!
- I like having both HDMI and serial console output, especially since I can never remember how to get GNU/screen to work properly on my Mac.
- I also like have a real power button. Pulling the plug on hardware without one always gives me the willies.
- The Kensington lock slot is a nice feature, too.
- It runs HOT during pfsense installation!
- It cooled down significantly after installation was finished, but I'll be sure to keep an eye on temps during iperf testing.
- Nice hardware!
-
Other other notes:
The SG-1100 was pretty limited, as it would only speedtest to about 250/350, whereas the APU it replaced would speedtest around 450/450.
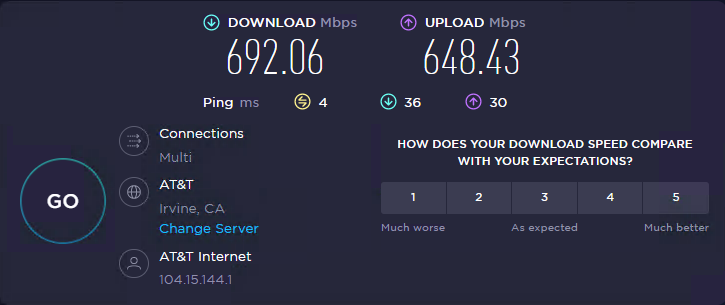
MBT-2220 at my main office will speedtest around 700/650:
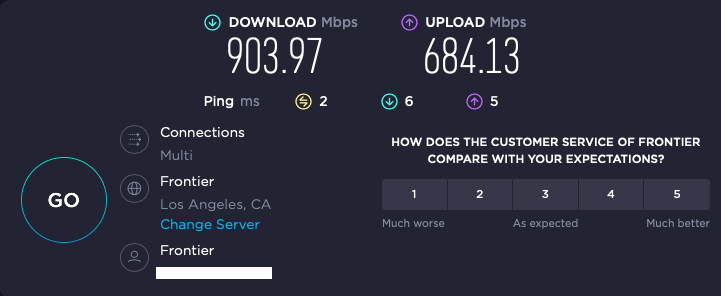
while a PC behind my new FW4C at my home will speedtest around 900/700:
My main office is on commercial fiber, and the speedtest results are pretty consistent from run to run.
My home office is on residential Frontier fiber, and the results vary a lot from run to run.
-
Increasing the TCP window size via -w e.g.:
./iperf3 -w 1M -c 192.168.0.13gets the IPSec throughput up to ~160 Mbps:
[ ID] Interval           Transfer     Bandwidth
[  4]   0.00-10.00  sec   193 MBytes   162 Mbits/sec                  sender
[  4]   0.00-10.00  sec   192 MBytes   161 Mbits/sec                  receiver
Increasing -w beyond 1M did not improve throughput, and actually drastically increased the variability.
-
What's the latency between the sites?
What does
top -HaSPshop is using the CPU on the MBT? I would expect it to pass significantly more than 100Mbps IPSec if that's all that's using the CPU cycles.Steve
-
@stephenw10 said in Just got a Protectli FW4C!:
What's the latency between the sites?
What does
top -HaSPshop is using the CPU on the MBT? I would expect it to pass significantly more than 100Mbps IPSec if that's all that's using the CPU cycles.Steve
That's what I would have thought, too. Maybe I'm doing something wrong.
Ping from a host behind the FW4C directly to the MBT-2220 reports 10 ms, with very low variability.
Here's 'top -HaSP' from an SSH into the MBT-2220 when I'm running:
./iperf3 -w 1M -c 192.168.0.13 -t120from a host behind the FW4C to a host behind the MBT-2220 running ./iperf3 -s:
last pid: 67105;  load averages:  3.05,  2.07,  1.35                                up 12+04:33:46  22:49:50
201 threads:   9 running, 168 sleeping, 8 zombie, 16 waiting
CPU 0:  2.7% user, 47.1% nice,  5.1% system, 45.1% interrupt,  0.0% idle
CPU 1:  0.8% user,  0.0% nice, 99.2% system,  0.0% interrupt,  0.0% idle
Mem: 128M Active, 680M Inact, 361M Wired, 172M Buf, 702M Free
Swap: 1357M Total, 1357M Free

  PID USERNAME    PRI NICE   SIZE    RES STATE    C   TIME    WCPU COMMAND
    0 root        -76    -     0B   480K CPU1     1 484:24  98.47% [kernel{if_io_tqg_1}]
   12 root        -72    -     0B   272K RUN      0 105:44  43.33% [intr{swi1: netisr 1}]
91723 root        100   20   274M   237M RUN      0  28:31  31.68% /usr/local/bin/snort -R _8880 -D -q --sup
93147 root         97   20   143M   101M RUN      0  13:46  20.22% /usr/local/bin/snort -R _23537 -D -q --su
94107 root         20    0    19M  7176K bpf      0   4:00   0.84% /usr/local/bandwidthd/bandwidthd
91749 root         20    0    24M    12M bpf      0   3:55   0.78% /usr/local/bandwidthd/bandwidthd
92092 root         20    0    19M  7164K bpf      0   3:59   0.71% /usr/local/bandwidthd/bandwidthd
92166 root         20    0    18M  6044K bpf      0   4:22   0.63% /usr/local/bandwidthd/bandwidthd
93910 root         20    0    24M    12M RUN      0   3:56   0.62% /usr/local/bandwidthd/bandwidthd
91240 root         20    0    23M    11M RUN      1   3:59   0.58% /usr/local/bandwidthd/bandwidthd
94153 root         20    0    18M  6056K bpf      0   4:24   0.57% /usr/local/bandwidthd/bandwidthd
92418 root         20    0    23M    11M bpf      0   4:00   0.50% /usr/local/bandwidthd/bandwidthd
   21 root        -16    -     0B    16K -        0  10:19   0.42% [rand_harvestq]
66950 root         20    0    13M  3836K CPU0     0   0:00   0.20% top -HaSP
   11 root        155 ki31     0B    32K RUN      0 275.5H   0.11% [idle{idle: cpu0}]
    0 root        -76    -     0B   480K -        0   8:17   0.05% [kernel{if_config_tqg_0}]
   18 root        -16    -     0B    16K pftm     0   6:31   0.03% [pf purge]
   11 root        155 ki31     0B    32K RUN      1 274.5H   0.03% [idle{idle: cpu1}]
    0 root        -76    -     0B   480K -        0 452:41   0.03% [kernel{if_io_tqg_0}]
   12 root        -60    -     0B   272K WAIT     1   3:13   0.03% [intr{swi4: clock (0)}]
30781 root         20    0    12M  2992K bpf      0   2:48   0.02% /usr/local/sbin/filterlog -i pflog0 -p /v
31201 root         20    0    19M  9272K select   0   0:00   0.02% sshd: admin@pts/0 (sshd)
   22 root        -16    -     0B    48K psleep   1   2:13   0.02% [pagedaemon{dom0}]
55261 root         20    0    16M  2704K nanslp   0   2:20   0.02% /usr/local/bin/dpinger -S -r 0 -i WANGW -
51056 root         20    0    11M  2624K select   0   2:36   0.01% /usr/sbin/syslogd -s -c -c -l /var/dhcpd/
94039 root         20    0    53M    21M uwait    0   0:17   0.01% /usr/local/libexec/ipsec/charon --use-sys
55665 root         20    0    16M  2704K nanslp   0   2:22   0.01% /usr/local/bin/dpinger -S -r 0 -i WANGW2
and here's 'top -Hasp' when it returns to idle:
last pid: 26393;  load averages:  1.26,  1.81,  1.36                                up 12+04:36:09  22:52:13
201 threads:   3 running, 173 sleeping, 8 zombie, 17 waiting
CPU 0:  0.0% user,  0.0% nice,  0.0% system,  0.0% interrupt,  100% idle
CPU 1:  0.0% user,  0.0% nice,  0.4% system,  0.0% interrupt, 99.6% idle
Mem: 128M Active, 680M Inact, 361M Wired, 172M Buf, 702M Free
Swap: 1357M Total, 1357M Free

  PID USERNAME    PRI NICE   SIZE    RES STATE    C   TIME    WCPU COMMAND
   11 root        155 ki31     0B    32K RUN      0 275.6H  99.71% [idle{idle: cpu0}]
   11 root        155 ki31     0B    32K CPU1     1 274.5H  99.58% [idle{idle: cpu1}]
66950 root         20    0    13M  3860K CPU0     0   0:00   0.16% top -HaSP
    0 root        -76    -     0B   480K -        0 452:41   0.06% [kernel{if_io_tqg_0}]
91723 root         41   20   274M   237M bpf      1  28:35   0.06% /usr/local/bin/snort -R _8880 -D -q --sup
   21 root        -16    -     0B    16K -        1  10:19   0.05% [rand_harvestq]
    0 root        -76    -     0B   480K -        0   8:18   0.05% [kernel{if_config_tqg_0}]
    0 root        -76    -     0B   480K -        1 484:36   0.03% [kernel{if_io_tqg_1}]
93147 root         41   20   143M   101M bpf      0  13:48   0.03% /usr/local/bin/snort -R _23537 -D -q --su
   18 root        -16    -     0B    16K pftm     0   6:31   0.02% [pf purge]
30781 root         20    0    12M  2992K bpf      1   2:48   0.02% /usr/local/sbin/filterlog -i pflog0 -p /v
31201 root         20    0    19M  9272K select   0   0:00   0.01% sshd: admin@pts/0 (sshd)
   12 root        -60    -     0B   272K WAIT     0   3:13   0.01% [intr{swi4: clock (0)}]
55665 root         20    0    16M  2704K nanslp   1   2:22   0.01% /usr/local/bin/dpinger -S -r 0 -i WANGW2
55261 root         20    0    16M  2704K nanslp   0   2:20   0.01% /usr/local/bin/dpinger -S -r 0 -i WANGW -
   26 root         16    -     0B    16K syncer   0   1:33   0.01% [syncer]
   22 root        -16    -     0B    48K psleep   0   2:13   0.01% [pagedaemon{dom0}]
87172 dhcpd        20    0    23M    11M select   0   2:15   0.01% /usr/local/sbin/dhcpd -user dhcpd -group
51056 root         20    0    11M  2624K select   0   2:36   0.01% /usr/sbin/syslogd -s -c -c -l /var/dhcpd/
25478 root         20    0    15M  5756K select   0   1:03   0.01% /usr/local/sbin/miniupnpd -f /var/etc/min
28107 root         20    0    16M  6100K select   1   0:46   0.01% /usr/local/sbin/openvpn --config /var/etc
   19 root        -16    -     0B    16K tzpoll   1   0:16   0.01% [acpi_thermal]
   12 root        -88    -     0B   272K WAIT     1   0:52   0.01% [intr{irq257: ahci0}]
79640 root         20    0    18M  5984K select   1   1:27   0.01% /usr/local/sbin/ntpd -g -c /var/etc/ntpd.
   12 root        -72    -     0B   272K WAIT     0 105:49   0.01% [intr{swi1: netisr 1}]
   12 root        -72    -     0B   272K WAIT     1  68:40   0.00% [intr{swi1: netisr 0}]
   24 root         20    -     0B    48K qsleep   0   0:55   0.00% [bufdaemon{bufdaemon}]
The IPSec tunnel is running:
AES_GCM_16 (128)
PRF_HMAC_SHA2_256
MODP_2048and other relevant (?) settings on the MBT-2220 are as follows:
AES-NI CPU Crypto: Yes (active)
QAT Crypto: No
Hardware crypto AES-CBC,AES-CCM,AES-GCM,AES-ICM,AES-XTS
Kernel PTI Enabled
MDS Mitigation Inactive
Async Crypto: Unchecked, because checking it reduces my iperf throughput by ~10 - 15%.Disable hardware checksum offload: Unchecked
Disable hardware TCP segmentation offload: Unchecked
Disable hardware large receive offload: Unchecked
Enable the ALTQ support for hn NICs: UncheckedAll System Tunables are set to "default"
I would love some advice on optimizing this tunnel!
-
I just turned off snort, and the CPU usage of snort goes away, but the tunnel isn't any faster:
last pid: 83841; load averages: 2.07, 1.38, 1.23 up 12+04:48:23 23:04:27 197 threads: 3 running, 169 sleeping, 8 zombie, 17 waiting CPU 0: 7.8% user, 0.0% nice, 48.2% system, 25.5% interrupt, 18.4% idle CPU 1: 8.6% user, 0.0% nice, 62.4% system, 8.2% interrupt, 20.8% idle Mem: 49M Active, 451M Inact, 358M Wired, 172M Buf, 1013M Free Swap: 1357M Total, 1357M Free PID USERNAME PRI NICE SIZE RES STATE C TIME WCPU COMMAND 0 root -76 - 0B 480K - 1 485:48 53.74% [kernel{if_io_tqg_1}] 12 root -72 - 0B 272K WAIT 0 106:28 34.43% [intr{swi1: netisr 1}] 0 root -76 - 0B 480K - 0 453:09 32.67% [kernel{if_io_tqg_0}] 11 root 155 ki31 0B 32K RUN 0 275.8H 26.60% [idle{idle: cpu0}] 11 root 155 ki31 0B 32K RUN 1 274.7H 21.55% [idle{idle: cpu1}] 11582 root 52 0 139M 42M accept 0 0:23 2.40% php-fpm: pool nginx (php-fpm){php-fpm} 47524 root 22 0 110M 38M accept 0 0:22 1.90% php-fpm: pool nginx (php-fpm){php-fpm} 86080 root 24 0 140M 42M accept 0 0:22 1.06% php-fpm: pool nginx (php-fpm){php-fpm} 91749 root 20 0 24M 12M bpf 1 3:56 0.60% /usr/local/bandwidthd/bandwidthd 93910 root 20 0 24M 12M bpf 0 3:56 0.58% /usr/local/bandwidthd/bandwidthd 94107 root 20 0 19M 7176K bpf 0 4:00 0.58% /usr/local/bandwidthd/bandwidthd 92092 root 20 0 19M 7164K bpf 0 4:00 0.57% /usr/local/bandwidthd/bandwidthd 92418 root 20 0 23M 11M bpf 1 4:01 0.51% /usr/local/bandwidthd/bandwidthd 91240 root 20 0 23M 11M bpf 0 4:00 0.49% /usr/local/bandwidthd/bandwidthd 94153 root 20 0 18M 6056K bpf 1 4:24 0.46% /usr/local/bandwidthd/bandwidthd 92166 root 20 0 18M 6044K bpf 1 4:23 0.44% /usr/local/bandwidthd/bandwidthd 21 root -16 - 0B 16K - 0 10:20 0.36% [rand_harvestq] 80342 root 20 0 29M 9108K kqread 0 1:09 0.28% nginx: worker process (nginx) 66950 root 20 0 13M 3860K CPU1 1 0:02 0.24% top -HaSP 94039 root 20 0 53M 21M select 1 0:23 0.15% /usr/local/libexec/ipsec/charon --use-sys 94039 root 20 0 53M 21M uwait 1 0:15 0.13% /usr/local/libexec/ipsec/charon --use-sys 69851 nobody 20 0 14M 4668K select 1 5:02 0.10% /usr/local/sbin/dnsmasq --all-servers -C 25478 root 20 0 15M 5756K select 1 1:03 0.08% /usr/local/sbin/miniupnpd -f /var/etc/min 94039 root 20 0 53M 21M uwait 0 0:18 0.07% /usr/local/libexec/ipsec/charon --use-sys 0 root -76 - 0B 480K - 1 8:18 0.05% [kernel{if_config_tqg_0}] 79640 root 20 0 18M 5984K select 0 1:27 0.05% /usr/local/sbin/ntpd -g -c /var/etc/ntpd. 51056 root 20 0 11M 2624K select 0 2:36 0.05% /usr/sbin/syslogd -s -c -c -l /var/dhcpd/ -
Hmm, well without Snort it's not CPU limited. It could be something in the route throttling it. Potentially throttling IPSec specifically. You might try forcing NAT-T if it's not connecting with NAT-T now as a test.
I would also try an iperf test between the sites outside the tunnel just to confirm you can pass more bandwidth that way.Steve
-
Thanks! I'll try forcing NAT-T later tonight when there's less traffic on my residential service (Frontier Gig Fiber). Speedtest and every other test seems to be very highly variable from this site during the day; it's more consistent late at night when, presumably, fewer people are using it.
In late evenings my home office (FW4C) will typically speedtest 900/700, whereas right now it's testing 600/600.
My main office (MBT-2220) is on commercial fiber, and it's more consistently at 700/650.
Both lines are nominally 1000/1000. I've put a different device at the edge of my office network and speedtested 922/885, so the MBT-2220 is limited in some respect just for speedtest.
I enabled port-forwarding through both pfense routers, and iperf from a host behind my FW4C to a host port-forwarded through the MBT-2220 reports:
./iperf3 -w 1M -c <main.office.public.ip>
Connecting to host <main.office.public.ip>, port 5201
[  6] local 192.168.1.230 port 56528 connected to <main.office.public.ip> port 5201
[ ID] Interval           Transfer     Bandwidth
[  6]   0.00-1.00   sec  44.4 MBytes   373 Mbits/sec
[  6]   1.00-2.00   sec  52.9 MBytes   444 Mbits/sec
[  6]   2.00-3.00   sec  53.5 MBytes   449 Mbits/sec
[  6]   3.00-4.00   sec  53.0 MBytes   444 Mbits/sec
[  6]   4.00-5.00   sec  52.7 MBytes   442 Mbits/sec
[  6]   5.00-6.00   sec  53.5 MBytes   449 Mbits/sec
[  6]   6.00-7.00   sec  53.6 MBytes   449 Mbits/sec
[  6]   7.00-8.00   sec  53.5 MBytes   449 Mbits/sec
[  6]   8.00-9.00   sec  53.4 MBytes   448 Mbits/sec
[  6]   9.00-10.00  sec  53.5 MBytes   449 Mbits/sec
- - - - - - - - - - - - - - - - - - - - - - - - -
[ ID] Interval           Transfer     Bandwidth
[  6]   0.00-10.00  sec   524 MBytes   440 Mbits/sec                  sender
[  6]   0.00-10.00  sec   524 MBytes   440 Mbits/sec                  receiver
The reverse, iperf from a host behind my MBT-2220 to a host port-forwarded through the FW4C reports:
iperf3 -w 2M -c <home.office.public.ip>
Connecting to host <home.office.public.ip>, port 5201
[  4] local 192.168.0.13 port 49174 connected to <home.office.public.ip> port 5201
[ ID] Interval           Transfer     Bandwidth
[  4]   0.00-1.00   sec  43.4 MBytes   363 Mbits/sec
[  4]   1.00-2.00   sec  45.1 MBytes   378 Mbits/sec
[  4]   2.00-3.00   sec  45.4 MBytes   381 Mbits/sec
[  4]   3.00-4.00   sec  45.2 MBytes   380 Mbits/sec
[  4]   4.00-5.00   sec  45.4 MBytes   380 Mbits/sec
[  4]   5.00-6.00   sec  44.2 MBytes   372 Mbits/sec
[  4]   6.00-7.01   sec  37.9 MBytes   316 Mbits/sec
[  4]   7.01-8.00   sec  23.1 MBytes   195 Mbits/sec
[  4]   8.00-9.01   sec  17.0 MBytes   142 Mbits/sec
[  4]   9.01-10.01  sec  15.6 MBytes   131 Mbits/sec
- - - - - - - - - - - - - - - - - - - - - - - - -
[ ID] Interval           Transfer     Bandwidth
[  4]   0.00-10.01  sec   362 MBytes   304 Mbits/sec                  sender
[  4]   0.00-10.01  sec   361 MBytes   302 Mbits/sec                  receiver
although it varies a lot from run to run.
-
Well its above 100Mbps at least so it's not something restricting all traffic in the path. It may still be ESP traffic though.
I would also test setting some MSS values on the tunnel. If you are seeing packet fragmentation it can really hurt throughput.
Steve
-
For what its worth i did have a similar issue like yours with IPsec throughput. Moving to NAT-T and having packets encapsulated with UDP helped alot. There was something in the path not liking ESP and clearly reducing my speed because of it.
-
@stephenw10 said in Just got a Protectli FW4C!:
Well its above 100Mbps at least so it's not something restricting all traffic in the path. It may still be ESP traffic though.
I would also test setting some MSS values on the tunnel. If you are seeing packet fragmentation it can really hurt throughput.
Steve
@michmoor said in Just got a Protectli FW4C!:
For what its worth i did have a similar issue like yours with IPsec throughput. Moving to NAT-T and having packets encapsulated with UDP helped alot. There was something in the path not liking ESP and clearly reducing my speed because of it.
Thanks for both of your suggestions.
I turned on MSS clamping with a max value of 1392, and my best throughput did increase from ~160 Mbps up to ~220:
[ ID] Interval           Transfer     Bandwidth
[  4]   0.00-10.00  sec   262 MBytes   220 Mbits/sec                  sender
[  4]   0.00-10.00  sec   259 MBytes   217 Mbits/sec                  receiver
Switching NAT-T from Auto to Force and back again did not change the results.
So it's getting better, but inch by inch.
-
You might try a much lower value just to check. I have seen IPSec tunnels that require MSS as low as 1100 to prevent fragmentation. Though not over a route as short as 10ms.
-
@stephenw10 For good measure i would test another protocol like wireguard if you can. Curious if the low performance follows.
-
@stephenw10 said in Just got a Protectli FW4C!:
You might try a much lower value just to check. I have seen IPSec tunnels that require MSS as low as 1100 to prevent fragmentation. Though not over a route as short as 10ms.
Ok, I'll try that tonight. Does the MSS have to be set on both sides of the tunnel? And does the tunnel have to be disconnected and reconnected in order for the new value to take effect?
-
@michmoor said in Just got a Protectli FW4C!:
@stephenw10 For good measure i would test another protocol like wireguard if you can. Curious if the low performance follows.
The problem with WG is that I don't have a baseline, and Protectli doesn't, either. So if I get some performance number, I won't know if it's higher, lower, or exactly as expected.
I also was not successful in setting it up last time I tried.
Whereas for IPSec, we have a Netgate person letting us know that I'm way under expectations.
But WG testing would be useful down the road, once I have IPSec established and optimized.
-
It should only need to be set on one side but it doesn't hurt to se it on both.
-
@thewaterbug Not sure it was asked but what Phase 2 parameters are you using?
-
Both Phase 1 and Phase 2 are AES-GCM-128, SHA256, and DH14.
-
@thewaterbug Ahhh theres one more setting that helped out a lot for me. PowerD settings. Enable and set to either Maximum or HiAdaptative.
When i was running OPNsense on a Protectli a year ago i had problems with poor performance on Wireguard. The recommendation was to enable this. Once i did that things moved a lot better.