Just got a Protectli FW4C!
-
@thewaterbug to take the whole iperf thing out of the equation I use Speedtest running on a container. Just run and go to your server. The end.
https://hub.docker.com/r/openspeedtest/latest -
Remember iperf is deliberately single threaded, even when you run multiple parallel streams. So if the client device you are running it on has a large number of relatively slow CPU cores you may need to run multiple iperf instances to use multiple cores.
Though that would affect any traffic so if you can get line rate between the sites outside the tunnel it's not he problem.Steve
-
I'm stumped. I put the second FW4C at the main office yesterday, so I now have these new units on both ends of the tunnel, configured as similarly as possible.
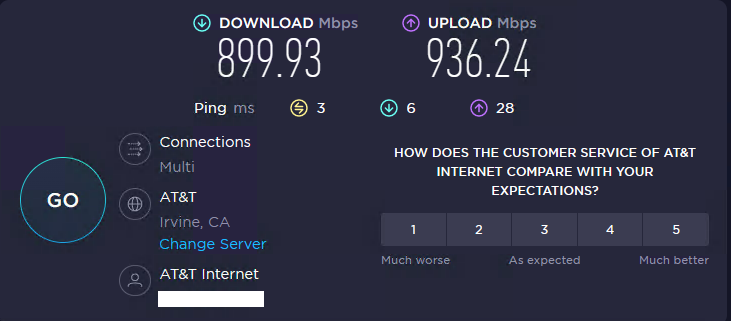
The main office (1000/1000 AT&T Business Fiber) will Speedtest at 900/900+:
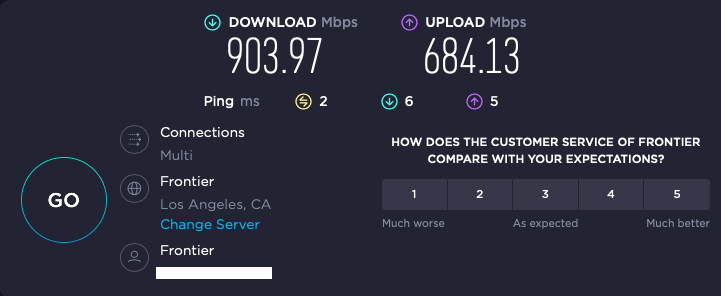
while the home office (1000/1000 Fronter Gig Fiber) will Speedtest at 900/700.:
iperf through the tunnel from my home office to my main office is variable, but has achieved throughput as high at 560 Mbps:
./iperf3 -w 4M -c 192.168.0.4 -t120s[ 4] 0.00-120.00 sec 7.83 GBytes 561 Mbits/sec sender [ 4] 0.00-120.00 sec 7.83 GBytes 560 Mbits/sec receiverbut reversing the direction drops the throughput down to ~120 Mbps:
./iperf3 -w 4M -c 192.168.0.4 -t120s -R[ 4] 0.00-120.00 sec 1.72 GBytes 123 Mbits/sec sender [ 4] 0.00-120.00 sec 1.72 GBytes 123 Mbits/sec receiver receiverCPU utilization never got higher than 20% on either side, and core temps never above 59º, and that was on the sending side (Main office). On the receiving side the core temps were around 45º. So neither side is working very hard.
If I iperf to the same host through a port forward, the throughput goes way down to <<<<< 100 Mbps, which doesn't make any sense.
And in every case, pushing bits from the main office to my home office is always dramatically slower than it is in the other direction, which is unfortunate because that's the direction I really need the speed (e.g. for an off-site backup repo).
-
Actually scratch that part about the port forward. Now Home-->Main through a port forward is achieving good throughput:
[  6]   0.00-10.00  sec   681 MBytes   571 Mbits/sec                  sender
[  6]   0.00-10.00  sec   678 MBytes   568 Mbits/sec                  receiver
The reverse direction is better than it was 10 minutes ago, but still a fraction of the "good" direction:
[ 6] 0.00-10.00 sec 272 MBytes 228 Mbits/sec sender [ 6] 0.00-10.00 sec 272 MBytes 228 Mbits/sec receiver -
Ok, that's outside the tunnel though so it shows whatever the issue is it's probably nothing to do with the IPSec encryption/decryption.
You still see ~10ms latency between the sites? Consistently?
-
Yes, and this is pings to the LAN address of the opposite router, e.g. through the IPSec tunnel:
ping 192.168.1.1 -t

Pinging 192.168.1.1 with 32 bytes of data:
Reply from 192.168.1.1: bytes=32 time=8ms TTL=63
Reply from 192.168.1.1: bytes=32 time=8ms TTL=63
Reply from 192.168.1.1: bytes=32 time=8ms TTL=63
Reply from 192.168.1.1: bytes=32 time=8ms TTL=63
Reply from 192.168.1.1: bytes=32 time=8ms TTL=63
Reply from 192.168.1.1: bytes=32 time=8ms TTL=63
Reply from 192.168.1.1: bytes=32 time=8ms TTL=63
Reply from 192.168.1.1: bytes=32 time=8ms TTL=63
Reply from 192.168.1.1: bytes=32 time=8ms TTL=63
Reply from 192.168.1.1: bytes=32 time=8ms TTL=63
Reply from 192.168.1.1: bytes=32 time=8ms TTL=63

Ping statistics for 192.168.1.1:
    Packets: Sent = 11, Received = 11, Lost = 0 (0% loss),
Approximate round trip times in milli-seconds:
    Minimum = 8ms, Maximum = 8ms, Average = 8ms
and
ping 192.168.0.1
PING 192.168.0.1 (192.168.0.1): 56 data bytes
64 bytes from 192.168.0.1: icmp_seq=0 ttl=63 time=8.856 ms
64 bytes from 192.168.0.1: icmp_seq=1 ttl=63 time=8.497 ms
64 bytes from 192.168.0.1: icmp_seq=2 ttl=63 time=8.440 ms
64 bytes from 192.168.0.1: icmp_seq=3 ttl=63 time=8.968 ms
64 bytes from 192.168.0.1: icmp_seq=4 ttl=63 time=8.544 ms
64 bytes from 192.168.0.1: icmp_seq=5 ttl=63 time=8.557 ms
64 bytes from 192.168.0.1: icmp_seq=6 ttl=63 time=8.851 ms
64 bytes from 192.168.0.1: icmp_seq=7 ttl=63 time=8.557 ms
64 bytes from 192.168.0.1: icmp_seq=8 ttl=63 time=8.494 ms
64 bytes from 192.168.0.1: icmp_seq=9 ttl=63 time=8.644 ms
64 bytes from 192.168.0.1: icmp_seq=10 ttl=63 time=8.475 ms
64 bytes from 192.168.0.1: icmp_seq=11 ttl=63 time=8.740 ms
64 bytes from 192.168.0.1: icmp_seq=12 ttl=63 time=8.438 ms
64 bytes from 192.168.0.1: icmp_seq=13 ttl=63 time=8.943 ms
^X^C
--- 192.168.0.1 ping statistics ---
14 packets transmitted, 14 packets received, 0.0% packet loss
round-trip min/avg/max/stddev = 8.438/8.643/8.968/0.184 ms
I'm stumped as to what could cause performance to be so different in different directions.
-
Something in the route throttling it probably.
-
@stephenw10 said in Just got a Protectli FW4C!:
Something in the route throttling it probably.
I'm going to take this up with AT&T (main office, business fiber), as I don't think Frontier (home office, residential fiber) will care. Someone on another group mentioned the peering agreements between the two ISPs, but I ran this test just now.
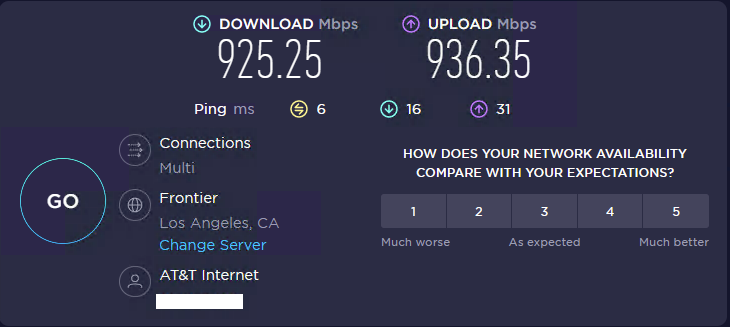
Here's Speedtest from AT&T in my Main Office, with Frontier manually selected as the Speedtest server:
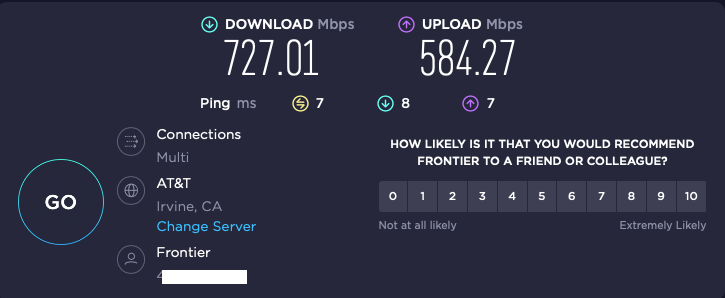
and from my Frontier in my home office, with AT&T auto-selected as the "optimal" Speedtest server:
-
@thewaterbug its completely possible there were route issues in the path. failing link, errors, etc.
When i had similar issues in the past, ive used mtr to seee the path. At times it was noticble that there was a problem othertimes not.Without additional probing at each site its impossible to tell.
I do use gateway monitoring and set the monitor IP to the remote end of either the tunnel address or the physical interface address. Might find something interesting. -
@michmoor said in Just got a Protectli FW4C!:
@thewaterbug its completely possible there were route issues in the path. failing link, errors, etc.
When i had similar issues in the past, ive used mtr to seee the path.Here's WinMTR from the main office back to my home office:
|------------------------------------------------------------------------------------------|
|                                      WinMTR statistics                                   |
|                       Host              -   %  | Sent | Recv | Best | Avrg | Wrst | Last |
|------------------------------------------------|------|------|------|------|------|------|
|                             192.168.0.1 -    0 |   85 |   85 |    0 |    0 |    0 |    0 |
|ispgtway.lightspeed.irvnca.sbcglobal.net -    0 |   85 |   85 |    0 |    0 |    1 |    0 |
|                      Request timed out. -  100 |   18 |    0 |    0 |    0 |    0 |    0 |
|                          64.148.105.208 -    0 |   85 |   85 |    2 |    2 |    3 |    2 |
|                            12.242.115.3 -    0 |   85 |   85 |    4 |    6 |   10 |    5 |
|   be3013.ccr41.lax05.atlas.cogentco.com -    0 |   85 |   85 |    4 |    5 |   25 |    4 |
|   be3059.ccr42.lax01.atlas.cogentco.com -    0 |   85 |   85 |    4 |    4 |    6 |    5 |
|be219.rcr21.b40.lax01.atlas.cogentco.com -    0 |   85 |   85 |    5 |    5 |    7 |    5 |
|                            38.88.245.26 -    0 |   85 |   85 |    4 |    7 |   33 |    8 |
|   ae1---0.cbr06.lsan.ca.frontiernet.net -    3 |   77 |   75 |    5 |    5 |    6 |    5 |
|  be10---0.lcr22.lsan.ca.frontiernet.net -    0 |   84 |   84 |    7 |   11 |   15 |   13 |
|xe-8-1-2-0.fdr01.rlhl.ca.frontiernet.net -    0 |   84 |   84 |    8 |   11 |   59 |   12 |
|                      Request timed out. -  100 |   17 |    0 |    0 |    0 |    0 |    0 |
|                      Request timed out. -  100 |   17 |    0 |    0 |    0 |    0 |    0 |
|                      Request timed out. -  100 |   17 |    0 |    0 |    0 |    0 |    0 |
|                      Request timed out. -  100 |   17 |    0 |    0 |    0 |    0 |    0 |
|                      Request timed out. -  100 |   17 |    0 |    0 |    0 |    0 |    0 |
|                      Request timed out. -  100 |   17 |    0 |    0 |    0 |    0 |    0 |
|                      Request timed out. -  100 |   17 |    0 |    0 |    0 |    0 |    0 |
|                      Request timed out. -  100 |   17 |    0 |    0 |    0 |    0 |    0 |
|                      Request timed out. -  100 |   17 |    0 |    0 |    0 |    0 |    0 |
|                      Request timed out. -  100 |   17 |    0 |    0 |    0 |    0 |    0 |
|                      Request timed out. -  100 |   17 |    0 |    0 |    0 |    0 |    0 |
|                      Request timed out. -  100 |   17 |    0 |    0 |    0 |    0 |    0 |
|                      Request timed out. -  100 |   17 |    0 |    0 |    0 |    0 |    0 |
|                      Request timed out. -  100 |   17 |    0 |    0 |    0 |    0 |    0 |
|                      Request timed out. -  100 |   17 |    0 |    0 |    0 |    0 |    0 |
|                      Request timed out. -  100 |   17 |    0 |    0 |    0 |    0 |    0 |
|                      Request timed out. -  100 |   17 |    0 |    0 |    0 |    0 |    0 |
|                      Request timed out. -  100 |   17 |    0 |    0 |    0 |    0 |    0 |
|________________________________________________|______|______|______|______|______|______|
   WinMTR v1.00 GPLv2 (original by Appnor MSP - Fully Managed Hosting & Cloud Provider)
and MTR from my home office back to the main:
Keys: Help Display mode Restart statistics Order of fields quit Packets Pings Host Loss% Snt Last Avg Best Wrst StDev 1. home.routers.host.name 0.0% 97 1.1 1.9 1.0 10.5 1.9 2. home.isp.default.gateway 0.0% 97 8.2 4.8 1.4 40.6 5.6 3. te1-7-0-4---0.lcr01.lsan.ca.frontiernet.net 0.0% 97 6.7 6.0 2.5 25.4 3.5 4. ae8---0.scr01.lsan.ca.frontiernet.net 50.5% 97 3.2 4.6 2.7 29.4 4.2 5. ae0---0.cbr05.lsan.ca.frontiernet.net 1.0% 97 29.3 9.1 3.5 34.7 6.9 6. lag-101.ear2.losangeles1.level3.net 96.9% 97 9.6 13.0 2.7 26.7 12.3 7. ae1.3510.edge1.tustin1.level3.net 0.0% 97 12.2 10.2 4.8 90.2 10.2 8. 192.205.37.145 0.0% 97 12.3 12.1 7.0 51.9 5.5 9. cr1.la2ca.ip.att.net 1.0% 97 12.5 13.6 7.4 36.9 4.9 10. gar5.lsrca.ip.att.net 0.0% 96 9.4 10.7 6.9 36.6 4.4 11. (waiting for reply) 12. 75.20.1.78 1.0% 96 32.2 8.4 5.9 32.3 4.8 13. 75.20.0.115 95.8% 96 6.8 6.9 6.8 7.2 0.2 14. 64.148.105.209 0.0% 96 7.7 10.3 7.6 37.3 5.5 -
Is there anyone on this thread in the greater LA area that could run iperf and iperf -R to my server? I can port-forward through my firewall. Please PM me if you can. Thanks!
-
@thewaterbug said in Just got a Protectli FW4C!:
I'm stumped as to what could cause performance to be so different in different directions.
It looks like this was a unit failure. The FW4C unit in my Home Office was shutting off from time to time, and with increasing frequency. I opened a ticket with Protectli, and they advance-shipped me a new one, no questioned asked, without even requiring a credit card. The replacement unit is now in place at my Home Office, with the same configuration, and here's the result of 5 hours in each direction, sequentially, and this time it's through the tunnel, and not through a port-forward:
./iperf3 -w 4M -c 192.168.0.56 -t18001s | tee iperfout.txt && sleep 60 && ./iperf3 -w 4M -c 192.168.0.56 -t18001s -R | tee iperfin.txt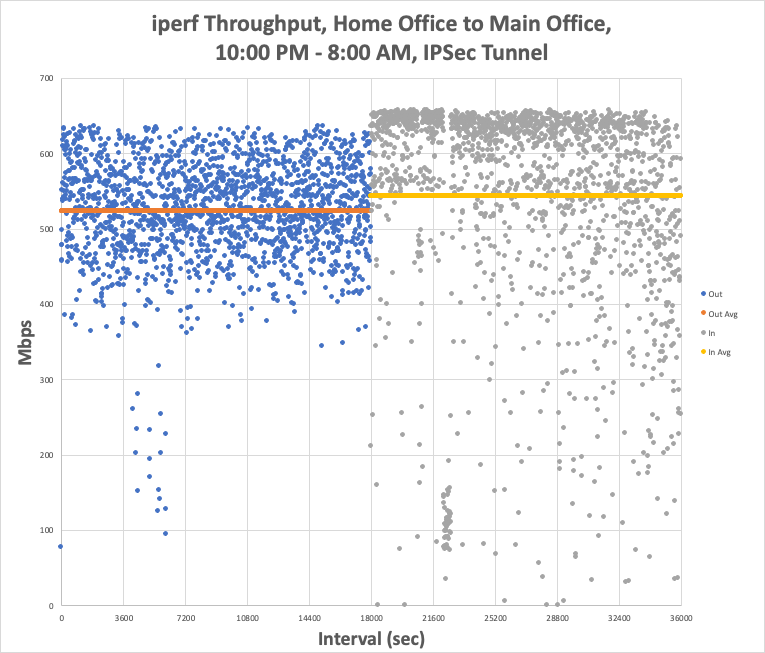
Home-to-Main (Out) averaged 524 Mbps with peaks as high as 639 Mbps, and Main-to-Home (In) averaged 544 Mbps with peaks as high as 661 Mbps. Moreover, the speeds now have a much tighter distribution, and look much more like "the Internet," with the inbound nearing some sort of limit at the mid-600s.
So this is all great news. When I started this I had reasonable expectations, and told myself I'd be happy with sustained throughput of 500 Mbps, and I'm getting that. Tonight I may repeat this through a port-forward, just to see how much the tunnel impacts throughput.
I am a bit puzzled, though, because when I put the two units side by side on my bench, with just a cable linking the WAN ports at 2.5GBaseT and no Internet, I was able to get 620 Mbps through the tunnel (I didn't think to test through a port-forward at that time). I'm having a hard time figuring out how a misbehaving unit would test reasonably well on the bench but then fail only when the internet enters the picture.
Once I have some demonstrated uptime (so I can close my ticket with Protectli for the failing unit), I may swap my SG-1100 back into place and bring the new Home Office FW4C back into the office, right next to the Main Office unit, and test WAN-to-WAN throughput again over a simple cable, both through the tunnel and through a port forward.
It's been only 36 hours on the replaced unit, but I'm now really happy with my purchases, and with Protectli support. I'm going to lob a question into their engineer about how he got 980 Mbps on his bench.
-
Different hardware/firmware revision on the NICs maybe?
-
I don't think so, because it's a brand new product.
There was definitely something wrong with the unit that I swapped out, because it was spontaneously shutting itself down.
-
Here's the port-forward test:
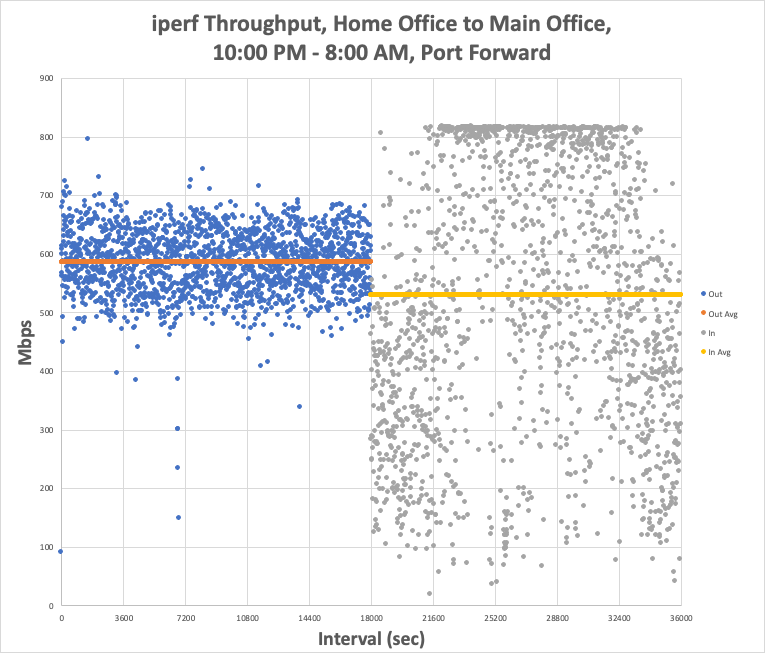
Outbound averaged 586 with a max of 812. Inbound averaged 530 with a max of 825.
-
T TheWaterbug referenced this topic on
-
T TheWaterbug referenced this topic on