IPS external logging
-
Hello everyone,
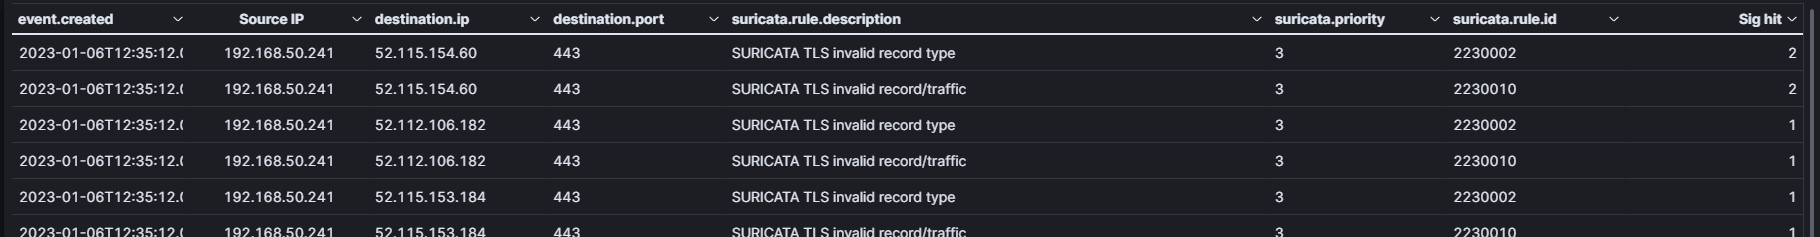
Wanted to start a discussion to see what are you guys/gals using to inject Suricata or Snort alerts.
Ive been using pfelk docker version and its ok. Heavy requirements but really just a prettier and centralized version of whats available in the GUI. Maybe im missing other free SIEM tools? There just has to be a way to knowing whats generating alerts without having to log into say...a bunch of devices.edit. At least let me show the dashboard i just created. Nothing fancy. Still digging through pfelk. Documentation is ok for installation and fwd logs from pfsense. Not alot of help when setting up dashboards. Because this is docker im not sure how to even get GeoIP data. Maybe not supported right now?
Firewall: NetGate,Palo Alto-VM,Juniper SRX
Routing: Juniper, Arista, Cisco
Switching: Juniper, Arista, Cisco
Wireless: Unifi, Aruba IAP
JNCIP,CCNP Enterprise -
This post is deleted! -
@michmoor Cool topic. I considered doing pfelk for my setup for a while - because of the native understanding of the varius pfsense (and packages) log files.
But in the end hardware requirements caused me to skip it - Also, the fact that I’m not looking to visualize firewall filter logs, but rather just have full monitoring and alerting of usage, issues and downtime. I also wanted to make all logs easily available and comparatively time trackable.
A requirement was also that the setup could run of a raspberry pi 4b (preferably as low as the 2Gb RAM model).So i installed Zabbix for SNMP and Zabbix agent monitoring of my two switches, 4 access points and two pfSenses, QNAP NAS and a few other smarthome appliances (half of it here, half in the vacation house - linked by IPSec VPN)
After that I installed LOKI (a log ingester like logstash), and Grafana. LOKI has the advantage that is does not index everything and does not require gobs of ressources. It only indexes the first labels in log messages, and then you can create rules to assign more labels based on various parameters.
Grafana is very much like Kibana, but seems more versatile to me, and in this case it uses LOKI as a datasouce for visualizing log messages and correlating them. It uses Zabbix as the datasource for all performance data/bandwidth usage/uptime+++ visualisation. These datasource types are native to Grafana, so its point and click to visualize - very very simple.
The beauty is this all runs on a Raspberry Pi 4B 2Gb RAM model with a USB SSD as storage. It’s lightning fast, and even runs Plex media Server and Openhab3 smarthome automation as well. VERY impressive performance, and if it was not for OpenHab3 (java), it would run equally brilliant on the 1Gb RAM model.
-
@keyser said in IPS external logging:
but rather just have full monitoring and alerting of usage, issues and downtime.
I use a combination of Zabbix and Graylog for email notifications. You're right, pfelk was more for visualization as i had more than one pfsense out there and wanted a central dashboard. In the end, to be honest, its more cumbersome to get it all set up and sorted out.
There is a project out there that i use personally.
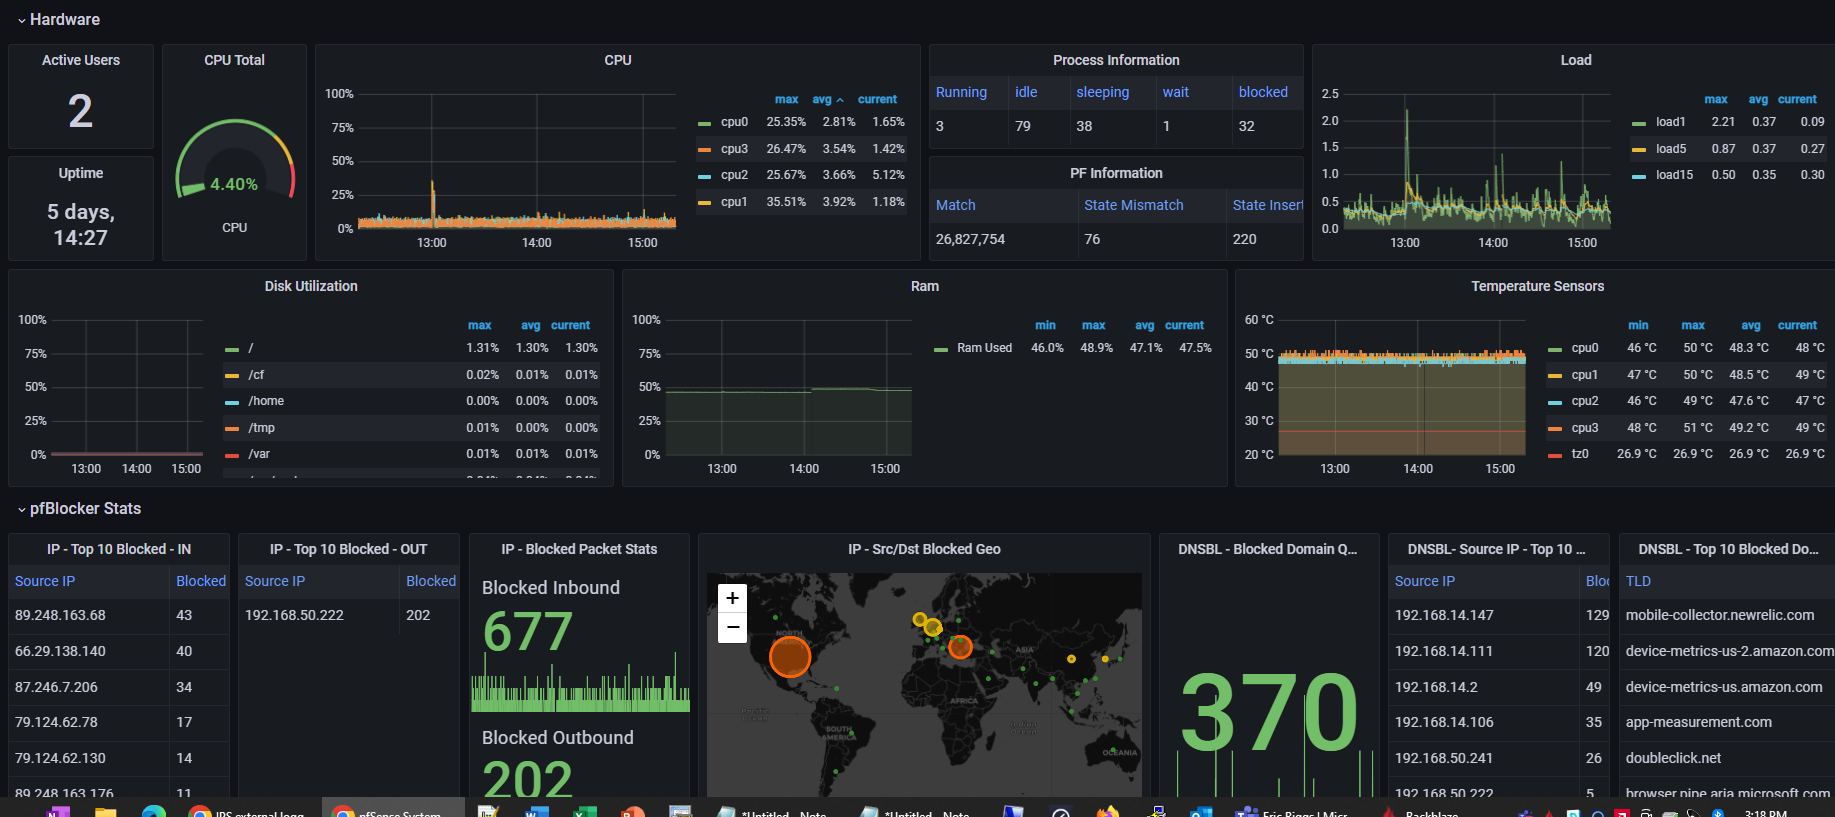
https://github.com/VictorRobellini/pfSense-DashboardI got a nice visualization in Grafana. My current dashboard
-
This post is deleted!