23.1 using more RAM
-
OK, so which process is using more memory? What does the same top output look like in 22.05?
Running Snort and Suricata is not a valid configuration but I doubt it's causing the memory issue.
Using SWAP at all is usually a sign something is misbehaving.
Steve
-
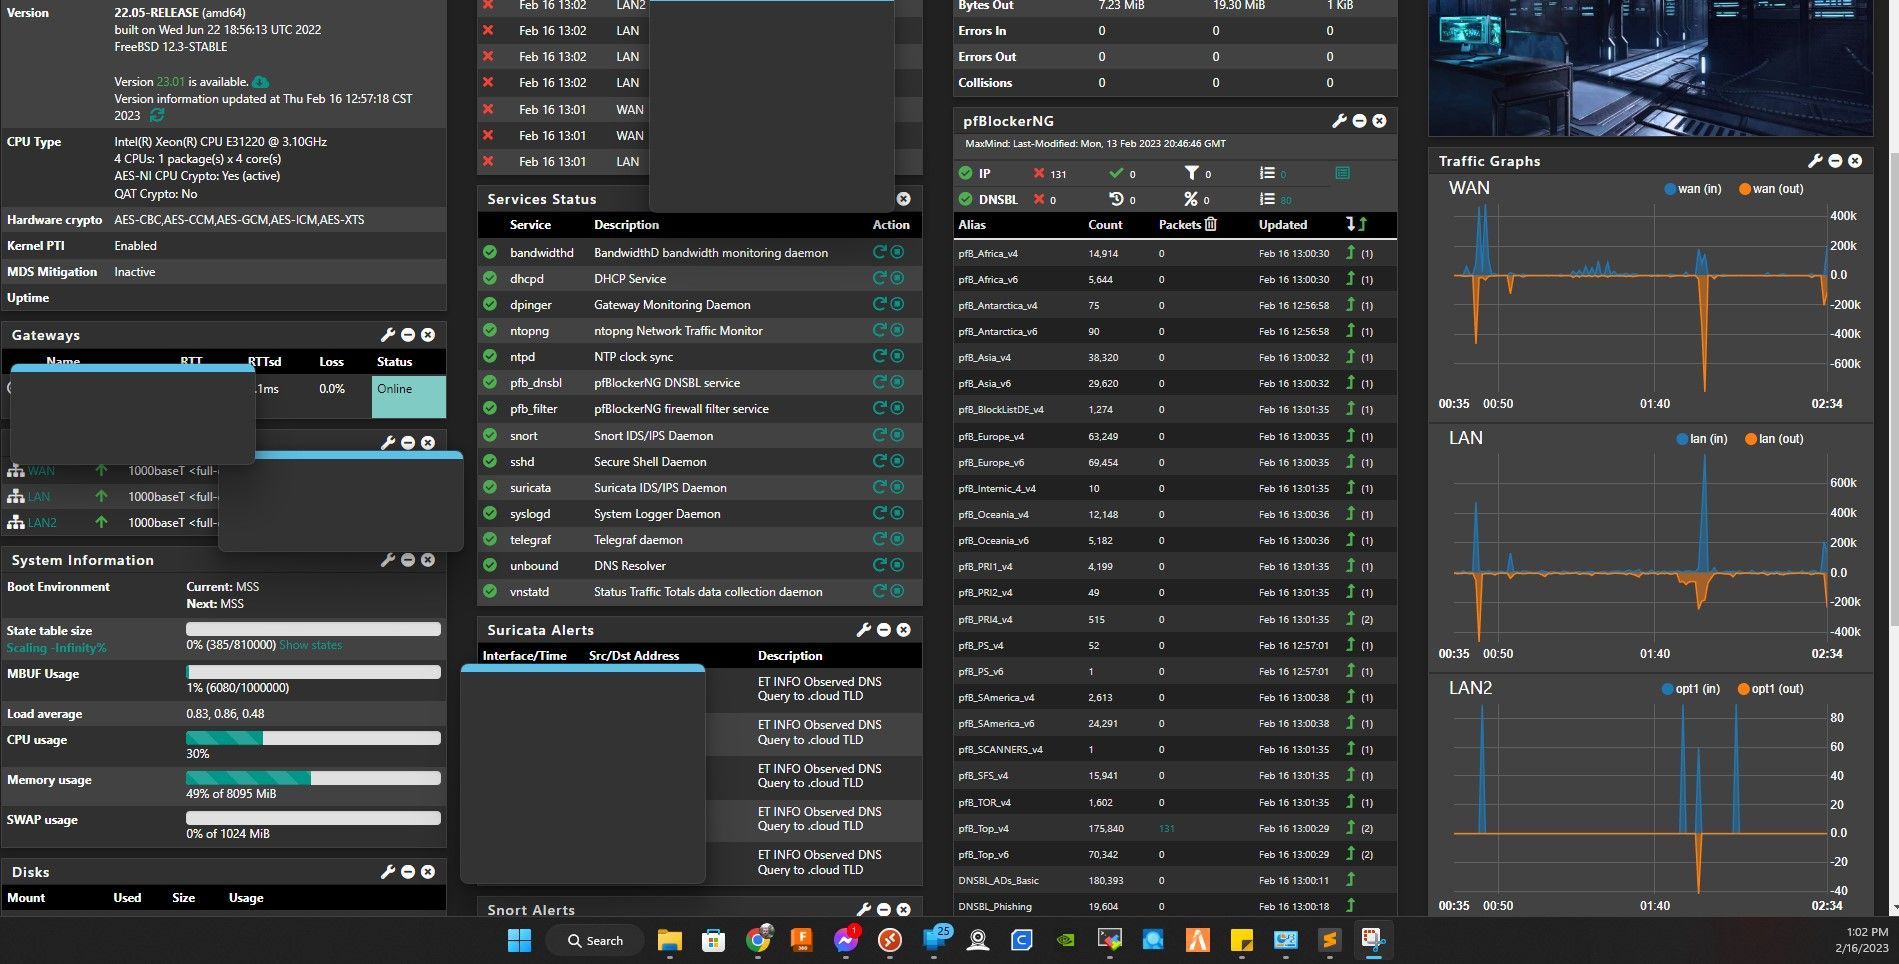
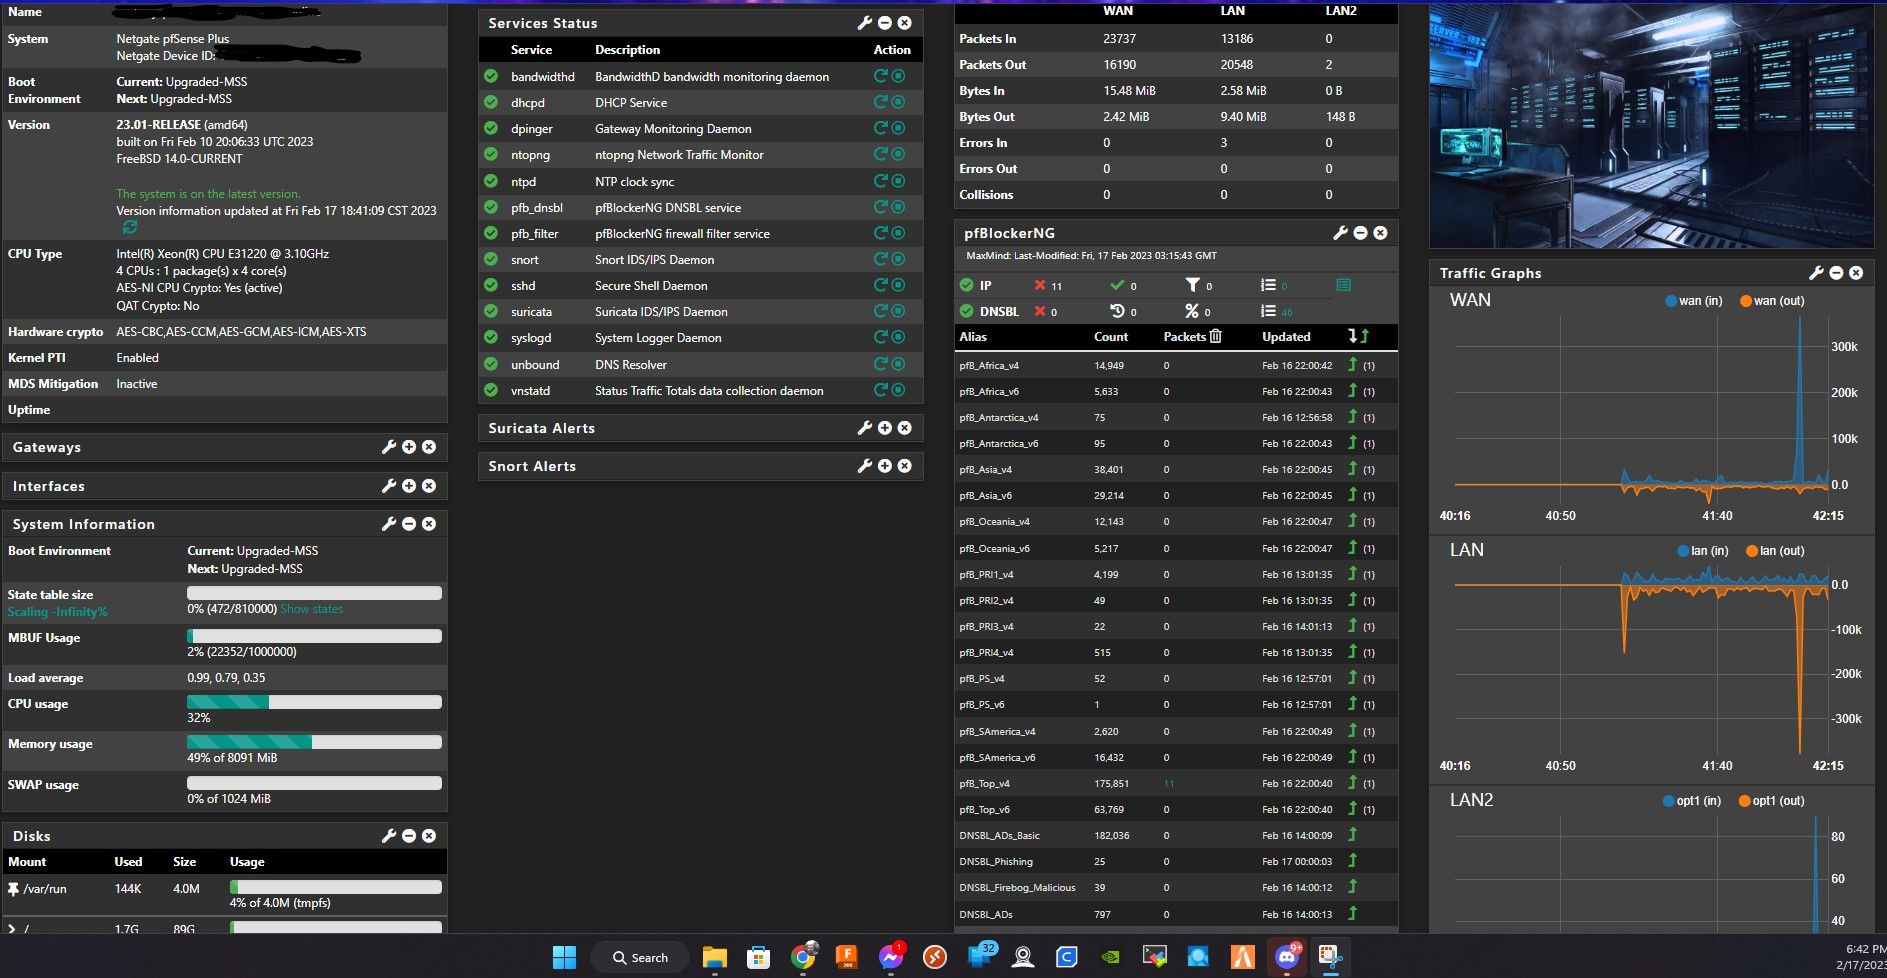
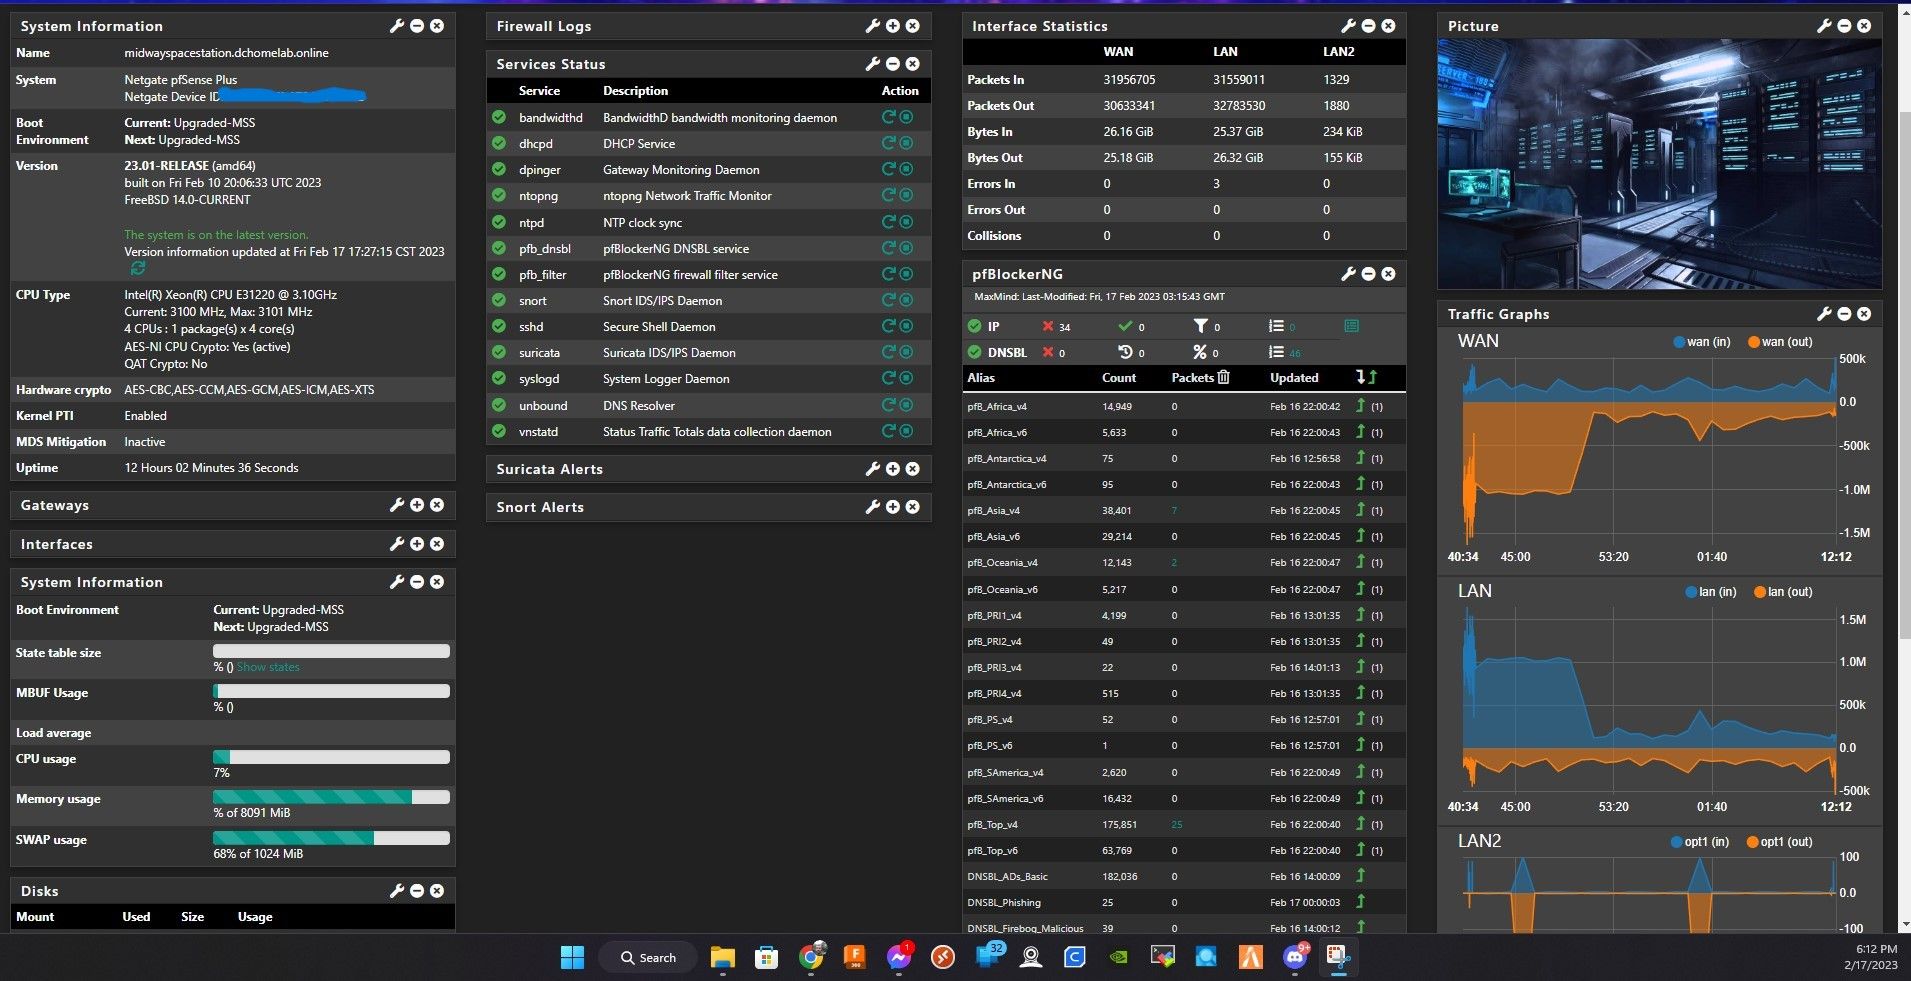
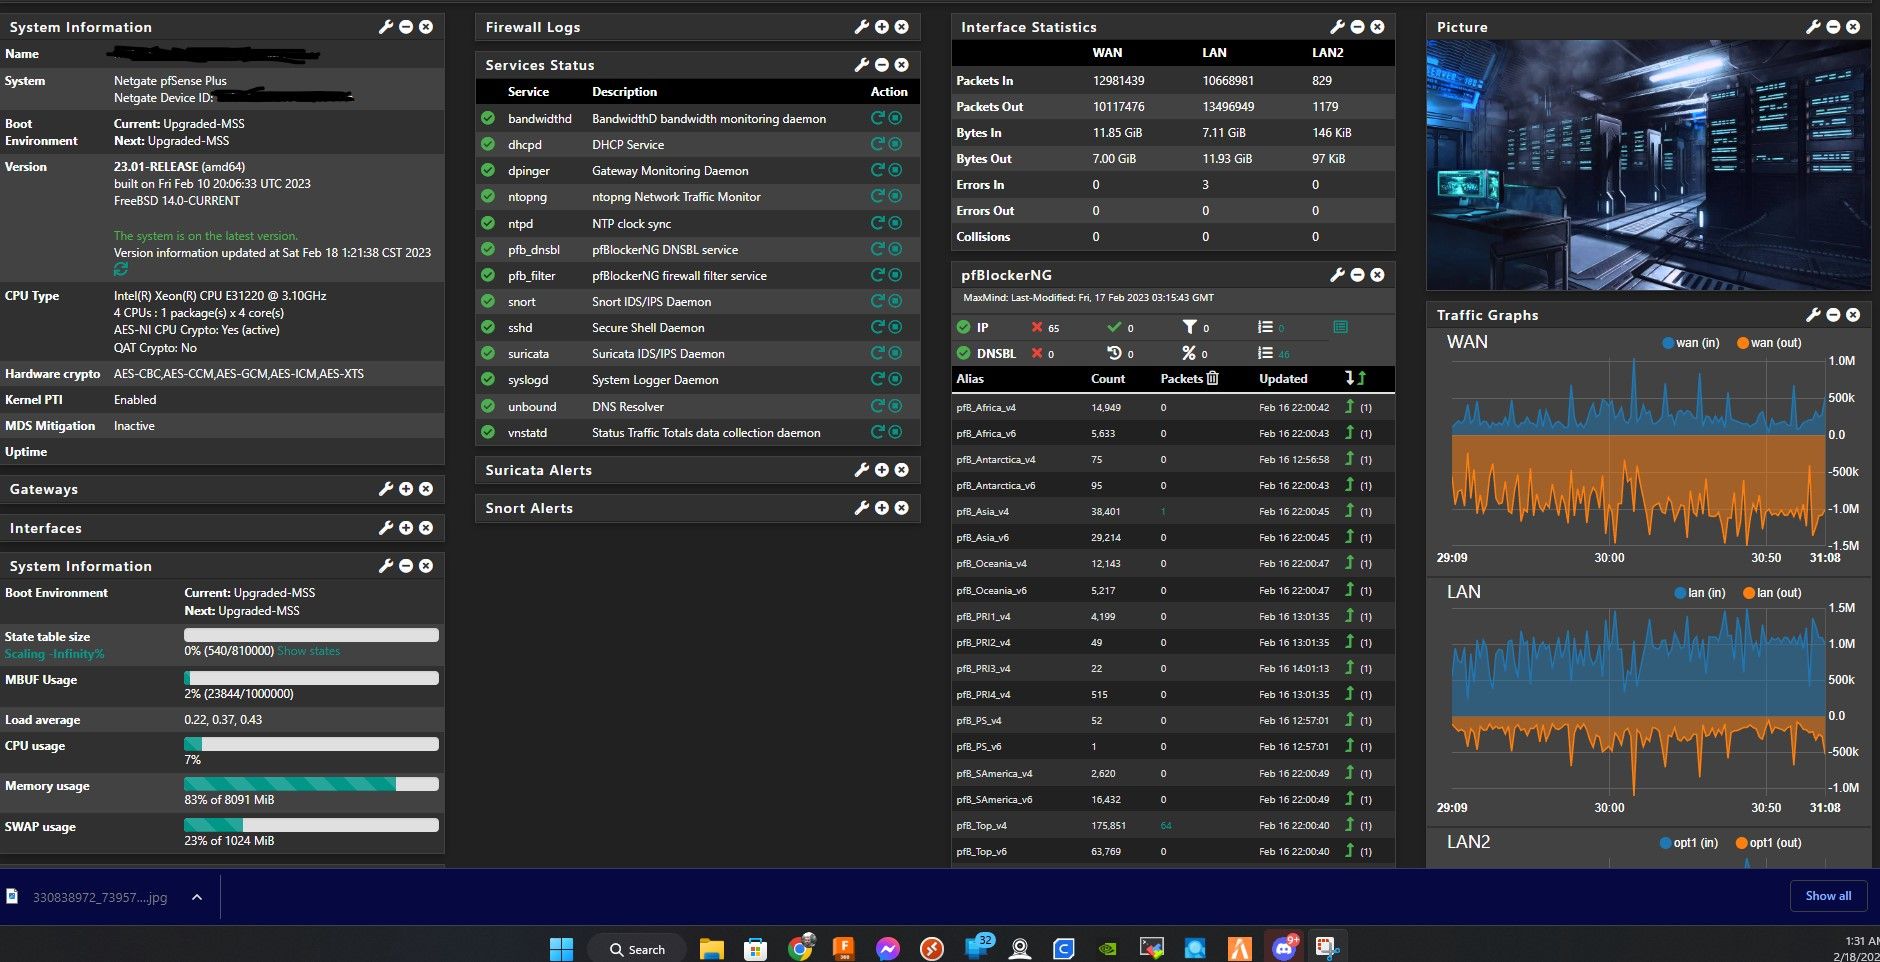
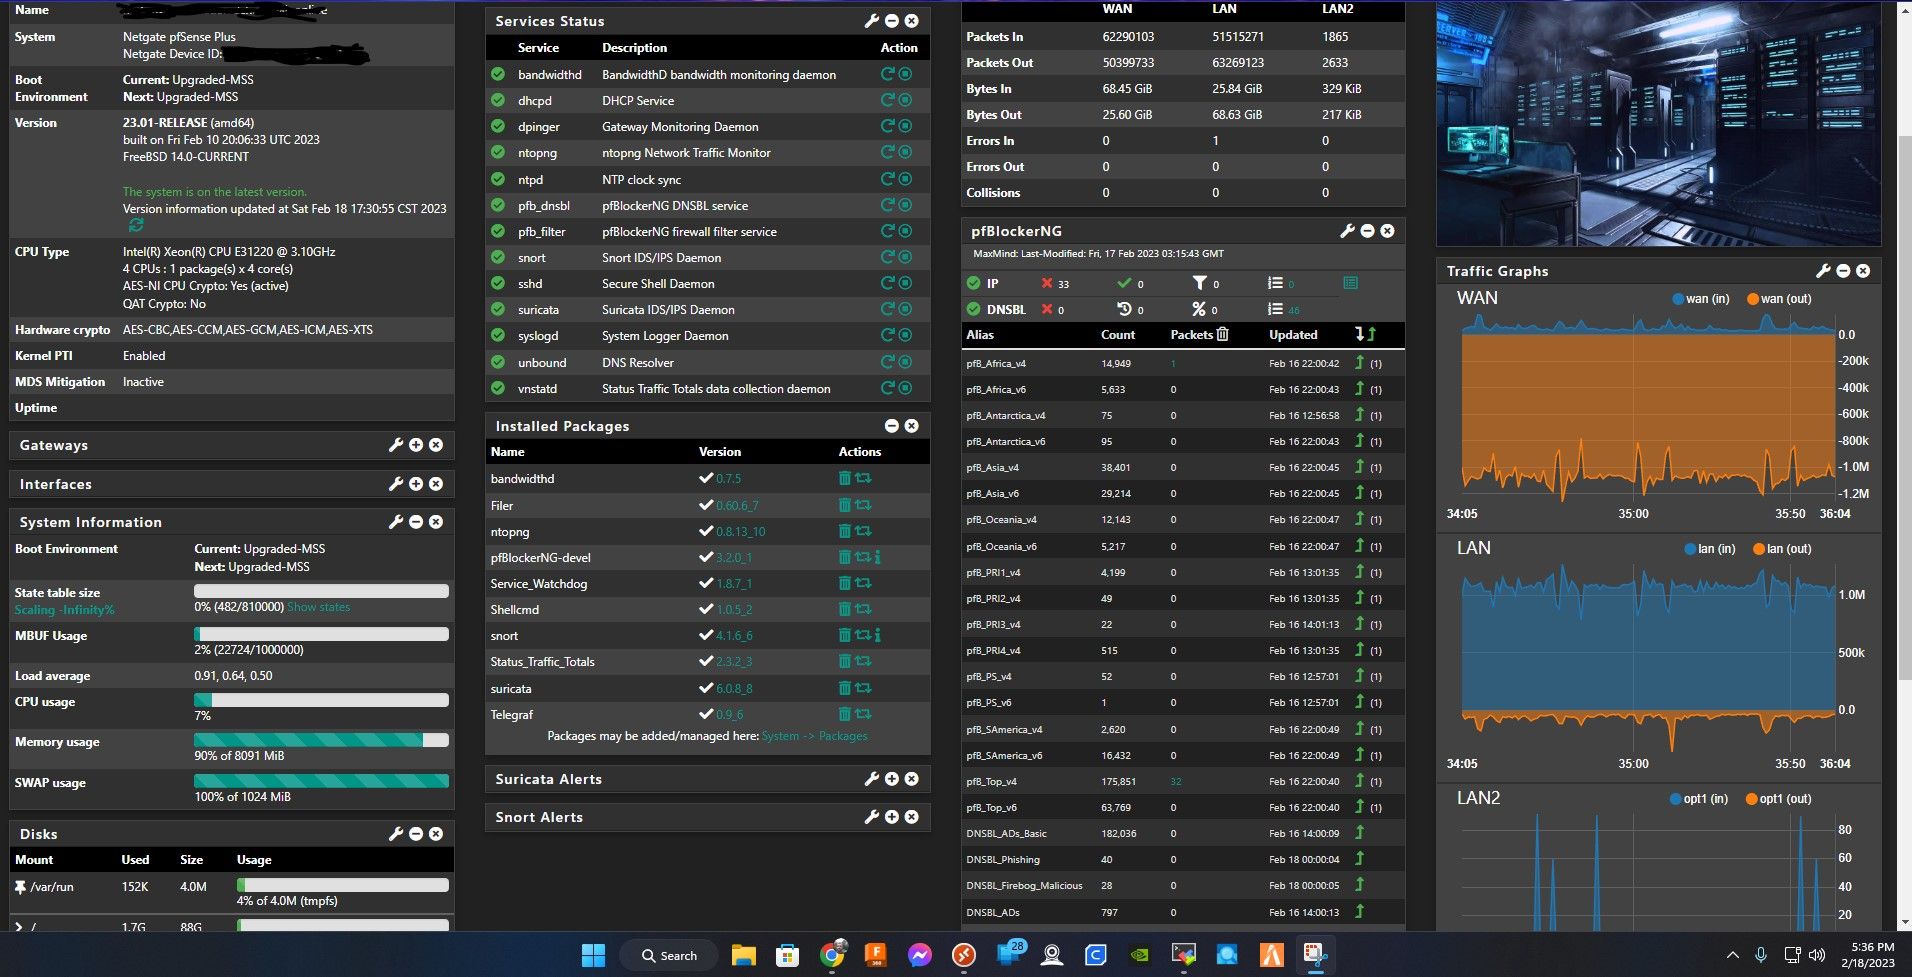
@stephenw10 lol, I know something is misbehaving since I upgraded to 23.01. I had been running just under a day with the official release of 23.01 so I havn't had as much time to test but between my earlier comment and posting screen shot to replying to you I noticed the memory use had increased and swap memory was filling up just like it was doing while running 23.01 Beta. I just now changed boot environment and here's a screenshot of my dashboard showing difference in memory usage while running 22.5 with snort, suricata and telegraf running:
-
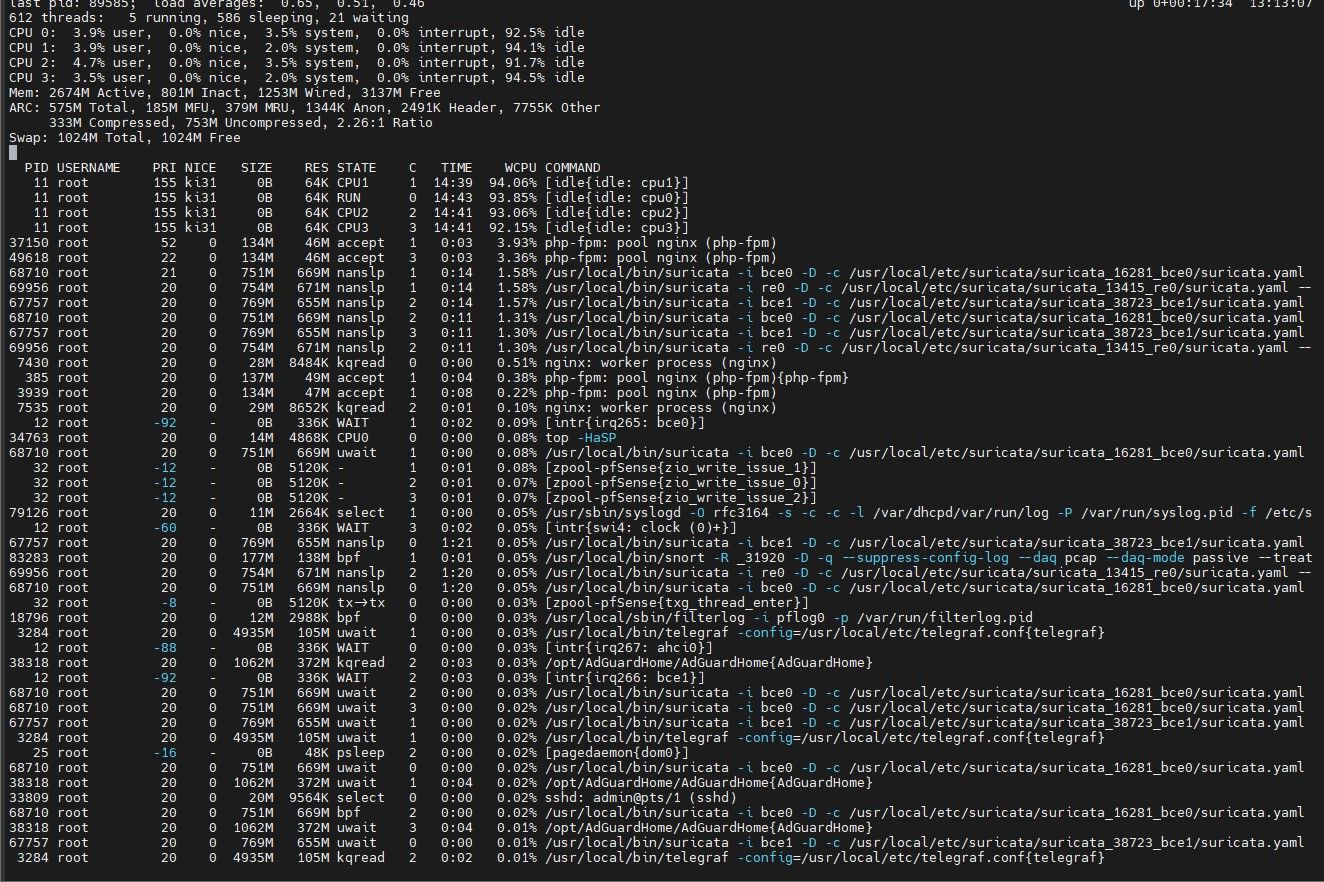
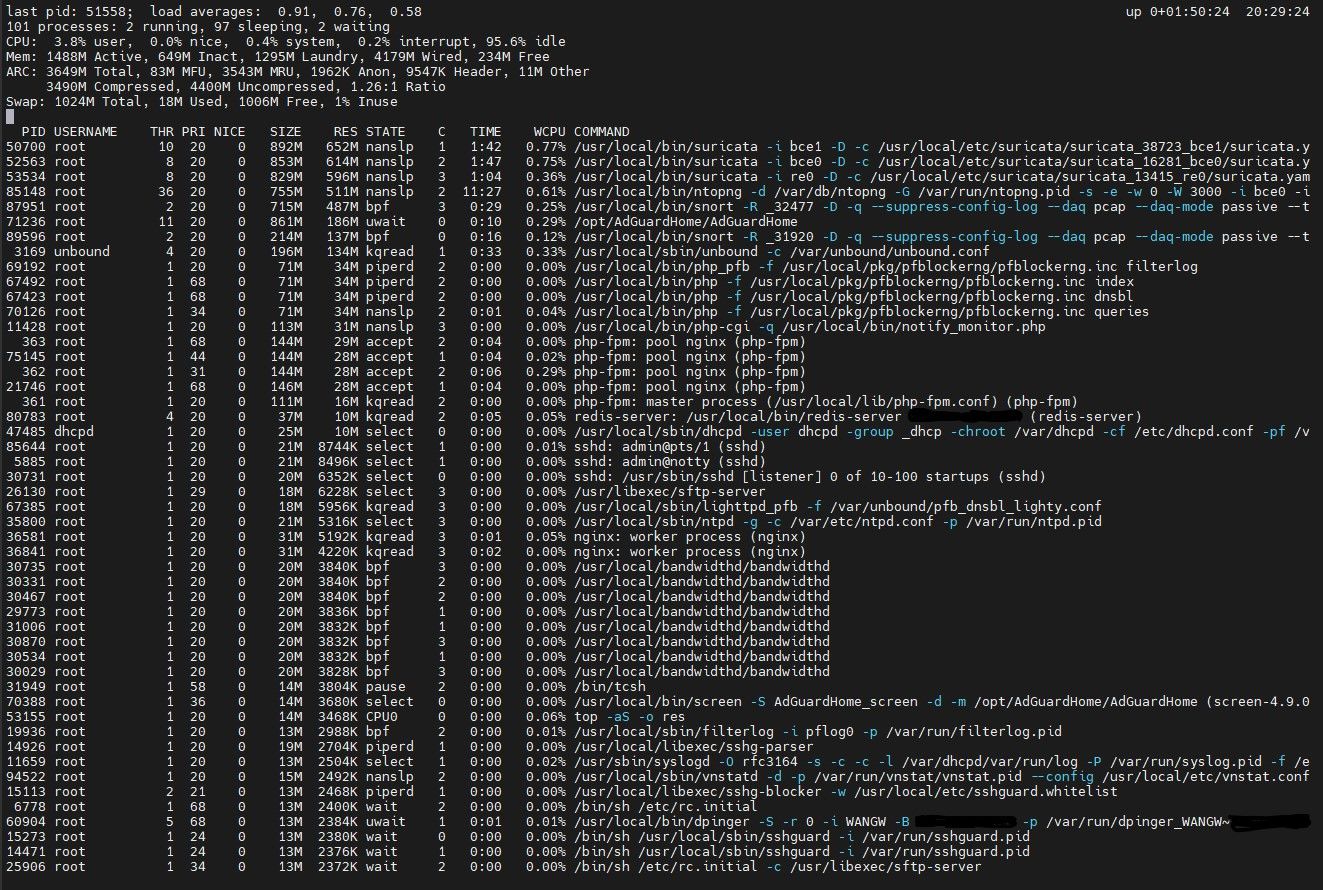
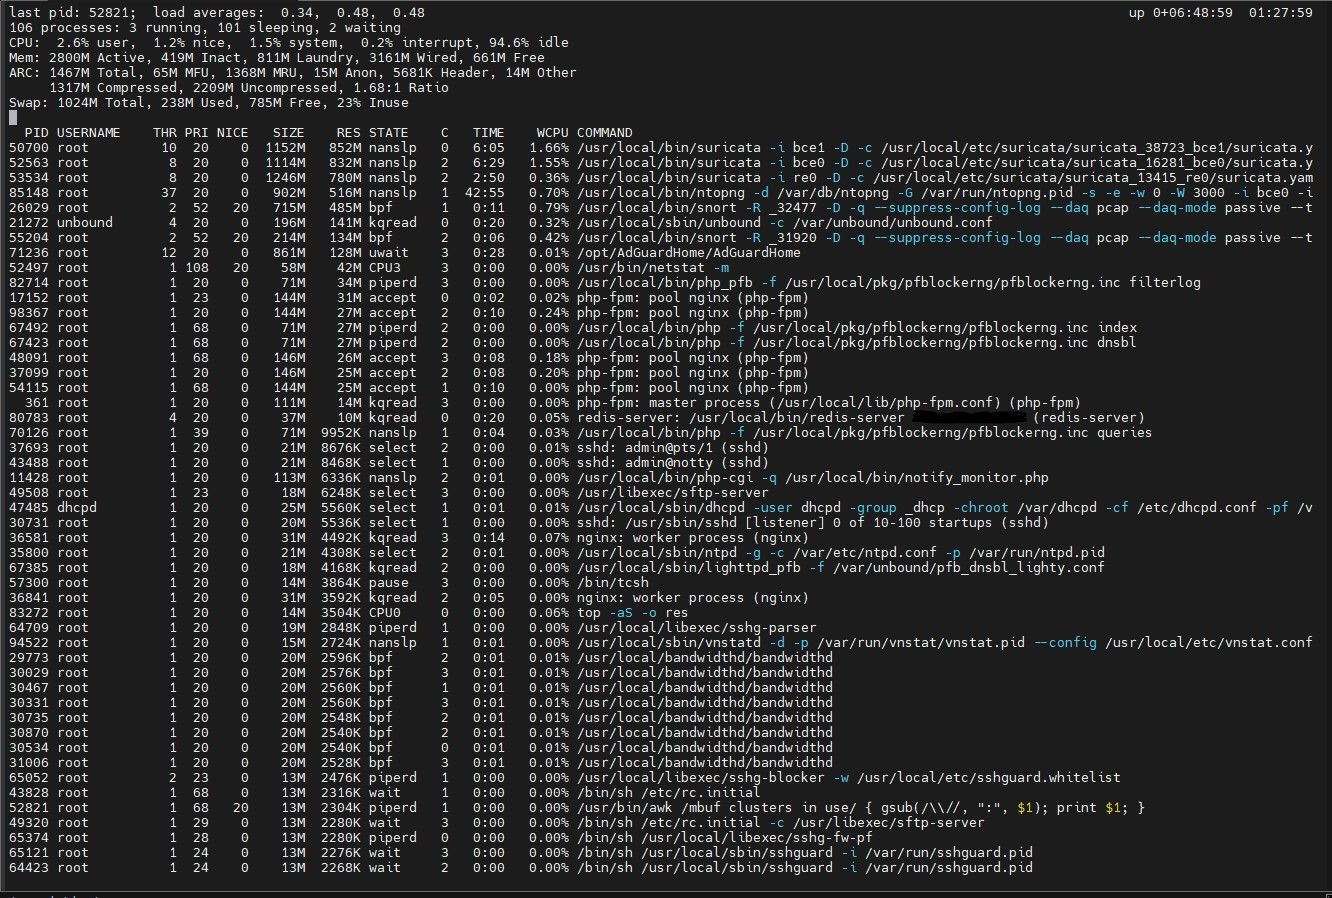
@stephenw10 And here is what I get while doing top -HaSP while running 22.5. 30% drop in memory usage just by changing back to 22.5 from 23.1 same config.
-
Mmm, well that looks like an issue with telegraf. 100MB vs 5GB!
Does the telegraph memory usage start out much higher or ramp up like it's leaking?
How is it configured?
Steve
-
@stephenw10 Same way it's configured in 22.5 ;-)
I just have the influxDB IP and credentials entered. and added this config:
[[inputs.exec]]
    commands = [
        "/usr/local/bin/telegraf_pfifgw.php",
        "sh /usr/local/bin/telegraf_temperature.sh"
    ]
    data_format = "influx"

[[inputs.tail]]
    files = ["/var/log/pfblockerng/dnsbl.log"]
    data_format = "grok"
    from_beginning = true
    name_suffix = "_dnsbl_log"
    grok_timezone = "Local"
    grok_patterns = ["^%{WORD:blocktype}-%{WORD:blocksubtype},%{SYSLOGTIMESTAMP:timestamp:ts-syslog},%{IPORHOST:domain},%{IPORHOST:src_ip:tag},%{GREEDYDATA:req_agent},%{WORD:blockmethod},%{WORD:blocklist:tag},%{IPORHOST:tld:tag},%{WORD:feed_name:tag},%{GREEDYDATA:duplicateeventstatus}"]

[[inputs.tail]]
    files = ["/var/log/pfblockerng/ip_block.log"]
    data_format = "grok"
    from_beginning = true
    name_suffix = "_ip_block_log"
    grok_timezone = "Local"
    grok_patterns = ["^%{SYSLOGTIMESTAMP:timestamp:ts-syslog},%{NUMBER:rulenum},%{DATA:interface},%{WORD:friendlyname},%{WORD:action},%{NUMBER:ip_version},%{NUMBER:protocolid},%{DATA:protocol:tag},%{IPORHOST:src_ip:tag},%{IPORHOST:dest_ip:tag},%{WORD:src_port:tag},%{NUMBER:dest_port:tag},%{WORD:direction},%{WORD:geoip_code:tag},%{DATA:ip_alias_name},%{DATA:ip_evaluated},%{DATA:feed_name:tag},%{HOSTNAME:resolvedhostname},%{GREEDYDATA:clienthostname},%{GREEDYDATA:ASN},%{GREEDYDATA:duplicateeventstatus}"]
and for the telegraf_pfifgw.php file has this to report data for my Grafana dashboard:
#!/usr/local/bin/php-cgi -f
<?php
require_once("config.inc");
require_once("gwlb.inc");
require_once("interfaces.inc");

$host = gethostname();
$source = "pfconfig";

$iflist = get_configured_interface_with_descr(true);
foreach ($iflist as $ifname => $friendly) {
    $ifinfo =  get_interface_info($ifname);
    $ifstatus = $ifinfo['status'];
    $ifconf = $config['interfaces'][$ifname];
    $ip4addr = get_interface_ip($ifname);
    $ip4subnet = get_interface_subnet($ifname);
    $ip6addr = get_interface_ipv6($ifname);
    $ip6subnet = get_interface_subnetv6($ifname);
    $realif = get_real_interface($ifname);
    $mac = get_interface_mac($realif);

    if (!isset($ifinfo)) {
        $ifinfo = "Unavailable";
    }
    if (strtolower($ifstatus) == "up") {
        $ifstatus = 1;
    }
    if (strtolower($ifstatus) == "active") {
        $ifstatus = 1;
    }
    if (strtolower($ifstatus) == "no carrier") {
        $ifstatus = 0;
    }
    if (strtolower($ifstatus) == "down") {
        $ifstatus = 0;
    }
    if (!isset($ifstatus)) {
        $ifstatus = 2;
    }
    if (!isset($ifconf)) {
        $ifconf = "Unassigned";
    }
    if (!isset($ip4addr)) {
        $ip4addr = "Unassigned";
    }
    if (!isset($ip4subnet)) {
        $ip4subnet = "0";
    }
    if (!isset($ip6addr)) {
        $ip6addr = "Unassigned";
    }
    if (!isset($ip6subnet)) {
        $ip6subnet = "Unassigned";
    }
    if (!isset($realif)) {
        $realif = "Unassigned";
    }
    if (!isset($mac)) {
        $mac = "Unavailable";
    }


    printf(
        "interface,host=%s,name=%s,ip4_address=%s,ip4_subnet=%s,ip6_address=%s,ip6_subnet=%s,mac_address=%s,friendlyname=%s,source=%s status=%s\n",
        $host,
        $realif,
        $ip4addr,
        $ip4subnet,
        $ip6addr,
        $ip6subnet,
        $mac,
        $friendly,
        $source,
        $ifstatus
    );
}

$gw_array = return_gateways_array();
//$gw_statuses is not guarranteed to contain the same number of gateways as $gw_array
$gw_statuses = return_gateways_status(true);

$debug = false;

if ($debug) {
    print_r($gw_array);
    print_r($gw_statuses);
}

foreach ($gw_array as $gw => $gateway) {

    //take the name from the $a_gateways list
    $name = $gateway["name"];

    $monitor = $gw_statuses[$gw]["monitorip"];
    $source = $gw_statuses[$gw]["srcip"];
    $delay = $gw_statuses[$gw]["delay"];
    $stddev = $gw_statuses[$gw]["stddev"];
    $loss = $gw_statuses[$gw]["loss"];
    $status = $gw_statuses[$gw]["status"];
    $status_code;
    $substatus;

    $interface = $gateway["interface"];
    $friendlyname = $gateway["friendlyiface"]; # This is not the friendly interface name so I'm not using it
    $friendlyifdescr = $gateway["friendlyifdescr"];
    $gwdescr = $gateway["descr"];
    $defaultgw = $gateway['isdefaultgw'];

    if (!isset($monitor)) {
        $monitor = "Unavailable";
    }
    if (!isset($source)) {
        $source = "Unavailable";
    }
    if (!isset($delay)) {
        $delay = "0";
    }
    if (!isset($stddev)) {
        $stddev = "0";
    }
    if (!isset($loss)) {
        $loss = "0";
    }
    if (!isset($status)) {
        $status = "Unavailable";
        $status_code = "2";
    } elseif ($status == "online") {
        $status_code = "0";
    } elseif ($status == "down") {
        $status_code = "1";
    }
    if (!isset($interface)) {
        $interface = "Unassigned";
    }
    if (!isset($friendlyname)) {
        $friendlyname = "Unassigned";
    }
    if (!isset($friendlyifdescr)) {
        $friendlyifdescr = "Unassigned";
    }
    if (!isset($gwdescr)) {
        $gwdescr = "Unassigned";
    }

    if (isset($gateway['isdefaultgw'])) {
        $defaultgw = "1";
    } else {
        $defaultgw = "0";
    }

    if (isset($gateway['monitor_disable'])) {
        $monitor = "Unmonitored";
    }

    // Some earlier versions of pfSense do not return substatus
    if (isset($gw_statuses[$gw]["substatus"])) {
        $substatus = $gw_statuses[$gw]["substatus"];
    } else {
        $substatus = "N/A";
    }

    printf(
        "gateways,host=%s,interface=%s,gateway_name=%s monitor=\"%s\",source=\"%s\",defaultgw=%s,gwdescr=\"%s\",delay=%s,stddev=%s,loss=%s,status=\"%s\",status_code=%d,substatus=\"%s\"\n",
        $host,
        $interface,
        $name, //name is required as it is possible to have 2 gateways on 1 interface.  i.e. WAN_DHCP and WAN_DHCP6
        $monitor,
        $source,
        $defaultgw,
        $gwdescr,
        floatval($delay),
        floatval($stddev),
        floatval($loss),
        $status,
        $status_code,
        $substatus
    );
};
?>
and then to report the temperatures for Grafana it has this:
#!/bin/sh HOSTNAME=$(hostname) sysctl dev.cpu | fgrep temperature | tr -d '[:blank:]' | awk -v HOST="$HOSTNAME" -F '[.:]' '{print "temperature,sensor="$2$3",host="HOST" degrees=" $5"."substr($6, 1, length($6)-1)}' sysctl hw.acpi.thermal | fgrep temperature | tr -d '[:blank:]' | awk -v HOST="$HOSTNAME" -F '[.:]' '{print "temperature,sensor="$4",host="HOST" degrees="$6"." substr($7, 1, length($7)-1)}' -
@stephenw10 OK, smelling what you stepped in. I disabled Telegraf and restarted the firewall. Thus far I'm only seeing 48% memory usage which is the lowest I've seen it with 23.01. So based on that, I'm guessing something with Telegraf, or PFSense has changed that's conficting with the config I used based on older version of PFSense that's used to report or gather data to send to influxdb for my graphs. AS my graphs are more of a fancy convenience than requirement, and I'm sure that'll be out of scope for support I'll find on here. I'm going to let it run a couple days with telegraf disabled. and if the memory usage stays under 70% and I dont see swap memory being used That'll verify my issue being something related to telegraf. which case i'll need to find an alternative. Any recomendations on a method to visualize timeseries based graphs of my network and possibly get allerts? I've played around with ntopng but it's ....... not as customizable as I'd like. And I do appreciate your assistance.
-
Yeah, that looks like a bug in telegraf to me. No way it should ever use that much memory. You config doesn't seem particularly exotic.
Yeah it would be good to know if it immediately uses a lot of memory or if if ramps up from a reasonable amount indicating a memory leak.
Steve
-
@stephenw10 Looks like it is a memory leak. I let it run for about 8 hours thus far, Then I started watching it and seen it was running a little higher around 65% and as I was tying a response to you, I looked over and it slowly ramped up to 94% with telegraf disabled. So what you need from me to help identify this memory leak or what do I do in this situatin to help get this resolved?
-
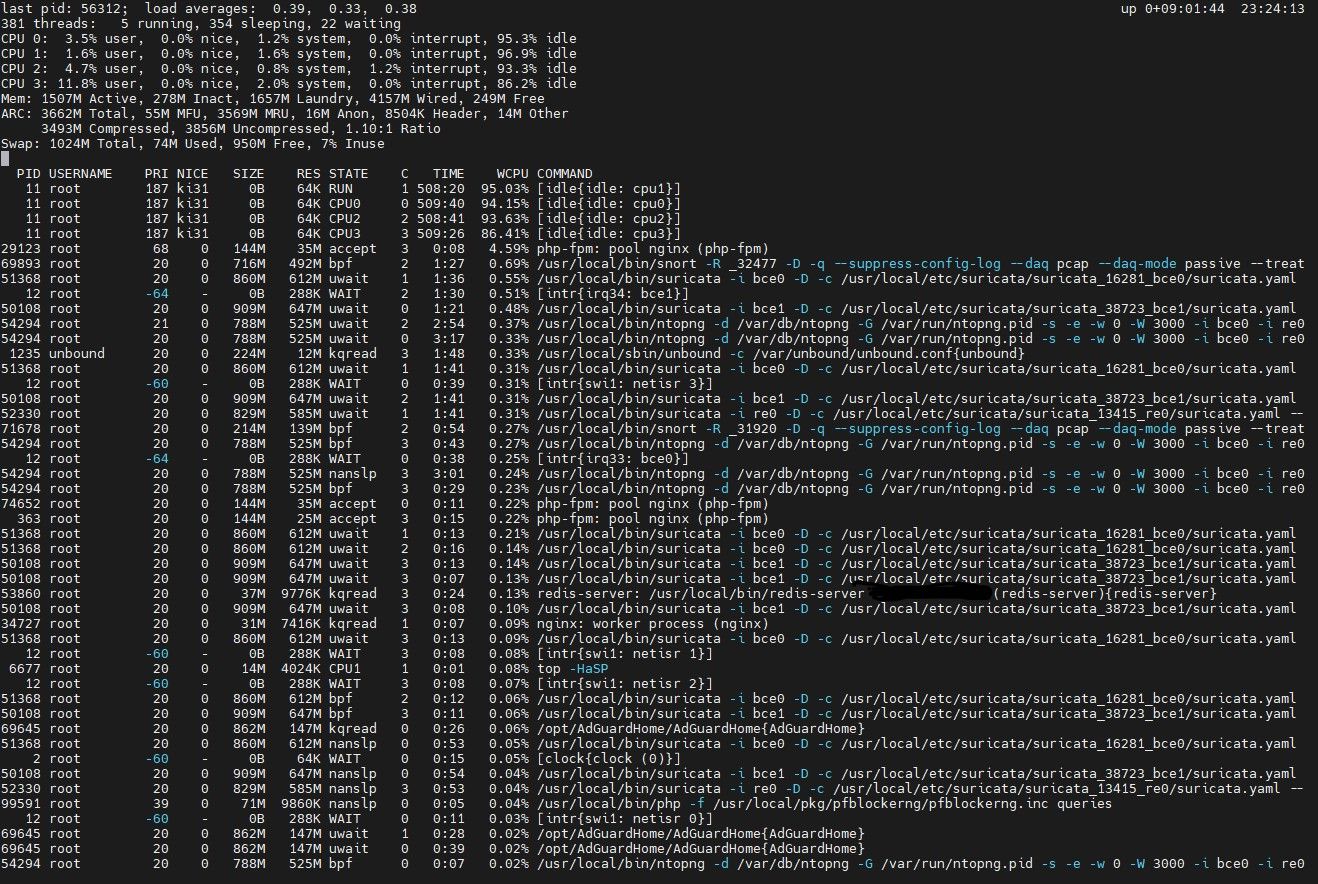
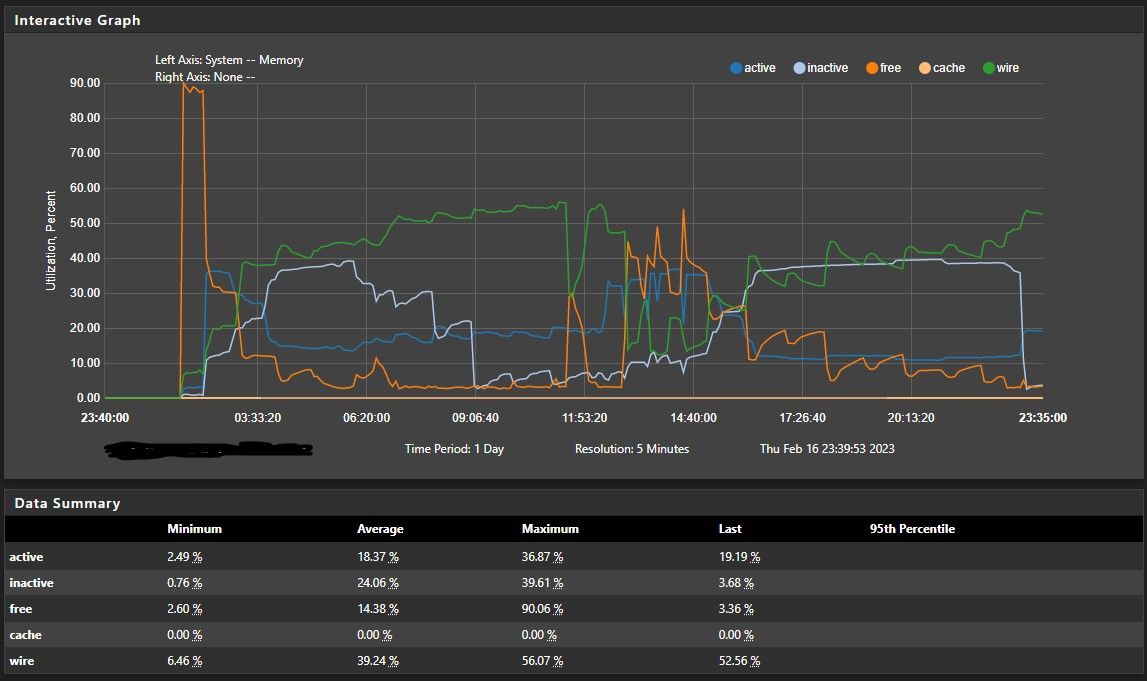
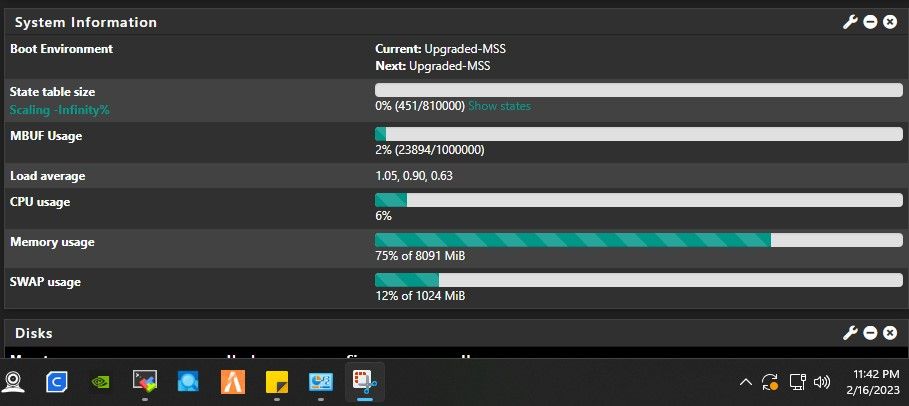
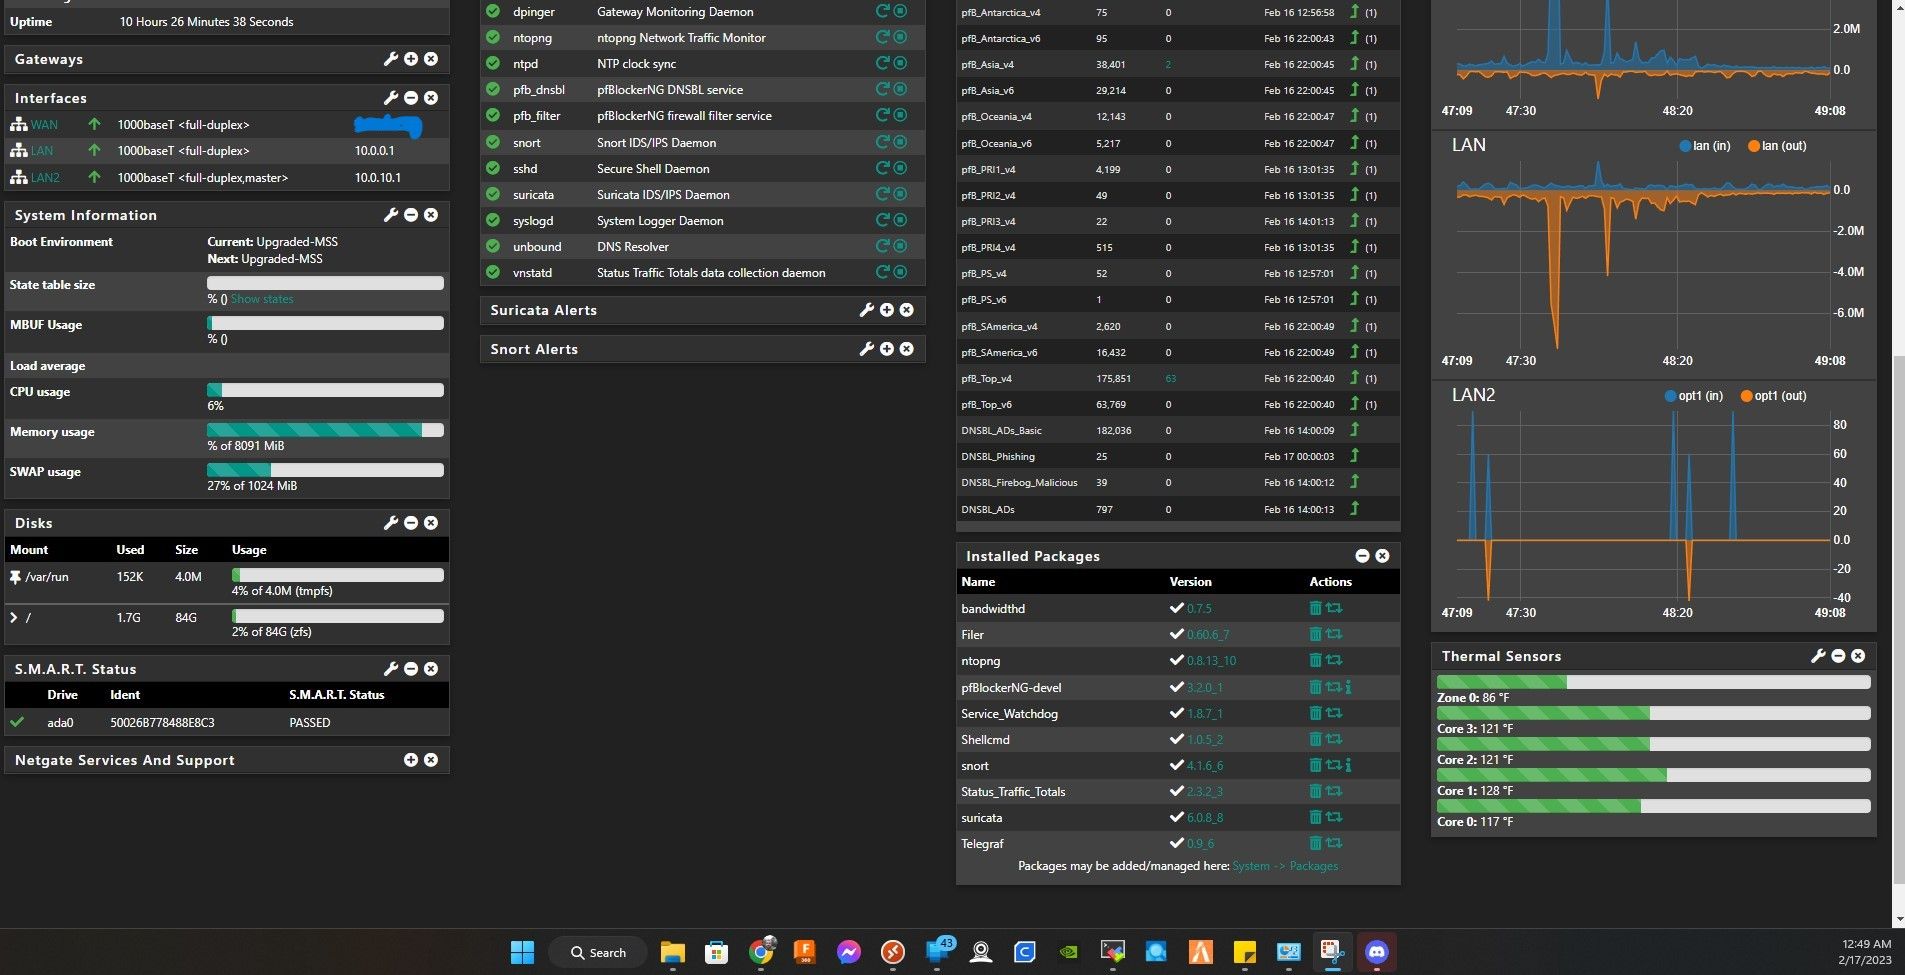
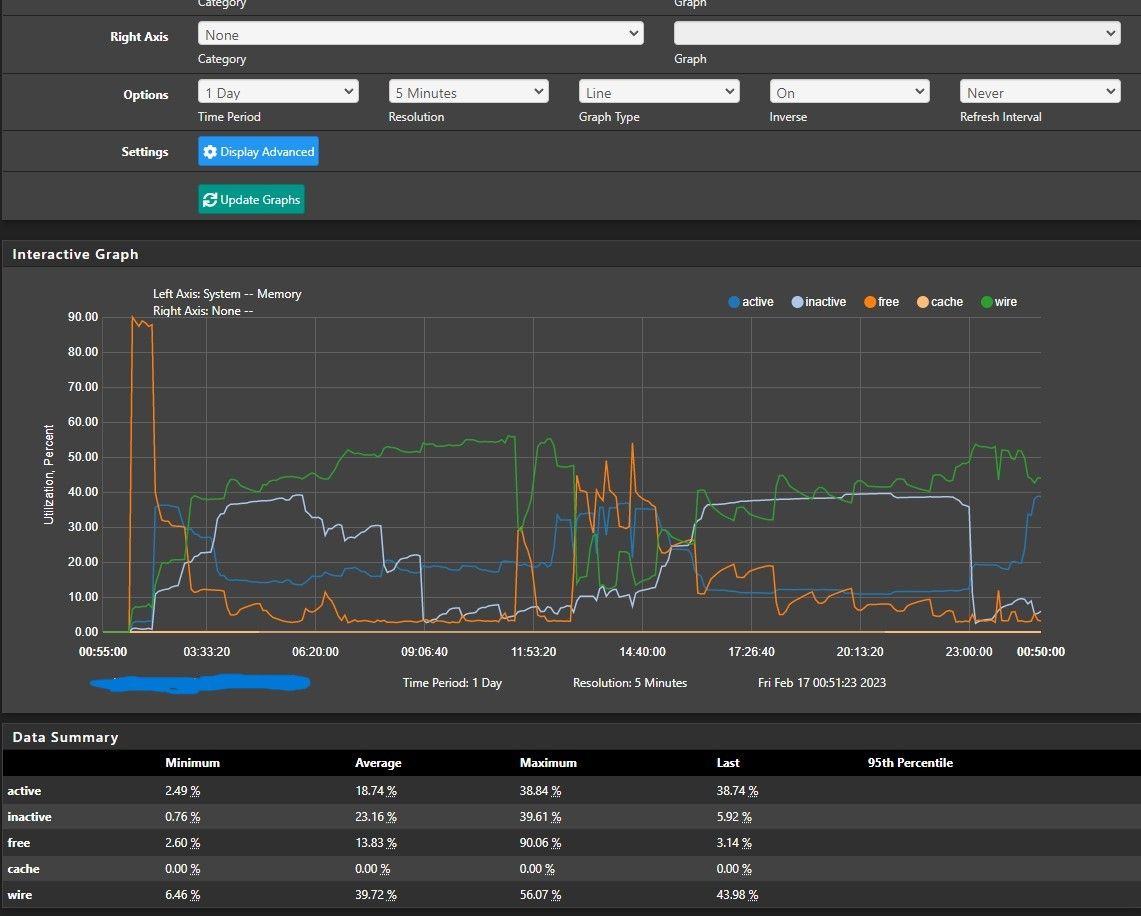
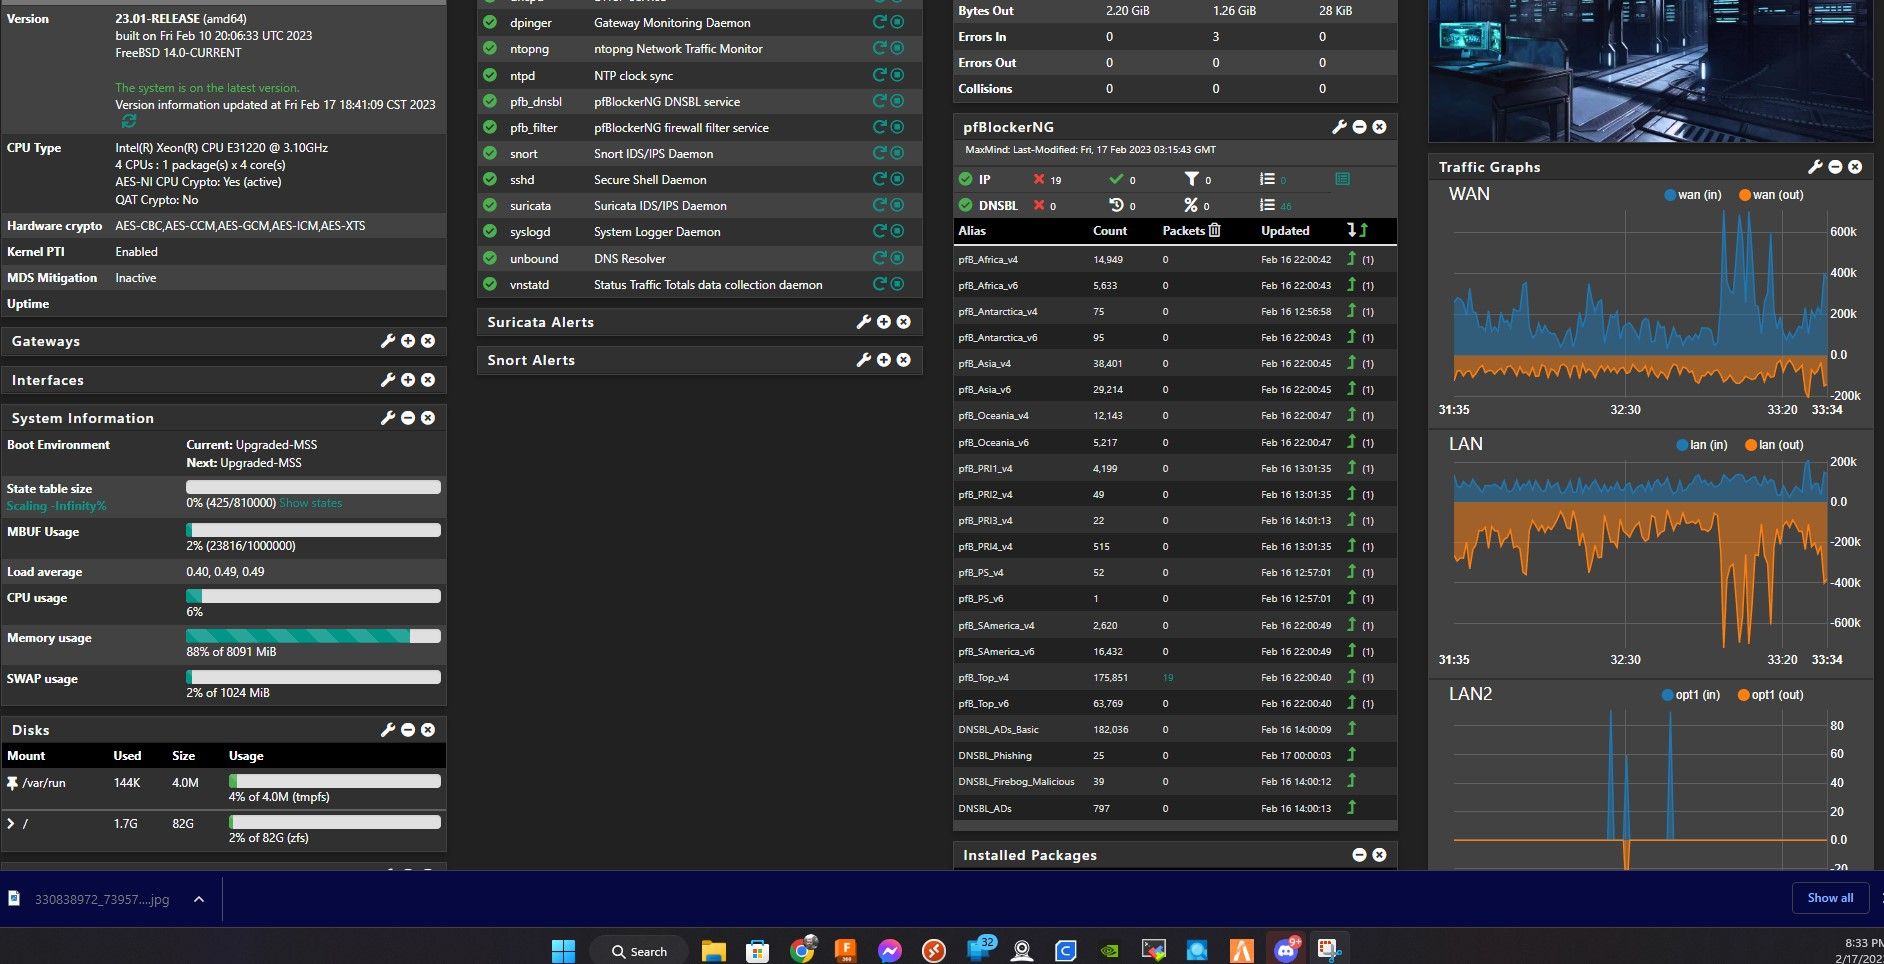
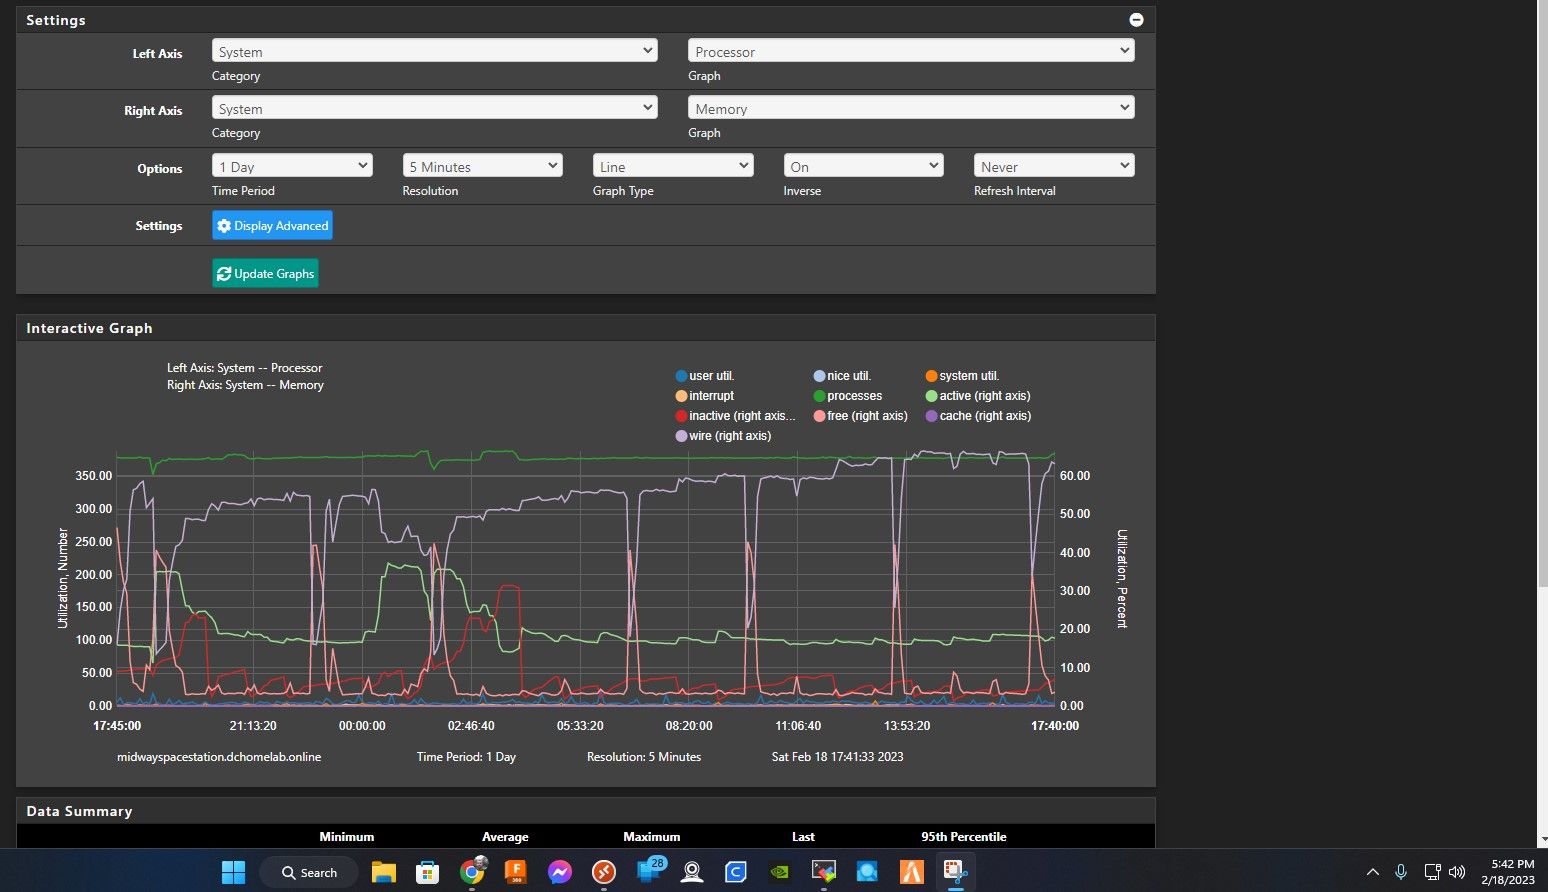
@stephenw10 I took some more screen shots, The memory went down to 75%, and SWAP usage went up to 12%, I took another screen shot of top -HaSP to show you. and a memory graph.
-
This post is deleted! -
This post is deleted! -
Hmm, what happened in that last hour that used all the inactive RAM?
What does the memory usage in top look like immediately after booting into 23.01.
It's not obvious which of those processes has increased it's memory usage. -
When watching
top, usetop -aS -o resto sort by theREScolumn and without some of the extra CPU info that isn't relevant to memory usage.In a couple of your
topoutputs the ZFS ARC usage is pretty high (Almost 4GB in one of them) which would correspond to some of the Wired usage. ZFS will give up ARC memory is needed if something else needs it, though, it just looks worse than it really is.Remember: Upvote with the 👍 button for any user/post you find to be helpful, informative, or deserving of recognition!
Need help fast? Netgate Global Support!
Do not Chat/PM for help!
-
 @stephenw10 I have no clue what happened ;-) it's as if after 8 - 9 hours of uptime the memory usage starts to increase over time which sounds like a memory leak to me.
I had to delete the comment I made prior to you posting this statement not realizing I forgot to hide my IP and your site wont allow me to edit MY post after some arbitrary time limit to repost the same screenshot with my IP blocked out:
So I'll repost it here to show overtime what I'm seeing with the memory usage!
I had restarted it after taking those screenshots and the memory usage went back to normal. And again I had little network activity when taking those screen shots. Then 12+ hours later I take another look and see this:
I restart again and see this:

-
@jimp kk, I had just restart it before reading this and posting my last screenshots. I'll let it run a bit and when I see memory usage start to increases I'll follow your recomendation.
-
@jimp This is about 2 hours later, So I guess I was wrong earlier when I stated it appears memory increasing after about 8 hours of uptime.
-
This post is deleted! -
@jimp Here's about 6 hours after the last two screenshots I posted.
-
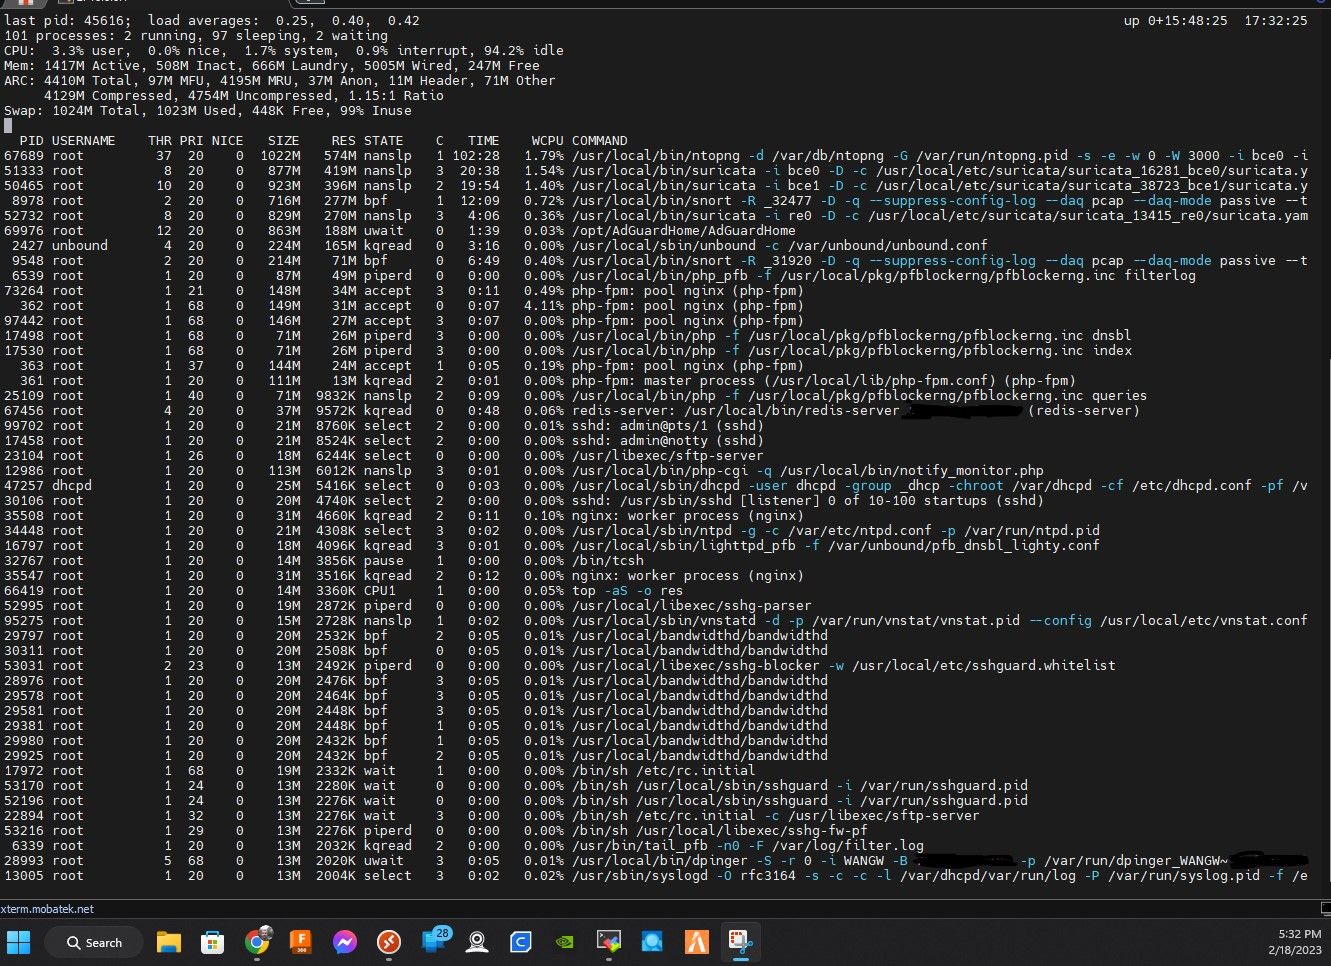
@jimp
here's after 15 hours of uptime.
-
At least from that top output it appears the ARC usage is still going up, probably any time there is a scheduled process that hits the disk a lot it will go up (e.g. updating rules for snort/suricata/whatever). But that ARC memory will be released as needed so it looks worse than it really is.