Bug report: custom period in monitoring graphs
-
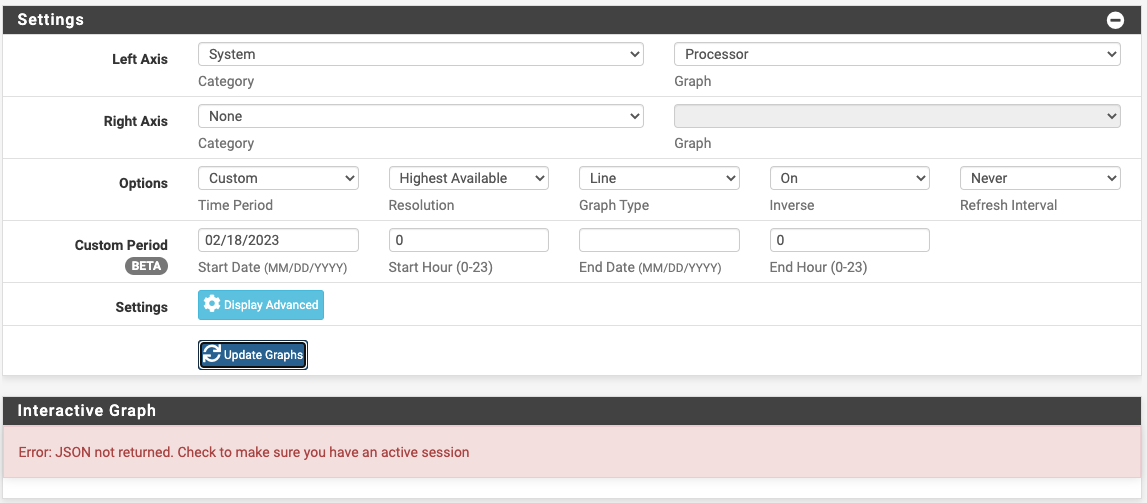
Using the "custom period" in Status/monitoring generates an error and a PHP stack error. This is version 23.01 on a Netgate 1100. The error:
9:02:36 PHP ERROR: Type: 1, File: /usr/local/www/rrd_fetch_json.php, Line: 149, Message: Uncaught TypeError: Unsupported operand types: string - null in /usr/local/www/rrd_fetch_json.php:149
Stack trace:
#0 {main}
thrownThe GUI screenshot after the error:

BTW, why is there no "bug reports" category in the pfsense topics list?
-
 J jimp moved this topic from webGUI on
-
What exactly did you input in all of those fields?
Is it exactly as shown in the screenshot?
There is no "bug reports" section because many times people report "bugs" that are actually misconfigurations or other misunderstandings, so it's best to keep threads in their own relevant sections and not try to group them in that way. Once something is determined to be a bug it would go in Redmine.
-
What you see in the screen shot is what I put in. Note that the end date is blank. If I put in an end date, then no error is thrown. So.... The actual bug is that no value is predefined for a blank entry for either the start or end date and/or there is no error test for a blank entry. For the end date, a predefined value of "now" would be nice for a blank value (which is what I was trying to do here). For a blank start date, it should complain and not crash. I realize this feature is beta, now I know why.
-
Did that ever work?
The PHP error is almost certainly new, but did that same sort of query work in older versions?
-
I had never used the custom feature before 23.01, so I don't know if it had worked previously or not. If not, then a blank end date defaulting to "now", or an option to select "now, would be a nice enhancement.
I spent last Fall updating an entire website from PHP 7.4 to 8.1, a month of tedium trying things, looking at the syslogs, fix, try again, etc. What a pain... I am still finding PHP warnings and deprecations in my logs that I have to chase.