Netgate Discussion Forum
    • Categories
    • Recent
    • Tags
    • Popular
    • Users
    • Search
    • Register
    • Login

    SSD read/write - how long will it last

    Scheduled Pinned Locked Moved General pfSense Questions
    22 Posts 9 Posters 2.7k Views
    Loading More Posts
    • Oldest to Newest
    • Newest to Oldest
    • Most Votes
    Reply
    • Reply as topic
    Log in to reply
    This topic has been deleted. Only users with topic management privileges can see it.
    • johnpozJ
      johnpoz LAYER 8 Global Moderator @SteveITS
      last edited by

      @steveits Nice link, I hadn't come across that page before.. While I get haproxy if actually with heavy use.. I use it for a hand full of users to access a couple resources now and then.. I think my emmc should be fine ;)

      An intelligent man is sometimes forced to be drunk to spend time with his fools
      If you get confused: Listen to the Music Play
      Please don't Chat/PM me for help, unless mod related
      SG-4860 24.11 | Lab VMs 2.8, 24.11

      M 1 Reply Last reply Reply Quote 0
      • M
        michmoor LAYER 8 Rebel Alliance @johnpoz
        last edited by

        @johnpoz @SteveITS Thanks both of you. So reviewing the config history of this box i think i found the culprits

        1. Someone had ntopng running for a few days.
        2. Suricata had logging on multiple traffic types - http/dns/tls. This was me so im guilty. :)

        Ok im not to concerned then about the usage on the disk. Thanks for the tip on the Enable HTTP Log @SteveITS . I'm thinking about disabling TLS logging as well. Maybe DNS. I already have unbound logging anyways.

        Firewall: NetGate,Palo Alto-VM,Juniper SRX
        Routing: Juniper, Arista, Cisco
        Switching: Juniper, Arista, Cisco
        Wireless: Unifi, Aruba IAP
        JNCIP,CCNP Enterprise

        1 Reply Last reply Reply Quote 0
        • P
          Patch @johnpoz
          last edited by Patch

          @johnpoz said in SSD read/write - how long will it last:

          written 6TB in 137 days

          Agree that is a lot given the terabyte(s) written (TBW) rating for a SSD in that size range is probably 60 and 150 TB but probably last longer in practice https://www.ontrack.com/en-au/blog/how-long-do-ssds-really-last and https://www.ionos.com/digitalguide/server/security/ssd-life-span/

          A 1 Reply Last reply Reply Quote 1
          • A
            AdriftAtlas @Patch
            last edited by

            I was running pfSense Plus 22.05 and now 23.01 under Proxmox. SMART for my SSD shows roughly 40-50GB written per day. Some of that is write amplification due to nested ZFS but pfSense is still writing an insane amount per day.

            There's not that much logging going on, it's a home internet connection. I don't use a IDS/IPS package. All I have installed is pfBlockerNG, acme, iperf, Status_Traffic_Totals, and System_patches. I am running a DNS resolver if that matters. I only see syslogd writing stuff every few seconds in top.

            My Proxmox box is using a Samsung 980 which is relatively durable but I'd rather not thrash it needlessly either. Something is extremely inefficient in how it writes in pfSense.

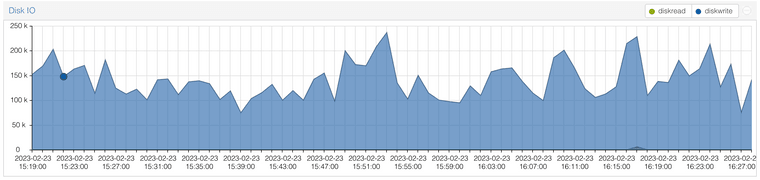
            Here is what the IO graph for pfSense looks like in Proxmox:
            Screenshot 2023-02-23 at 4.28.45 PM.png

            Here is zpool iostat output:

            zpool iostat -y 1
            
                          capacity     operations     bandwidth 
            pool        alloc   free   read  write   read  write
            ----------  -----  -----  -----  -----  -----  -----
            pfSense     3.53G  59.0G      0      0      0      0
            pfSense     3.53G  59.0G      0     87      0  1.16M
            pfSense     3.53G  59.0G      0      0      0      0
            pfSense     3.53G  59.0G      0      0      0      0
            pfSense     3.53G  59.0G      0      0      0      0
            pfSense     3.53G  59.0G      0      0      0      0
            pfSense     3.53G  59.0G      0      0      0      0
            pfSense     3.53G  59.0G      0      0      0      0
            pfSense     3.53G  59.0G      0      0      0      0
            pfSense     3.53G  59.0G      0      0      0      0
            pfSense     3.53G  59.0G      0      0      0      0
            pfSense     3.53G  59.0G      0      0      0      0
            pfSense     3.53G  59.0G      0      0      0      0
            pfSense     3.53G  59.0G      0      0      0      0
            pfSense     3.53G  59.0G      0      0      0      0
            pfSense     3.53G  59.0G      0      0      0      0
            pfSense     3.53G  59.0G      0     89      0  1.17M
            pfSense     3.53G  59.0G      0      0      0      0
            pfSense     3.53G  59.0G      0      0      0      0
            pfSense     3.53G  59.0G      0      0      0      0
            pfSense     3.53G  59.0G      0      0      0      0
            pfSense     3.53G  59.0G      0     97      0  2.21M
            pfSense     3.53G  59.0G      0      0      0      0
            pfSense     3.53G  59.0G      0      0      0      0
            pfSense     3.53G  59.0G      0      0      0      0
            pfSense     3.53G  59.0G      0      0      0      0
            pfSense     3.53G  59.0G      0      0      0      0
            pfSense     3.53G  59.0G      0      0      0      0
            pfSense     3.53G  59.0G      0      0      0      0
            pfSense     3.53G  59.0G      0      0      0      0
            pfSense     3.53G  59.0G      0      0      0      0
            pfSense     3.53G  59.0G      0     85      0  1.16M
            pfSense     3.53G  59.0G      0      0      0      0
            pfSense     3.53G  59.0G      0      0      0      0
            pfSense     3.53G  59.0G      0      0      0      0
            pfSense     3.53G  59.0G      0      0      0      0
            pfSense     3.53G  59.0G      0      0      0      0
            pfSense     3.53G  59.0G      0      0      0      0
            pfSense     3.53G  59.0G      0      0      0      0
            pfSense     3.53G  59.0G      0      0      0      0
            pfSense     3.53G  59.0G      0      0      0      0
            pfSense     3.53G  59.0G      0     91      0  1.20M
            pfSense     3.53G  59.0G      0      0      0      0
            pfSense     3.53G  59.0G      0      0      0      0
            pfSense     3.53G  59.0G      0      0      0      0
            pfSense     3.53G  59.0G      0      0      0      0
            pfSense     3.53G  59.0G      0      0      0      0
            pfSense     3.53G  59.0G      0      0      0      0
            pfSense     3.53G  59.0G      0      0      0      0
            pfSense     3.53G  59.0G      0      0      0      0
            pfSense     3.53G  59.0G      0      0      0      0
            pfSense     3.53G  59.0G      0     87      0  1.17M
            pfSense     3.53G  59.0G      0      0      0      0
            pfSense     3.53G  59.0G      0      0      0      0
            pfSense     3.53G  59.0G      0      0      0      0
            pfSense     3.53G  59.0G      0      0      0      0
            pfSense     3.53G  59.0G      0     86      0  1.12M
            pfSense     3.53G  59.0G      0      0      0      0
            pfSense     3.53G  59.0G      0      0      0      0
            pfSense     3.53G  59.0G      0      0      0      0
            
            S 1 Reply Last reply Reply Quote 0
            • S
              SteveITS Galactic Empire @AdriftAtlas
              last edited by

              @adriftatlas As noted above, if it’s logging then a RAM disk will help.
              pfBlockerNG can be set to log DNSBL. PfSense logs the default block rule by default.
              Could it be using swap? (Low on memory)

              Pre-2.7.2/23.09: Only install packages for your version, or risk breaking it. Select your branch in System/Update/Update Settings.
              When upgrading, allow 10-15 minutes to restart, or more depending on packages and device speed.
              Upvote 👍 helpful posts!

              1 Reply Last reply Reply Quote 0
              • A
                AdriftAtlas
                last edited by

                It has 4GB of RAM and it's only using 33%.

                I stopped the syslogd service temporarily and something was still writing to disk excessively so it's not the culprit.

                This command shows zfskern writing a lot but what and why is it writing?

                top -m io -o write -IS -d 1
                
                last pid: 97225;  load averages:  0.17,  0.17,  0.14                                                                                      up 2+20:53:44  20:25:57
                80 processes:  2 running, 76 sleeping, 2 waiting
                CPU:  0.3% user,  0.1% nice,  1.2% system,  0.2% interrupt, 98.2% idle
                Mem: 89M Active, 191M Inact, 1383M Wired, 2166M Free
                ARC: 842M Total, 678M MFU, 91M MRU, 2298K Anon, 9317K Header, 59M Other
                     699M Compressed, 1473M Uncompressed, 2.11:1 Ratio
                Swap: 1024M Total, 1024M Free
                
                  PID USERNAME     VCSW  IVCSW   READ  WRITE  FAULT  TOTAL PERCENT COMMAND
                    6 root      2207881  26057    313 1142462      0 1142775  82.97% zfskern
                54361 root       35902   7684    313 151637     80 152030  11.04% php-fpm
                  359 root       34589   8604    111  76066     28  76205   5.53% php-fpm
                14040 dhcpd     969664  20228     12   2585     20   2617   0.19% dhcpd
                84008 root        3607    224      0   2060      0   2060   0.15% syslogd
                  358 root       36037   7802     54    400     35    489   0.04% php-fpm
                82882 root        2927    152      0    353      0    353   0.03% php_pfb
                18850 _dhcp       5303    182      0    287      0    287   0.02% dhclient
                80651 root         235     53      0    216      0    216   0.02% vnstatd
                 3607 root      258782   7119      0     25      0     25   0.00% ntpd
                98600 unbound   857611 289739      1      7      8     16   0.00% unbound
                 4737 root       14994   5587     71      4      2     77   0.01% nginx
                38639 root           9      4      7      2      5     14   0.00% login
                 5065 root        4456   2591      4      2      1      7   0.00% nginx
                80827 root          18      3      0      2      0      2   0.00% sh
                 4892 root        5399   2003      0      2      0      2   0.00% nginx
                63231 root          18      3      0      2      0      2   0.00% sh
                22895 root      282285  17201      0      0      2      2   0.00% filterlog
                    1 root         272      7     85      0     15    100   0.01% init
                  357 root      243687   8432      1      0      0      1   0.00% php-fpm
                67497 root        3140    244      5      0      8     13   0.00% tcsh
                  397 root         626    182      1      0      4      5   0.00% check_reload_status
                    0 root      92073647  98734     42      0      0     42   0.00% kernel
                41040 root          10     26      5      0      4      9   0.00% sh
                62768 root        9323    597      2      0      9     11   0.00% sshd
                83376 root           6      1      4      0      5      9   0.00% iperf3
                38864 root           4      2      1      0      0      1   0.00% getty
                 2194 root       13892   1543      1      0      0      1   0.00% cron
                42041 root          14      1      1      0      0      1   0.00% sh
                66300 root        9007    859      0      0      2      2   0.00% qemu-ga
                12509 root          10      1      1      0      0      1   0.00% sshd
                
                1 Reply Last reply Reply Quote 0
                • keyserK
                  keyser Rebel Alliance @michmoor
                  last edited by

                  @michmoor If you look closelt in that report, it says %used = 3%
                  So there is lots and lots of life left in your SSD :-)

                  Love the no fuss of using the official appliances :-)

                  M 1 Reply Last reply Reply Quote 0
                  • M
                    michmoor LAYER 8 Rebel Alliance @keyser
                    last edited by

                    @keyser you sure percentage used isn’t taking about disk space?

                    Firewall: NetGate,Palo Alto-VM,Juniper SRX
                    Routing: Juniper, Arista, Cisco
                    Switching: Juniper, Arista, Cisco
                    Wireless: Unifi, Aruba IAP
                    JNCIP,CCNP Enterprise

                    keyserK 1 Reply Last reply Reply Quote 0
                    • keyserK
                      keyser Rebel Alliance @michmoor
                      last edited by

                      @michmoor said in SSD read/write - how long will it last:

                      @keyser you sure percentage used isn’t taking about disk space?

                      Well, pretty much 100%. The SSD itself cannot know how much diskspace the OS considers allocated and used - especially not if the OS does not support TRIM. Also, the S.M.A.R.T. Health tools always reports on the actual physical state of the SSD, not the filesystem state on the SSD.

                      Love the no fuss of using the official appliances :-)

                      1 Reply Last reply Reply Quote 1
                      • S
                        SteveITS Galactic Empire
                        last edited by

                        @adriftatlas said in SSD read/write - how long will it last:

                          PID USERNAME     VCSW  IVCSW   READ  WRITE  FAULT  TOTAL PERCENT COMMAND
                            6 root      2207881  26057    313 1142462      0 1142775  82.97% zfskern
                        

                        WRITE is a counter, I believe? So it should increment forever. I pulled up a router on 2.6 with ZFS and see 5315859 (incrementing slowly) but that's 284 days of uptime. zfskern should include the ZFS scrub.

                        What does iostat -x show? On that same router, which is also using a RAM disk, I see:

                        : iostat -x
                                                extended device statistics
                        device       r/s     w/s     kr/s     kw/s  ms/r  ms/w  ms/o  ms/t qlen  %b
                        ada0           0       0      0.0      1.2     6     0    24     3    0   0
                        cd0            0       0      0.0      0.0     0     0     1     1    0   0
                        pass0          0       0      0.0      0.0     4     1    79    22    0   0
                        pass1          0       0      0.0      0.0     0     0     0     0    0   0
                        

                        Pre-2.7.2/23.09: Only install packages for your version, or risk breaking it. Select your branch in System/Update/Update Settings.
                        When upgrading, allow 10-15 minutes to restart, or more depending on packages and device speed.
                        Upvote 👍 helpful posts!

                        A 1 Reply Last reply Reply Quote 0
                        • Dobby_D
                          Dobby_
                          last edited by

                          I would go with a small RaspBerry PI 3/4 with 2/4 GB and a
                          big mSATA or M.2 SSD with TRIM support as a logging server.

                          #~. @Dobby

                          Turris Omnia - 4 Ports - 2 GB RAM / TurrisOS 7 Release (Btrfs)
                          PC Engines APU4D4 - 4 Ports - 4 GB RAM / pfSense CE 2.7.2 Release (ZFS)
                          PC Engines APU6B4 - 4 Ports - 4 GB RAM / pfSense+ (Plus) 24.03_1 Release (ZFS)

                          1 Reply Last reply Reply Quote 0
                          • A
                            AdriftAtlas @SteveITS
                            last edited by

                                                    extended device statistics  
                            device       r/s     w/s     kr/s     kw/s  ms/r  ms/w  ms/o  ms/t qlen  %b  
                            da0            0      11      2.1    149.9     0     0     5     1    0   0 
                            pass0          0       0      0.0      0.0     0     0     0     0    0   0 
                            

                            I'd like to understand what is writing though. I'd rather not resort to using a RAM disk as it can cause other issues. There is no reason anything should be writing that much on a mostly idle router.

                            keyserK S 2 Replies Last reply Reply Quote 0
                            • keyserK
                              keyser Rebel Alliance @AdriftAtlas
                              last edited by

                              @adriftatlas The usual HUGE suspects are pfSense add-on packages (in order of typical write activity:)

                              1: Suricata
                              2: Snort
                              3: pfBlockerNG (especially with reply logging turned on)
                              4: NtopNG

                              All of them has measures to manually configure how much (or little) logging they actually do.

                              Love the no fuss of using the official appliances :-)

                              1 Reply Last reply Reply Quote 1
                              • S
                                SteveITS Galactic Empire @AdriftAtlas
                                last edited by

                                @adriftatlas Hmm yeah that’s 149x more. Not that I have a comparison handy.

                                Re:suspects, also any package mentioning SSD here:
                                https://www.netgate.com/supported-pfsense-plus-packages

                                Pre-2.7.2/23.09: Only install packages for your version, or risk breaking it. Select your branch in System/Update/Update Settings.
                                When upgrading, allow 10-15 minutes to restart, or more depending on packages and device speed.
                                Upvote 👍 helpful posts!

                                A 1 Reply Last reply Reply Quote 0
                                • A
                                  AdriftAtlas @SteveITS
                                  last edited by

                                  The only thing I have installed that could be chatty is pfBlockerNG. Even then I only use the Geo IP blocking aliases.

                                  M 1 Reply Last reply Reply Quote 0
                                  • M
                                    mcury Rebel Alliance @AdriftAtlas
                                    last edited by mcury

                                    I get 49 kw/s, and I'm using pfblockerNG (not logging DNS replies) and remote syslog (with logging to the firewall disabled).
                                    Based on the other thread, the count would be: 49 x 60 x 60 x 24 x 365 = 1545264000
                                    Which is 1.5 TB per year.
                                    My SSD, ADATA M.2 SATA SU650 120GB can write 70TBW, so based on that, I would be able to use it for around 45 years.

                                    dead on arrival, nowhere to be found.

                                    1 Reply Last reply Reply Quote 0
                                    • First post
                                      Last post
                                    Copyright 2025 Rubicon Communications LLC (Netgate). All rights reserved.