Firewall locks up, possibly unbound config
-
@gessel re: /etc/rc.shutdown (typo as "rec" in original post?) ...do you have a UPS that is triggering shutdown? It sounds like it's trying to shut down.
https://twitter.com/klarainc/status/1532346430341496833What is in /var/unbound/pfb_dnsbl.*conf since that's not on my router using DNSBL?
-
@steveits The trigger for shutdown is sending ctl-alt-del via a remote KVM. I don't have hands on. CTL-ALT-DEL should trigger a reboot and it starts to, but hangs as shown (yes rc.conf, not rec.conf, transcribing from the KVM bit-mapped screen). I tried adding
w.usb.no_shutdown_wait=1to /boot/loader.conf as it appears the USB keyboard is being unloaded - at least console is unresponsive after pressing ctl-alt-del.
There is a UPS, but it is fine, no events at all and not configured with powerchute push or a listener configuration. Something is killing the firewall. When I can get it power-cycled, I can poke around some more. It seems to run fine for a few hours or a day before crashing.
pfb_dnsbl.*conf includes the pfBlockerNG domain name block lists, it is created automatically by pfBlockerNG - or was - it might be a relic of a much, much earlier version of pfSense.
-
@steveits, thanks for the help. My FW is rebooted and working for the moment (run time seems to be hours but not days). I removed the custom MX entries I inserted (maybe local mail delivery will have to wait), we'll see if it crashes again. In the mean time I:
-
Scanned the log files for memory errors (# grep -ri "memory" /var/log/*) - nothing.
-
Checked the status of the ZFS array (# zpool scrub pfSense, # zpool status -v ) no errors
-
ran a long SMART test on the SSD (PASSED)
-
Built memtester on a nearby system and loaded it, running 4G at a time (live system). This isn't authoritative as I can only scan about half the RAM, but if the stick is flaky it's likely flaky all over. It isn't ECC as Protectli doesn't do that :-( If it were bad, chances are something would have flipped and all tests were OK.
-
added a small script to write the output of ps aux -r to a "log file" (below) and then set that to run every 5 minutes with cron. Perhaps if it/when it hangs again, I'll have a mouse in that trap.
#!/bin/sh

#=====================================================================
# pslog.sh, v1
# Created 2023 by David Gessel
# Released to public domain
#
#=====================================================================

#=====================================================================
# USER SETTINGS
#
# Log file
LOGFILE=/root/pslog/pslog-$(date +%Y%m%d.%H%M%S).log
#=====================================================================

echo "$(date +%Y%m%d.%H%M%S)" >> $LOGFILE
echo "$(ps aux -r)" >> $LOGFILE
find /root/pslog/ -type f -name "pslog-*" -mtime +1 -delete
Firewall died again at after about 6 hours uptime. I'll have better insight when I can reboot it and get access to the ps aux records.
-
-
@gessel @gessel I added a set of commands to integrate fail2ban data with pfBlockerNG, it worked for years but as pfBlockerNG has updated, perhaps that update broke it. I disabled the update for that particular list on the pfBlockerNG side and we'll see. I was a little optimistic but the update frequency is 1 hour and the uptime is closer to 6.
My little scheme of capturing ps aux data to a rotating log file seems to have worked, but I don't see anything unexpected in the last entry before the system froze - note they're only captured every 5 minutes, so a process might have kicked off and killed it.
maybe someone more familiar will see an obvious anomaly I'm missing.20230303.213000 USER PID %CPU %MEM VSZ RSS TT STAT STARTED TIME COMMAND root 11 396.7 0.0 0 64 - RNL 15:31 1281:43.72 [idle] root 14094 1.5 0.6 134684 48692 - S 20:59 0:27.81 php-fpm: pool nginx (php-fpm) root 57066 0.9 0.6 134664 48556 - S 21:01 0:26.54 php-fpm: pool nginx (php-fpm) root 470 0.2 0.6 134724 48448 - S 21:09 0:18.90 php-fpm: pool nginx (php-fpm) root 0 0.0 0.0 0 720 - DLs 15:31 4:09.78 [kernel] root 1 0.0 0.0 9508 952 - ILs 15:31 0:00.07 /sbin/init -- root 2 0.0 0.0 0 16 - DL 15:31 0:00.00 [crypto] root 3 0.0 0.0 0 16 - DL 15:31 0:00.00 [crypto returns 0] root 4 0.0 0.0 0 16 - DL 15:31 0:00.00 [crypto returns 1] root 5 0.0 0.0 0 16 - DL 15:31 0:00.00 [crypto returns 2] root 6 0.0 0.0 0 16 - DL 15:31 0:00.00 [crypto returns 3] root 7 0.0 0.0 0 32 - DL 15:31 0:00.70 [cam] root 8 0.0 0.0 0 16 - DL 15:31 0:00.01 [soaiod1] root 9 0.0 0.0 0 16 - DL 15:31 0:00.01 [soaiod2] root 10 0.0 0.0 0 16 - DL 15:31 0:00.00 [audit] root 12 0.0 0.0 0 288 - WL 15:31 0:18.25 [intr] root 13 0.0 0.0 0 64 - DL 15:31 0:00.00 [ng_queue] root 14 0.0 0.0 0 48 - DL 15:31 0:00.01 [geom] root 15 0.0 0.0 0 16 - DL 15:31 0:00.00 [sequencer 00] root 16 0.0 0.0 0 96 - DL 15:31 0:02.82 [usb] root 17 0.0 0.0 0 16 - DL 15:31 0:00.01 [soaiod3] root 18 0.0 0.0 0 16 - DL 15:31 0:00.01 [soaiod4] root 19 0.0 0.0 0 608 - DL 15:31 0:08.36 [zfskern] root 20 0.0 0.0 0 16 - DL 15:31 0:00.00 [sctp_iterator] root 21 0.0 0.0 0 16 - DL 15:31 0:11.08 [pf purge] root 22 0.0 0.0 0 16 - DL 15:31 0:18.73 [rand_harvestq] root 23 0.0 0.0 0 48 - DL 15:31 0:04.00 [pagedaemon] root 24 0.0 0.0 0 16 - DL 15:31 0:00.00 [vmdaemon] root 25 0.0 0.0 0 80 - DL 15:31 0:02.07 [bufdaemon] root 26 0.0 0.0 0 16 - DL 15:31 0:00.46 [syncer] root 27 0.0 0.0 0 16 - DL 15:31 0:00.18 [vnlru] root 28 0.0 0.0 0 16 - DL 15:31 0:00.00 [ALQ Daemon] root 29 0.0 0.1 0 5120 - DL 15:31 1:54.39 [zpool-pfSense] root 367 0.0 0.3 102944 27696 - Ss 15:31 0:00.99 php-fpm: master process (/usr/local/lib/php-fpm.conf) (php-fpm) root 398 0.0 0.0 11376 2876 - INs 15:31 0:00.01 /usr/local/sbin/check_reload_status root 400 0.0 0.0 11352 2644 - IN 15:31 0:00.00 check_reload_status: Monitoring daemon of check_reload_status (check_reload_status) unbound 413 0.0 0.6 78632 51972 - Ss 15:47 1:14.04 /usr/local/sbin/unbound -c /var/unbound/unbound.conf root 664 0.0 0.0 9988 1368 - Ss 15:31 0:02.79 /sbin/devd -q -f /etc/pfSense-devd.conf root 6141 0.0 5.7 511976 467612 - Ss 15:32 2:36.91 /usr/local/bin/snort -R _18213 -D -q --suppress-config-log --daq pcap --daq-mode passive --treat-drop-as-alert -l /var/log/snort/snort_igb018213 --pid-path /var/run --nolock-pidfile --no-interface-pidfile -G 18213 -c /usr/local/etc/snort/snort_18213_igb0/snort.conf -i igb0 root 6195 0.0 0.0 10784 2252 - S 15:32 0:03.05 /usr/bin/tail_pfb -n0 -F /var/log/filter.log root 6347 0.0 0.5 61592 38260 - S 15:32 0:01.45 /usr/local/bin/php_pfb -f /usr/local/pkg/pfblockerng/pfblockerng.inc filterlog root 11176 0.0 0.0 11252 2532 - S 21:30 0:00.00 cron: running job (cron) root 11441 0.0 0.0 11252 2532 - S 21:30 0:00.00 cron: running job (cron) root 11742 0.0 0.0 11428 2808 - Rs 21:30 0:00.01 /bin/sh /root/custom/pslog.sh root 12113 0.0 0.3 40024 23260 - Rs 21:30 0:00.04 /usr/local/bin/php-cgi -f /usr/local/pkg/servicewatchdog_cron.php root 12422 0.0 0.0 11252 2532 - S 21:30 0:00.00 cron: running job (cron) dhcpd 12679 0.0 0.1 23816 11964 - Ss 15:47 0:03.41 /usr/local/sbin/dhcpd -user dhcpd -group _dhcp -chroot /var/dhcpd -cf /etc/dhcpd.conf -pf /var/run/dhcpd.pid igb1 root 12850 0.0 0.0 11252 2532 - S 21:30 0:00.00 cron: running job (cron) root 13286 0.0 0.3 37428 21628 - RNs 21:30 0:00.03 /usr/local/bin/php -f /usr/local/pkg/snort/snort_check_cron_misc.inc root 13694 0.0 0.0 11400 2788 - Ss 21:30 0:00.01 sh /root/custom/brtblock.sh root 14368 0.0 0.1 22272 9092 - R 21:30 0:00.02 /usr/local/bin/curl -m 15 -s https://brt.llc/dnsbl/brtdnsbl.txt root 14804 0.0 0.0 11616 2872 - R 21:30 0:00.00 ps aux -r root 18195 0.0 0.0 13964 2700 - Is 15:31 0:05.99 /usr/local/bin/dpinger -S -r 0 -i ATT_Fiber -B 23.114.97.242 -p /var/run/dpinger_ATT_Fiber~23.114.97.242~76.214.236.1.pid -u /var/run/dpinger_ATT_Fiber~23.114.97.242~76.214.236.1.sock -C /etc/rc.gateway_alarm -d 1 -s 500 -l 2000 -t 60000 -A 1000 -D 500 -L 20 76.214.236.1 root 26922 0.0 0.0 10700 2112 - Is 15:32 0:00.00 /usr/local/bin/minicron 240 /var/run/ping_hosts.pid /usr/local/bin/ping_hosts.sh root 27292 0.0 0.0 10724 2124 - I 15:32 0:00.01 minicron: helper /usr/local/bin/ping_hosts.sh (minicron) root 27609 0.0 0.0 10700 2116 - Is 15:32 0:00.00 /usr/local/bin/minicron 300 /var/run/ipsec_keepalive.pid /usr/local/bin/ipsec_keepalive.php root 28057 0.0 0.0 10720 2124 - I 15:32 0:00.01 minicron: helper /usr/local/bin/ipsec_keepalive.php (minicron) root 28293 0.0 0.0 10700 2116 - Is 15:32 0:00.00 /usr/local/bin/minicron 3600 /var/run/expire_accounts.pid /usr/local/sbin/fcgicli -f /etc/rc.expireaccounts root 28562 0.0 0.0 10724 2128 - I 15:32 0:00.00 minicron: helper /usr/local/sbin/fcgicli -f /etc/rc.expireaccounts (minicron) root 28579 0.0 0.0 10700 2116 - Is 15:32 0:00.00 /usr/local/bin/minicron 86400 /var/run/update_alias_url_data.pid /usr/local/sbin/fcgicli -f /etc/rc.update_alias_url_data root 28968 0.0 0.0 10724 2128 - I 15:32 0:00.00 minicron: helper /usr/local/sbin/fcgicli -f /etc/rc.update_alias_url_data (minicron) root 30574 0.0 0.5 47364 37828 - Ss 15:32 0:01.18 /usr/local/sbin/arpwatch -N -z -Z -f /usr/local/arpwatch/arp_igb1.dat -i igb1 -w gessel@blackrosetech.com root 33353 0.0 0.1 19988 7444 - Ss 15:31 2:35.48 /usr/local/sbin/openvpn --config /var/etc/openvpn/server1/config.ovpn root 43338 0.0 0.6 134776 48684 - S 21:00 0:28.67 php-fpm: pool nginx (php-fpm) root 52510 0.0 0.1 17756 7300 - Ss 15:31 0:00.47 /usr/local/sbin/openvpn --config /var/etc/openvpn/server2/config.ovpn root 56647 0.0 0.0 11352 2696 - Ss 16:44 0:08.79 /usr/sbin/syslogd -O rfc3164 -s -c -c -l /var/dhcpd/var/run/log -P /var/run/syslog.pid -f /etc/syslog.conf root 62544 0.0 0.0 12288 3020 - Ss 15:31 0:04.70 /usr/local/sbin/filterlog -i pflog0 -p /var/run/filterlog.pid root 62868 0.0 0.1 19612 8348 - Is 15:31 0:00.01 /usr/sbin/sshd root 64327 0.0 0.0 11252 2520 - Ss 15:31 0:00.72 /usr/sbin/cron -s root 65475 0.0 0.1 19352 7112 - Ss 15:31 0:01.99 /usr/local/sbin/ntpd -g -c /var/etc/ntpd.conf -p /var/run/ntpd.pid root 65964 0.0 0.1 28416 7868 - Is 15:31 0:00.01 nginx: master process /usr/local/sbin/nginx -c /var/etc/nginx-webConfigurator.conf (nginx) root 65993 0.0 0.1 28980 8348 - I 15:31 0:00.00 nginx: worker process (nginx) root 66025 0.0 0.1 28980 8348 - I 15:31 0:00.00 nginx: worker process (nginx) root 66334 0.0 0.1 28980 8348 - I 15:31 0:00.00 nginx: worker process (nginx) root 66662 0.0 0.1 28980 8348 - I 15:31 0:00.00 nginx: worker process (nginx) root 66783 0.0 0.1 29640 8792 - I 15:31 0:00.89 nginx: worker process (nginx) root 67075 0.0 0.1 29156 8728 - I 15:31 0:09.04 nginx: worker process (nginx) root 67365 0.0 0.1 29480 8968 - S 15:31 0:08.28 nginx: worker process (nginx) root 67447 0.0 0.1 29160 8712 - I 15:31 0:04.20 nginx: worker process (nginx) root 78385 0.0 0.0 10756 2200 - Ss 15:32 0:07.17 /usr/sbin/powerd -b hadp -a hadp -n hadp root 78707 0.0 0.0 10588 2064 - SNC 21:29 0:00.00 sleep 60 root 80004 0.0 0.0 10812 2248 - Is 15:47 0:00.04 /usr/local/sbin/dhcpleases -l /var/dhcpd/var/db/dhcpd.leases -d blackrosetech.com -p /var/run/unbound.pid -u /var/unbound/dhcpleases_entries.conf -h /etc/hosts root 99132 0.0 0.1 19944 9348 - Is 15:49 0:36.06 sshd: admin@pts/0 (sshd) root 99866 0.0 0.1 18416 7768 - S 15:32 0:00.94 /usr/local/sbin/lighttpd_pfb -f /var/unbound/pfb_dnsbl_lighty.conf root 99938 0.0 0.5 61500 38208 - I 15:32 0:00.39 /usr/local/bin/php -f /usr/local/pkg/pfblockerng/pfblockerng.inc dnsbl root 99998 0.0 0.5 61848 39548 - I 15:32 0:00.41 /usr/local/bin/php -f /usr/local/pkg/pfblockerng/pfblockerng.inc index root 10681 0.0 0.0 10796 2236 v0 Is+ 15:32 0:00.00 /usr/libexec/getty Pc ttyv0 root 76429 0.0 0.0 11592 2684 v0- SN 15:32 0:07.29 /bin/sh /var/db/rrd/updaterrd.sh root 11019 0.0 0.0 10796 2236 v1 Is+ 15:32 0:00.00 /usr/libexec/getty Pc ttyv1 root 11310 0.0 0.0 10796 2236 v2 Is+ 15:32 0:00.00 /usr/libexec/getty Pc ttyv2 root 11365 0.0 0.0 10796 2236 v3 Is+ 15:32 0:00.00 /usr/libexec/getty Pc ttyv3 root 11697 0.0 0.0 10796 2236 v4 Is+ 15:32 0:00.00 /usr/libexec/getty Pc ttyv4 root 11757 0.0 0.0 10796 2236 v5 Is+ 15:32 0:00.00 /usr/libexec/getty Pc ttyv5 root 12073 0.0 0.0 10796 2236 v6 Is+ 15:32 0:00.00 /usr/libexec/getty Pc ttyv6 root 12377 0.0 0.0 10796 2236 v7 Is+ 15:32 0:00.00 /usr/libexec/getty Pc ttyv7 root 3428 0.0 0.0 13508 3828 0 I+ 15:49 0:00.54 /bin/tcsh root 99437 0.0 0.0 11432 2660 0 Is 15:49 0:00.01 /bin/sh /etc/rc.initialI'm very suspicious of pfBlockerNG. The state the system fails to looks like some problems people were having with earlier versions of pfBlockerNG and the latest update syncs pfBlockerNG with pfBlockerNG-devel (3.2.0_3). grepping for any errors in the logs, I get these non-time-stamped, but suspect hits:
pfblockerng/error.log:DNSBL enabled FAIL - restoring Unbound conf *** Fix error(s) and a Force Reload required! ***
pfblockerng/error.log:/var/unbound/unbound.conf:111: error: syntax error
pfblockerng/error.log:read /var/unbound/unbound.conf failed: 1 errors in configuration file
pfblockerng/error.log:[1677709717] unbound[89128:0] fatal error: Could not read config file: /var/unbound/unbound.conf. Maybe try unbound -dd, it stays on the commandline to see more errors, or unbound-checkconf
pfblockerng/pfblockerng.log:DNSBL enabled FAIL - restoring Unbound conf *** Fix error(s) and a Force Reload required! ***
pfblockerng/pfblockerng.log:/var/unbound/unbound.conf:111: error: syntax error
pfblockerng/pfblockerng.log:read /var/unbound/unbound.conf failed: 1 errors in configuration file
pfblockerng/pfblockerng.log:[1677709717] unbound[89128:0] fatal error: Could not read config file: /var/unbound/unbound.conf. Maybe try unbound -dd, it stays on the commandline to see more errors, or unbound-checkconf
pfblockerng/pfblockerng.log:/var/unbound/unbound.conf:111: error: syntax error
pfblockerng/pfblockerng.log:read /var/unbound/unbound.conf failed: 1 errors in configuration file
pfblockerng/pfblockerng.log:[1677709717] unbound[90291:0] fatal error: Could not read config file: /var/unbound/unbound.conf. Maybe try unbound -dd, it stays on the commandline to see more errors, or unbound-checkconf
There are no errors reported by unbound-checkconf
I force reloaded all the pfBlockerNG rules and cleaned up an orphan firewall rule. Lets see how this holds up....
-
After doing a force reload pfBlockerNG, the FW ran for about 28 hours before crashing again. I'm not using "python mode" but who knows.
I disabled DNSBL in pfBlockerNG and removed the "server:include: /var/unbound/pfb_dnsbl.*conf" entry, did a force reload of pfBlockerNG, reinstalled all, and rebooted the firewall.
When it hangs, my pslog script won't run. If I try to log in, I get the login prompt interactively either on console or via SSH, but no password prompt (console) or the prompt but no login (ssh). Something's alive, data is routed via 1:1 NAT (at least) but clearly a lot of core systems stop working. Not sure if unbound can take out quite so much.
The last crash happened at 13:09; I don't see anything obvious in the captured in that last, fateful minute, but perhaps someone else knows the signatures better than I:
Snort (nothing in the last minute, but going back 2 minutes earlier):
alert:03/05/23-13:07:06.119298 ,1,2038669,1,"ET EXPLOIT Realtek eCos RSDK/MSDK Stack-based Buffer Overflow Attempt Inbound (CVE-2022-27255)",UDP,151.106.38.158,6312,23.114.97.242,5060,41776,Attempted Administrator Privilege Gain,1,alert,Allow
alert:03/05/23-13:07:15.895163 ,1,2025822,2,"ET SCAN HID VertX and Edge door controllers discover",UDP,183.136.225.31,16146,23.114.97.248,4070,57830,Attempted Information Leak,2,alert,Allow
alert:03/05/23-13:07:33.888575 ,1,2038669,1,"ET EXPLOIT Realtek eCos RSDK/MSDK Stack-based Buffer Overflow Attempt Inbound (CVE-2022-27255)",UDP,151.106.38.198,9953,23.114.97.244,5060,26872,Attempted Administrator Privilege Gain,1,alert,Allow
Not sure why there's a socket connection about every minute.
openvpn.log:Mar  5 13:09:03 hishigata openvpn[33621]: MANAGEMENT: Client connected from /var/etc/openvpn/server1/sock
openvpn.log:Mar  5 13:09:03 hishigata openvpn[33621]: MANAGEMENT: CMD 'status 2'
openvpn.log:Mar  5 13:09:04 hishigata openvpn[33621]: MANAGEMENT: CMD 'quit'
openvpn.log:Mar  5 13:09:04 hishigata openvpn[33621]: MANAGEMENT: Client disconnected
openvpn.log:Mar  5 13:09:04 hishigata openvpn[49792]: MANAGEMENT: Client connected from /var/etc/openvpn/server2/sock
openvpn.log:Mar  5 13:09:04 hishigata openvpn[49792]: MANAGEMENT: CMD 'status 2'
openvpn.log:Mar  5 13:09:04 hishigata openvpn[49792]: MANAGEMENT: CMD 'quit'
openvpn.log:Mar  5 13:09:04 hishigata openvpn[49792]: MANAGEMENT: Client disconnected
e8:e7 is my core switch, I need to serial into it at some point and sort this out, but it's been like this for a decade.
dhcpd.log:Mar  5 13:09:22 hishigata dhcpd[69252]: DHCPDISCOVER from e8:e7:32:b0:2e:50 via igb1: network 10.3.69.0/24: no free leases
dhcpd.log:Mar  5 13:09:22 hishigata dhcpd[69252]: DHCPDISCOVER from e8:e7:32:b0:2e:50 via igb1: network 10.3.69.0/24: no free leases
dhcpd.log:Mar  5 13:09:24 hishigata dhcpd[69252]: uid lease 10.3.69.100 for client 00:c0:b7:2c:71:40 is duplicate on 10.3.69.0/24
dhcpd.log:Mar  5 13:09:24 hishigata dhcpd[69252]: DHCPDISCOVER from 00:c0:b7:2c:71:40 via igb1
dhcpd.log:Mar  5 13:09:24 hishigata dhcpd[69252]: DHCPOFFER on 10.3.69.220 to 00:c0:b7:2c:71:40 via igb1
dhcpd.log:Mar  5 13:09:25 hishigata dhcpd[69252]: DHCPDISCOVER from e8:e7:32:b0:2e:50 via igb1: network 10.3.69.0/24: no free leases
The resolver just seems to quietly go into the night
dhcpd.log:Mar  5 13:09:22 hishigata dhcpd[69252]: DHCPDISCOVER from e8:e7:32:b0:2e:50 via igb1: network 10.3.69.0/24: no free leases
dhcpd.log:Mar  5 13:09:22 hishigata dhcpd[69252]: DHCPDISCOVER from e8:e7:32:b0:2e:50 via igb1: network 10.3.69.0/24: no free leases
dhcpd.log:Mar  5 13:09:24 hishigata dhcpd[69252]: uid lease 10.3.69.100 for client 00:c0:b7:2c:71:40 is duplicate on 10.3.69.0/24
dhcpd.log:Mar  5 13:09:24 hishigata dhcpd[69252]: DHCPDISCOVER from 00:c0:b7:2c:71:40 via igb1
dhcpd.log:Mar  5 13:09:24 hishigata dhcpd[69252]: DHCPOFFER on 10.3.69.220 to 00:c0:b7:2c:71:40 via igb1
dhcpd.log:Mar  5 13:09:25 hishigata dhcpd[69252]: DHCPDISCOVER from e8:e7:32:b0:2e:50 via igb1: network 10.3.69.0/24: no free leases
Last filters don't show anything big
dhcpd.log:Mar  5 13:09:22 hishigata dhcpd[69252]: DHCPDISCOVER from e8:e7:32:b0:2e:50 via igb1: network 10.3.69.0/24: no free leases
dhcpd.log:Mar  5 13:09:22 hishigata dhcpd[69252]: DHCPDISCOVER from e8:e7:32:b0:2e:50 via igb1: network 10.3.69.0/24: no free leases
dhcpd.log:Mar  5 13:09:24 hishigata dhcpd[69252]: uid lease 10.3.69.100 for client 00:c0:b7:2c:71:40 is duplicate on 10.3.69.0/24
dhcpd.log:Mar  5 13:09:24 hishigata dhcpd[69252]: DHCPDISCOVER from 00:c0:b7:2c:71:40 via igb1
dhcpd.log:Mar  5 13:09:24 hishigata dhcpd[69252]: DHCPOFFER on 10.3.69.220 to 00:c0:b7:2c:71:40 via igb1
dhcpd.log:Mar  5 13:09:25 hishigata dhcpd[69252]: DHCPDISCOVER from e8:e7:32:b0:2e:50 via igb1: network 10.3.69.0/24: no free leases
I'll let it run until it either lives 48 hours or dies again and update.
-
@gessel said in Firewall locks up, possibly unbound config:
DHCPDISCOVER from some one -> 10.3.69.0/24: no free leases
No more free leases in the pool.
Or more devices as network addresses => another issue will be present on your wake up call.Feb 28 20:38:47 myfirewall unbound[51491]: [51491:0] info: start of service (unbound 1.13.2). Feb 28 20:38:47 myfirewall unbound[51491]: [51491:0] info: service stopped (unbound 1.13.2). Feb 28 20:38:47 myfirewall unbound[51491]: [51491:0] info: start of service (unbound 1.13.2). Feb 28 20:39:18 myfirewall unbound[51491]: [51491:0] info: service stopped (unbound 1.13.2). Feb 28 20:39:19 myfirewall unbound[51491]: [51491:0] info: start of service (unbound 1.13.2). Feb 28 20:39:19 myfirewall unbound[51491]: [51491:0] info: service stopped (unbound 1.13.2). Feb 28 20:39:20 myfirewall unbound[51491]: [51491:0] info: start of service (unbound 1.13.2).pfSense most important process restarts every 45 seconds or so.
That doesn't sound like an alarm bell to you ?
And guess what : it's a known subject.
If this one is checked :
you are invited to remove that check.
Because it really does what it says it does : when a DHCP lease comes in, or is renew, unbound is restarted.
If you have a lot of devices (and you have) (or you have very small FHCP pools ...) then you are chain guninng unbound. -
@gessel Did you mean to post the same dhcpd.log 3x?
If it was running out of memory I'd expect to see something in the logs.
-
@Gertjan good advice, I'll do that.
@SteveITS No.... no I didn't. Some very bad copy paste fu there.
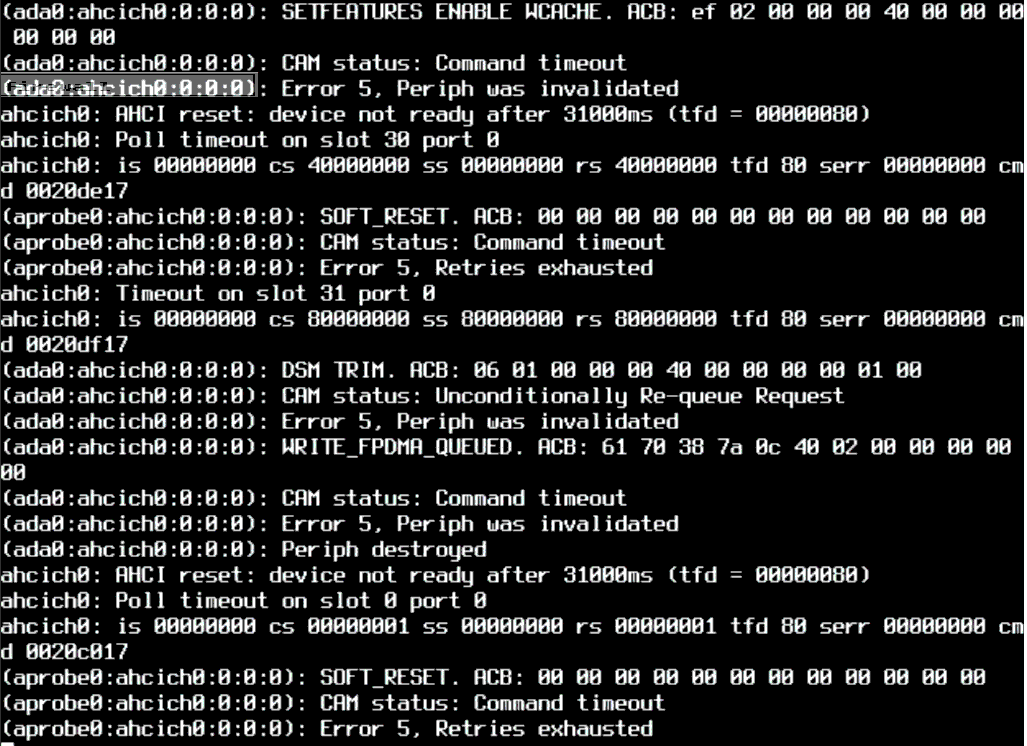
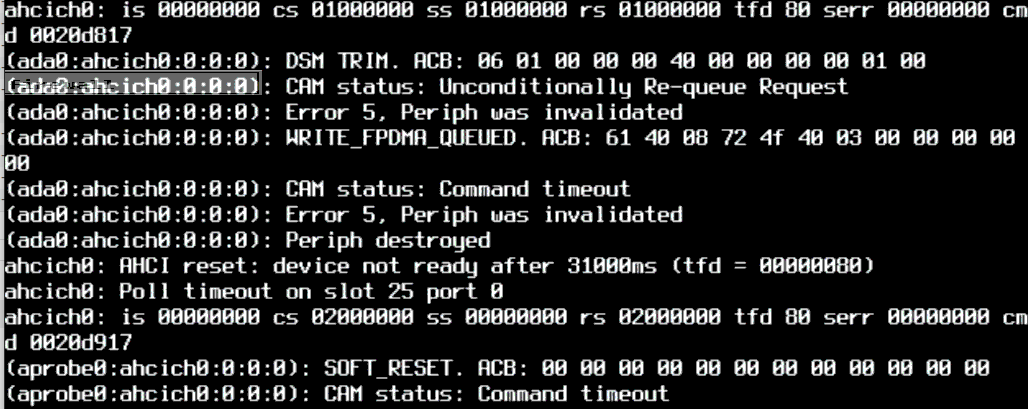
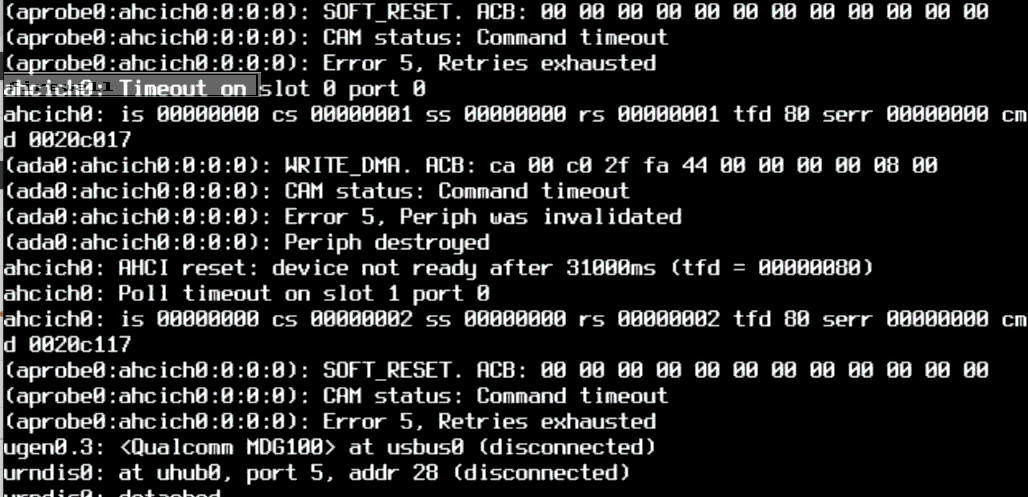
I caught the console before it scrolled off and it showed cam errors, likely indicative of a hardware fault. It isn't showing in testing (either ZFS or SMART) nor in the logs, but if drive access failed, it wouldn't show in the logs... on that drive.
I followed the advice for slightly degrading performance in this thread and follow @Gertjan's advice and report any updates.
As for the DHCP requests, yes, something is off, but has been for years. The switch that's generating the requests has to be configured via serial console and I don't have remote access to it at the moment.
-
@gessel
Swap you "ada0" drive asap. It's dying. -
@gertjan, thanks for the advice but I think it is an interface quirk, reinforced a bit by this thread. The device is SLC and should be relatively robust. Do you see anything problematic in the smart data? Suggest any other test (other than # diskinfo -cti and ZFS scrub)?
SMART Attributes Data Structure revision number: 16
Vendor Specific SMART Attributes with Thresholds:
ID# ATTRIBUTE_NAME          FLAG     VALUE WORST THRESH TYPE      UPDATED  WHEN_FAILED RAW_VALUE
  9 Power_On_Hours          0x0012   100   100   000    Old_age   Always       -       377
 12 Power_Cycle_Count       0x0012   100   100   000    Old_age   Always       -       61
163 (Max. erase count)      0x0000   100   100   000    Old_age   Offline      -       392
164 (Avg. erase count)      0x0000   100   100   000    Old_age   Offline      -       36
166 (Total bad block count) 0x0000   100   100   000    Old_age   Offline      -       0
167 (SSD Protect Mode)      0x0022   100   100   000    Old_age   Always       -       0
168 (SATA PHY Error Count)  0x0012   100   100   000    Old_age   Always       -       0
175 (Bad Cluster Table Ct)  0x0000   100   100   000    Old_age   Offline      -       0
192 (Unexpected Pwr Loss Ct)0x0012   100   100   000    Old_age   Always       -       11
194 Temperature_Celsius     0x0023   070   070   000    Pre-fail  Always       -       30
231  (% left)               0x0013   100   100   000    Pre-fail  Always       -       98
241 Total_LBAs_Written      0x0012   100   100   000    Old_age   Always       -       1264503843
(parenthetic attribute names are from the OEM (Fortassa) data sheet or ODM (Apacer for ID 231) information.

SMART Error Log Version: 1
No Errors Logged

SMART Self-test log structure revision number 1
Num  Test_Description    Status                  Remaining  LifeTime(hours)  LBA_of_first_error
# 1  Extended offline    Completed without error       00%       354         -
# 2  Extended offline    Completed without error       00%       306         -

SMART Selective self-test log data structure revision number 0
Note: revision number not 1 implies that no selective self-test has ever been run
 SPAN  MIN_LBA  MAX_LBA  CURRENT_TEST_STATUS
    1        0        0  Not_testing
    2        0        0  Not_testing
    3        0        0  Not_testing
    4        0        0  Not_testing
    5        0        0  Not_testing
I set the following parameters and rebooted:
camcontrol tags ada0 -N 25
vfs.zfs.cache_flush_disable="1" -> /boot/loader.conf
hint.ahcich.0.sata_rev=2 -> /boot/device.hints
Current uptime: 23 hours. Closing in on the 27 hour record so far.
-
@gessel Bummer, but some progress. Once again it hung, after 35 hours this time. It threw the same errors, including perhaps usefully, that an autotrim operation was in progress.
One I get control back, I'll disable autotrim. I'm still suspect of the negotiated command tag queue, but perhaps this firmware (SFPS925A) doesn't properly support TRIM, a possibility supported by the Product Change Notices from Apacer for the SFPS928A update.
I've written both Fortasa and Apacer to see if they have any archives of the firmware update. Will update with any further progress.
-
All the symptoms you describe here could be a bad drive. The firewall continuing to pass traffic but services slowly dying is exactly what happens when it cannot access the drive.
Those console logs just confirm it for me. You need to swap out the drive.Steve
-
@stephenw10 Indeed it could be, though my experience with SSD failure is binary while rotating disks tend to go through more dramatic death throes. It could be a bad/flaky interconnect (not a cable for an mSATA but possibly oxidized lands on the board). However, they are also all consistent with issues that popped up around the time this drive was produced (2015/2016ish) with autotrim and command queuing with certain drive configurations.
If I had hands on, I'd try swapping drives around - same brand/revision and alternate drives; alas, I do not have hands so that I might get more directly to the root cause.
In lieu of that, I've done the following and rebooted and verified the changes were accepted. This done, it is time to wait and see. Should this fail, I'll revert to my trusty IBM x336 until I can get my hands on that little box.
: less /boot/device.hints
...
hint.ahcich.0.sata_rev=2
: less /boot/loader.conf.local legal.intel_ipw.license_ack=1 legal.intel_iwi.license_ack=1 vfs.zfs.cache_flush_disable="1" vfs.zfs.trim.enabled="0": less /usr/local/etc/rc.d/camcontrol.sh #!/bin/sh CAMCONTROL=/sbin/camcontrol $CAMCONTROL tags ada0 -N 1 > /dev/null $CAMCONTROL negotiate ada0 -T disable > /dev/null $CAMCONTROL reset ada0 > /dev/null exit 0which yields after reboot:
:  sysctl vfs.zfs.trim.enabled
vfs.zfs.trim.enabled:  0
: sysctl vfs.zfs.cache_flush_disable
vfs.zfs.cache_flush_disable: 1
: dmesg | grep -i transfers
ada0: 300.000MB/s transfers (SATA 2.x, UDMA6, PIO 8192bytes)
: camcontrol tags ada0 -v
(pass0:ahcich0:0:0:0): dev_openings  2
: camcontrol negotiate ada0 -v
...
(pass0:ahcich0:0:0:0): tagged queueing: disabled
Transfer rates aren't much changed, but IOPS are hammered by these changes, definitely not HiPro, but we just need stability. Fingers crossed.
-
Mmm, I have seen bad SSDs behave almost exactly like this. pfSense will keep running even when it loses it's boot drive entirely. Services fail as they try to load or save data to the drive, eventually everything fails. After power cycling the SSD re-appears and seems good for some time until it fails again.
Usually you see no errors logged because logging is the first thing to fail. But you would see that nothing has been logged and that's a pretty telling symptom. -
@stephenw10 For sure, you're 100% correct. It is just a suboptimal cause compared to a driver/firmware incompatibility issue, which is also possible and would yield the same symptoms. Since replacing the drive isn't practical, I'm for the latter (and that it can be mitigated fairly easily).
I may well be looking to confirm that bias, but when I've had SSDs fail, they just stop working completely or fail in a way that shows up in SMART data. I haven't yet had one fail in a way that throws no SMART errors (different storage system on the drive so as long as the controller isn't hung it should get written) nor have i had one that got flaky in the way that rotating media often does as it gets near EOL or gets a platter divot that causes crashes when the head crosses that track but not otherwise.
It could very well be a power transistor or voltage regulator or some other power electronic bit that works within tolerance mostly but not always. That would be sad. There are some potentially relevant issues with SFPS925A firmware (items 2 and 3 from the H1 Product Change Notice seem relevant):
- Enhanced reliability on mapping table for L95B Nand flash
- Fixed DCO set always disable TRIM command during TRIM operating
- Fixed TRIM command hang issue when burning testing under Win10 environment
- Enhanced table fail handling when UNC happened for L95B Nand flash
- Added HW VA- dummy write support
- Added HW VA- security erase support ( pattern : 0x21 / 0x00)
- Enhanced DLMC flexibility
- Modified NAND access mechanism for Micron L95B flash characteristic. To enhance data reliability.
- Optimize internal error handling flow for corner case.
- Add Toshiba 15nm 32Gb NAND support.
- Modified Identify state reply after COMRESET.
(from http://eflash.apacerus.com/spec/PCN/Apacer_PCN_mSATA%20H1_SFPS928A%20firmware%20launch_20160906_SFPS925A.pdf)
Time will tell.
-
Yup, might as well try that first if you can.
-
@stephenw10 Over 2 days uptime now. Optimism feels risky.
-
@gessel well dang it. 2 days, 15 hours uptime and then.
Next step, try a wiggly reseat of the mSATA disk. If that fails, revert to the tried and true Big Blue.
-
 N NogBadTheBad referenced this topic on
-
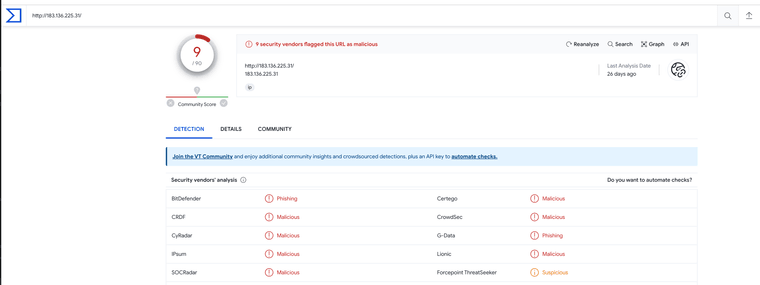
@gessel I too have an alert from this China IP block 183.136.225.29
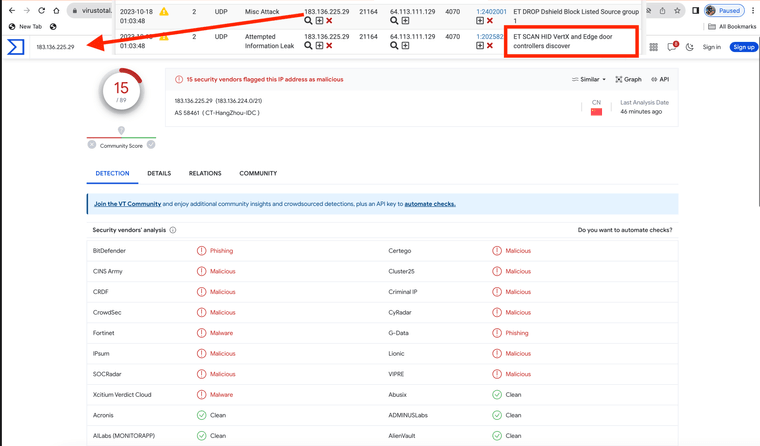
https://forum.netgate.com/topic/183488/et-scan-hid-vertx-and-edge-door-controllers-discover
Virus total shows it is an invasive actor.
183.136.225.31 also