How to read RTTsd and why is it not the same everywhere in pfSense
-
With such a low baseline RTT and coarse collection intervals the sd swings will look quite spiky but it does look somewhat extreme in your example.
I note you have not included the table below the graph. Any chance you have issues with QoS, bufferbloat and/or bandwidth saturation?
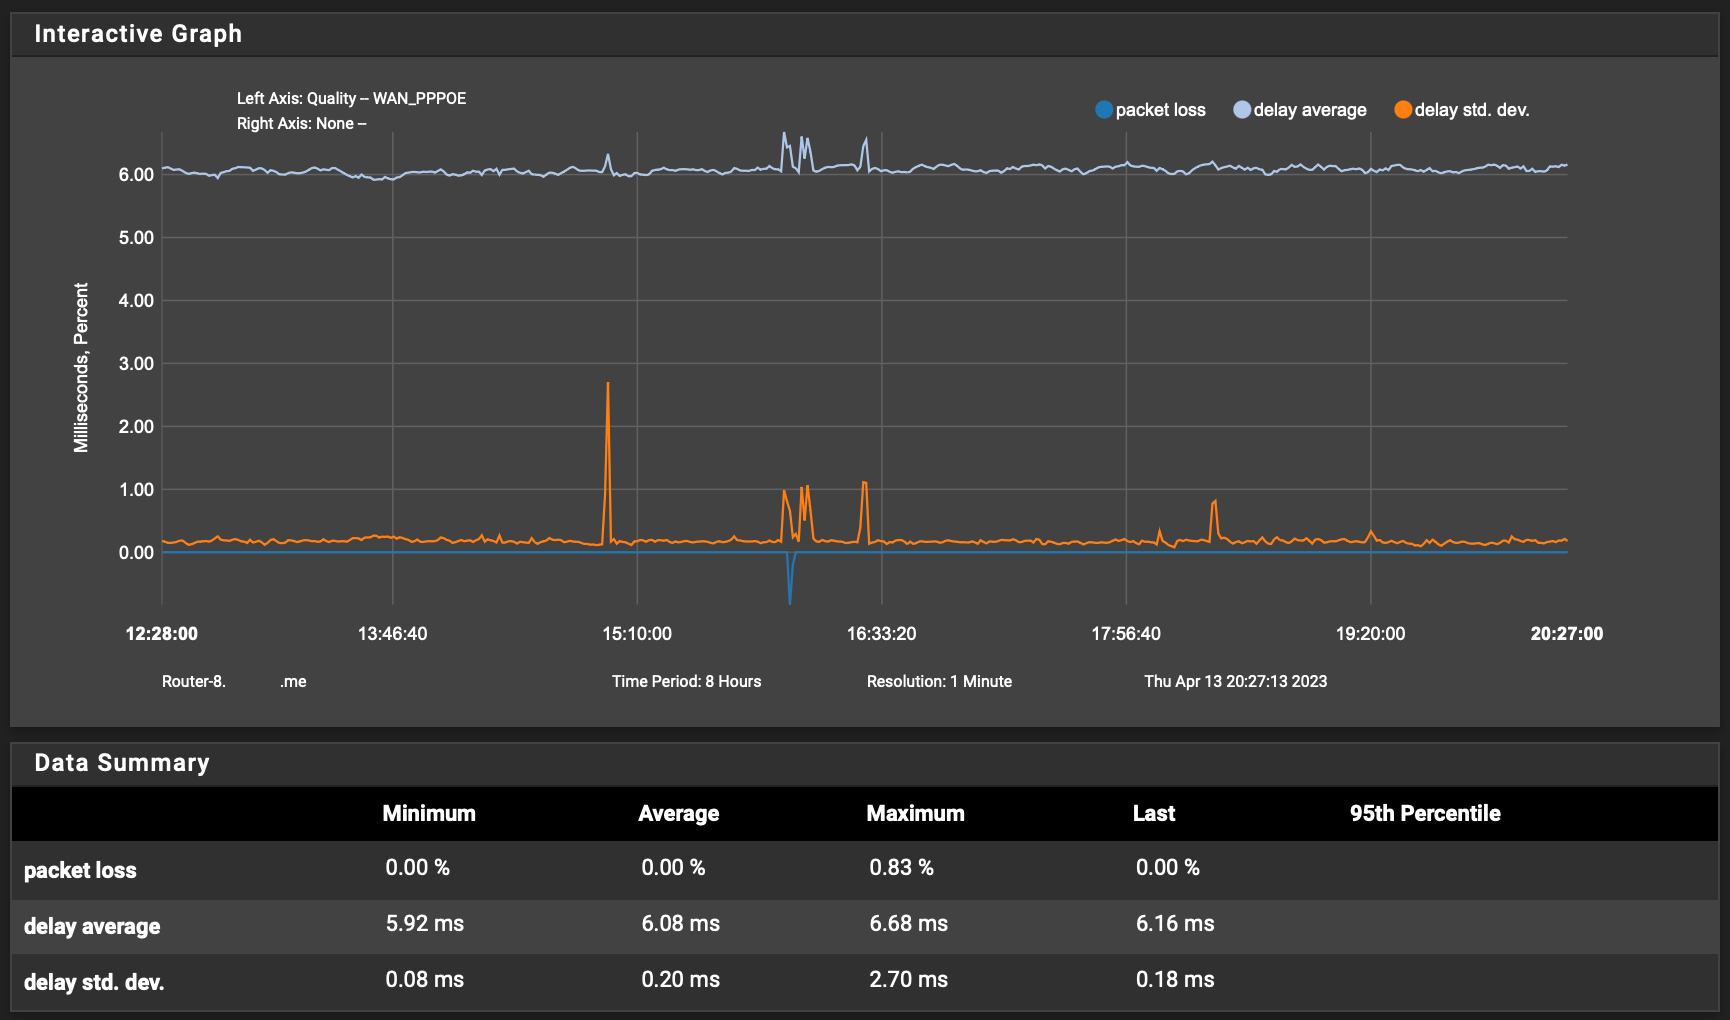
Anyway, mine just now:
 ️
️ -
Hmm, well you could be right. I've never really run the numbers directly myself.
Looks like it's calculated here: https://github.com/pfsense/dpinger/blob/master/dpinger.c#L493
-
@robbiett said in How to read RTTsd and why is it not the same everywhere in pfSense:
QoS - not using that at all.
bufferbloat and/or bandwidth saturation - well no large part of this particular screen i know there was hardly any traffic that day. Like less then 10mbit of the 1gbit link i have.
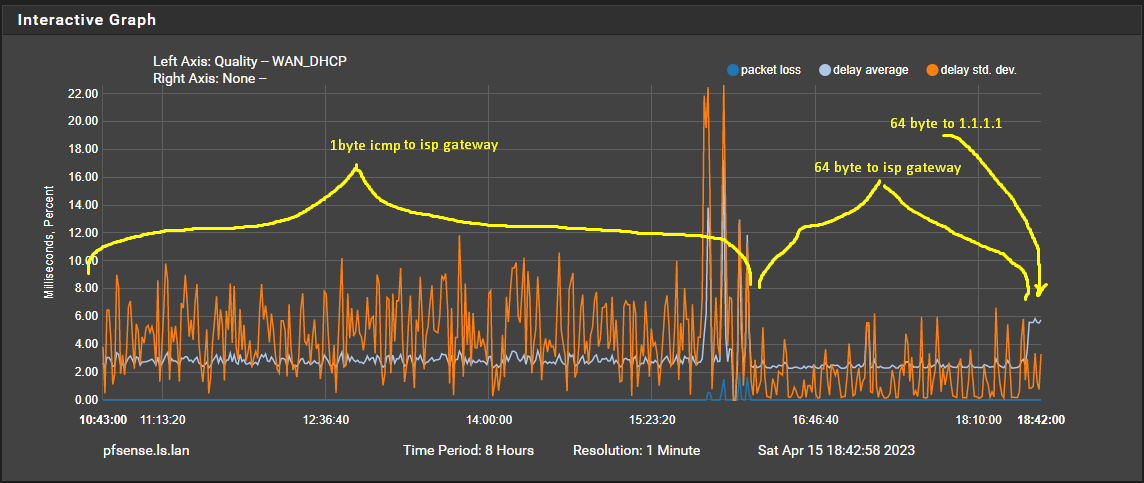
The screenshot was made on a laptop that does not has a full hd screen, it's actually a printscreen of the browser in full screen modus, so not intentional cut of but you can see the min and max pretty well in the graph. -
@stephenw10 Well that looks like an interesting piece of math, but it does not look like the calculation for stddev. This page show the calculation step by step. Not the same steps as in this code. www.scribbr.com/statistics/standard-deviation.
Or this stolen but as far as i can see correct example written in c. c-program-to-calculate-the-standard-deviation
Also the diagnostic ping function of pfSense seems to be the standard ping of the FreeBSD os as can be found here: line 117 -119
Which means the following command is used:
/sbin/ping -S<interface-address> -c<number-of-pings> -i1 <destination-address>I cannot imagine that the calculation of the native FreeBSD is wrong.
Also now i know what can be done i can do more pings to see if my findings where a fluke.
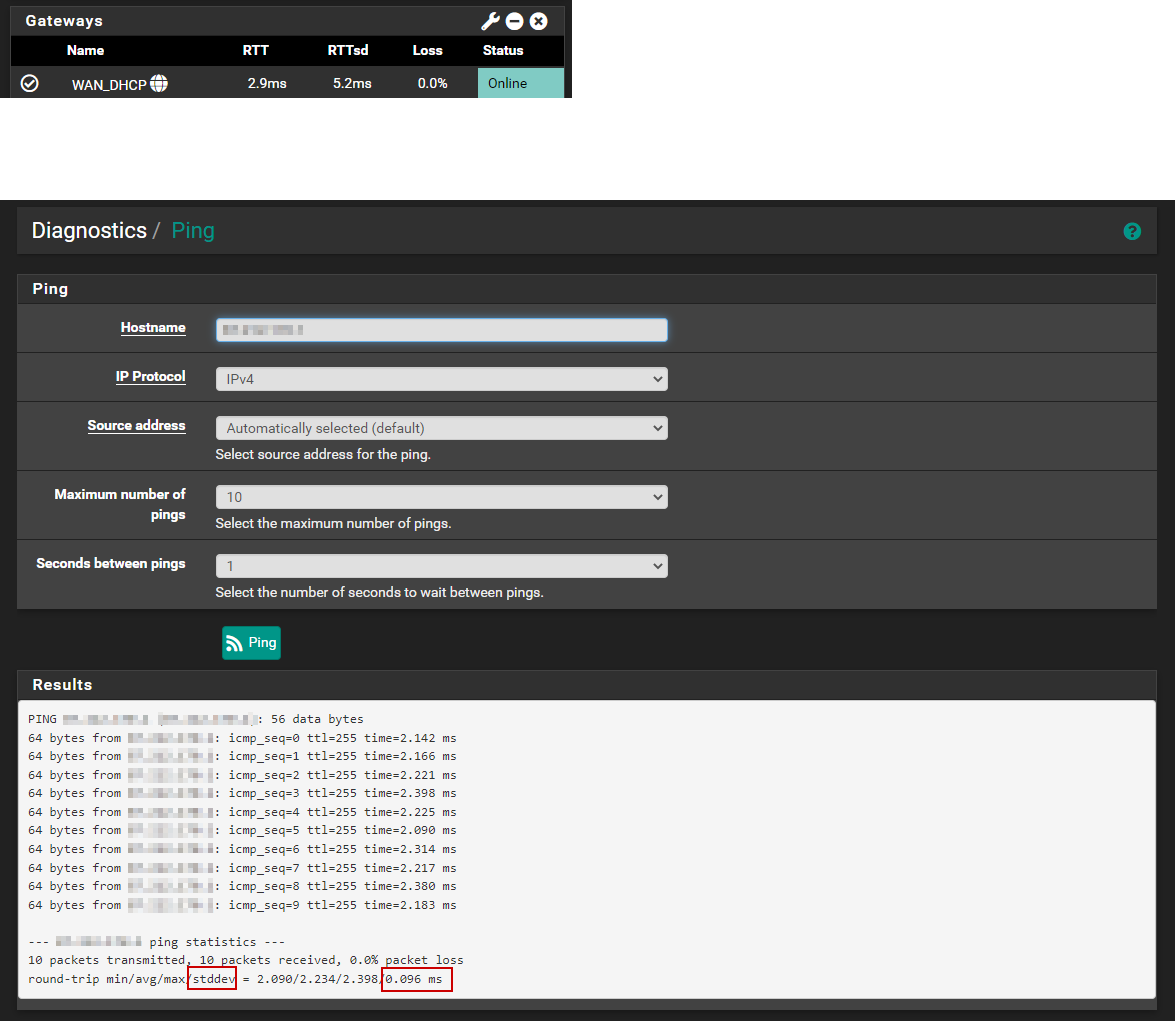
--- 1.1.1.1 ping statistics ---
60 packets transmitted, 60 packets received, 0.0% packet loss
round-trip min/avg/max/stddev = 5.147/5.447/7.217/0.294 msNo still looks the same FreeBSD ping reports numbers that you would expect.
-
@leon-straathof It's quite an interesting thing you have uncovered and as for the maths, stranger things have happened when moving code around.
️ -
@robbiett i have to admit, i can understand and can read a bit of math and i can read and program a bit of code. But i am not the best in both and it hurts my brain when i have to convert math to code. I know thats the same for a lot of other people even the ones that are far better then me in programming. So i would not blame a programmer if there was this kind of mistake somewhere. Although i programmed fourier analysis in native 6502 assembly when i was 17 which up to today i consider the hardest math to programming conversion i have ever done.
-
Mmm, I was looking at various examples last night and couldn't decide if it's right. I found examples of both.
That may have been inherited from apinger when dpinger was created. @dennypage ?
-
@stephenw10 said in How to read RTTsd and why is it not the same everywhere in pfSense:
That may have been inherited from apinger when dpinger was created.
Dpinger was written from the ground up. Nothing there from apinger.
@Leon-Straathof The standard deviation calculation used by dpinger is the same as used by ping. If you want to compare the math to confirm it, look at the ping code. Many have already done so, and so far none have judged that dinger's math was incorrect.
As to the original question of ping showing a different value than dpinger, this is to be expected. Even if you run dpinger and ping with exactly the parameters, or two copies of ping for that matter, you will see variation. Sometimes significant variation. In this case however, you are running with quite different parameters. Dpinger uses a payload of 1 byte, an interval of 500ms, and averages results over a rolling 60 second window. With ping, you are using a payload of 64 bytes, an interval of 1000ms, and averaging over a static 10 second window. These are very, very different things.
FWIW, I based on your graph, I would say that you are pinging a local modem, or at best a local bridge node. That you have samples at/below 2ms is a dead give-away. These types of devices usually have high variation in ICMP response, and are not useful in measuring real-world network latency.
What you want as a monitor target is at least on the other side of the last leg connection. Or, a regional core router inside the ISP. Some people use public address on the other side of the ISP instead, such as 1.1.1.1 or 8.8.8.8. I personally think this is unnecessary, but some people do it.
What I would suggest is that you run a trace route to google.com or some such, and pick something deeper in the chain. Unless you are in a MAN, I would expect something with a base of at least 4ms away before you get anywhere near your ISP's regional core.
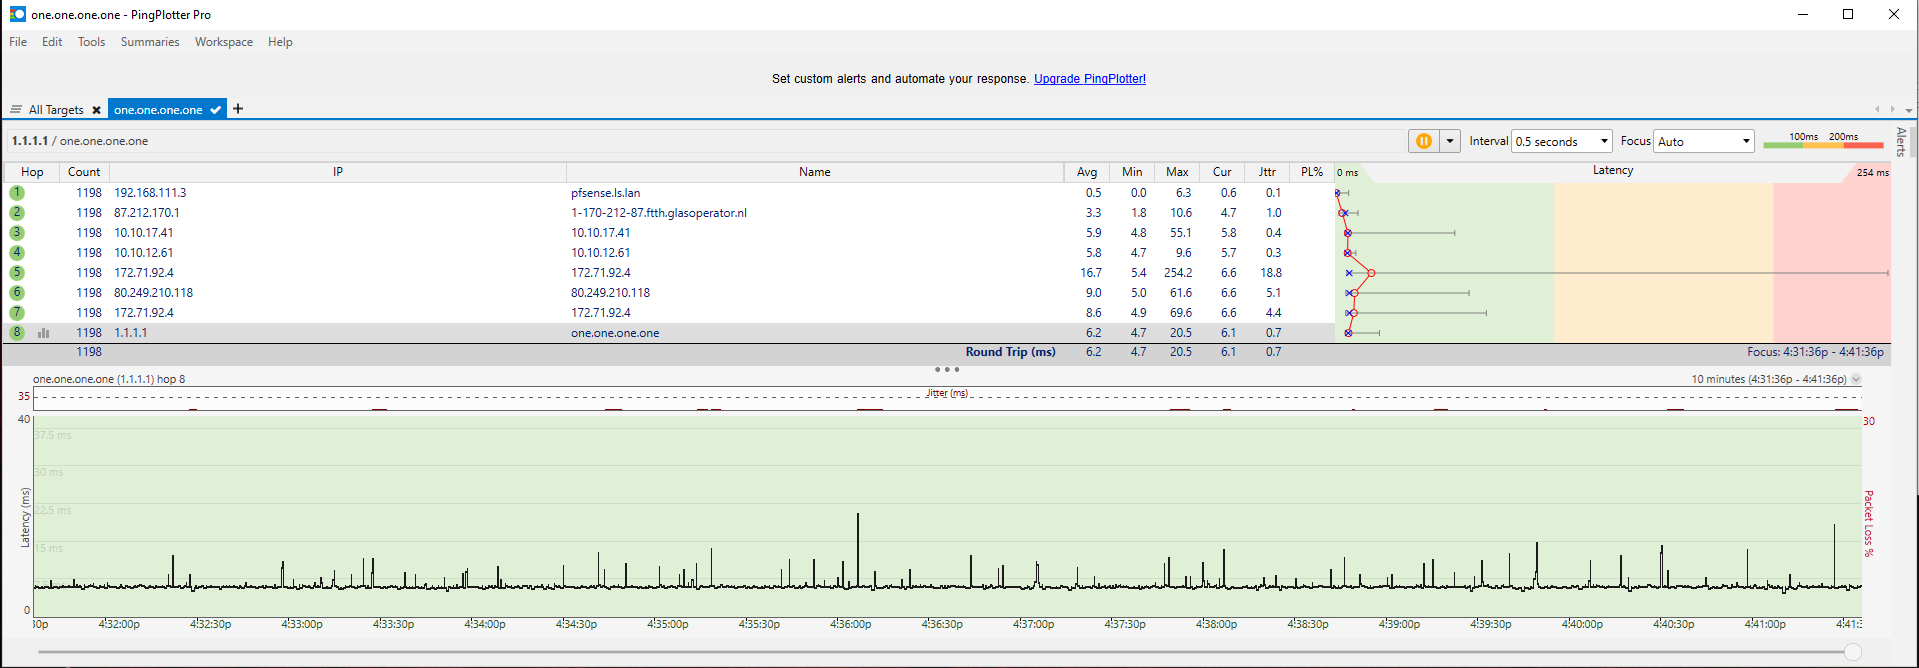
I have a reasonably good connection. It's not gig fiber, but it's not bad. Here's what mine looks like to the first regional core router in my ISP:
FWIW, if I ping my default route, which is a local modem 1' away from pfSense, I see between 1.8 and 2.1ms. Simply not a useful number at all.
When you pick a monitor address, watch it for a while. Many ISPs have IPv4 ICMP set as the lowest priority, so often you will find edge or core routers that have sharp limits on icmp processing. If you see wild variations in the number, or drops when there shouldn't be, look for a different address to monitor.
-
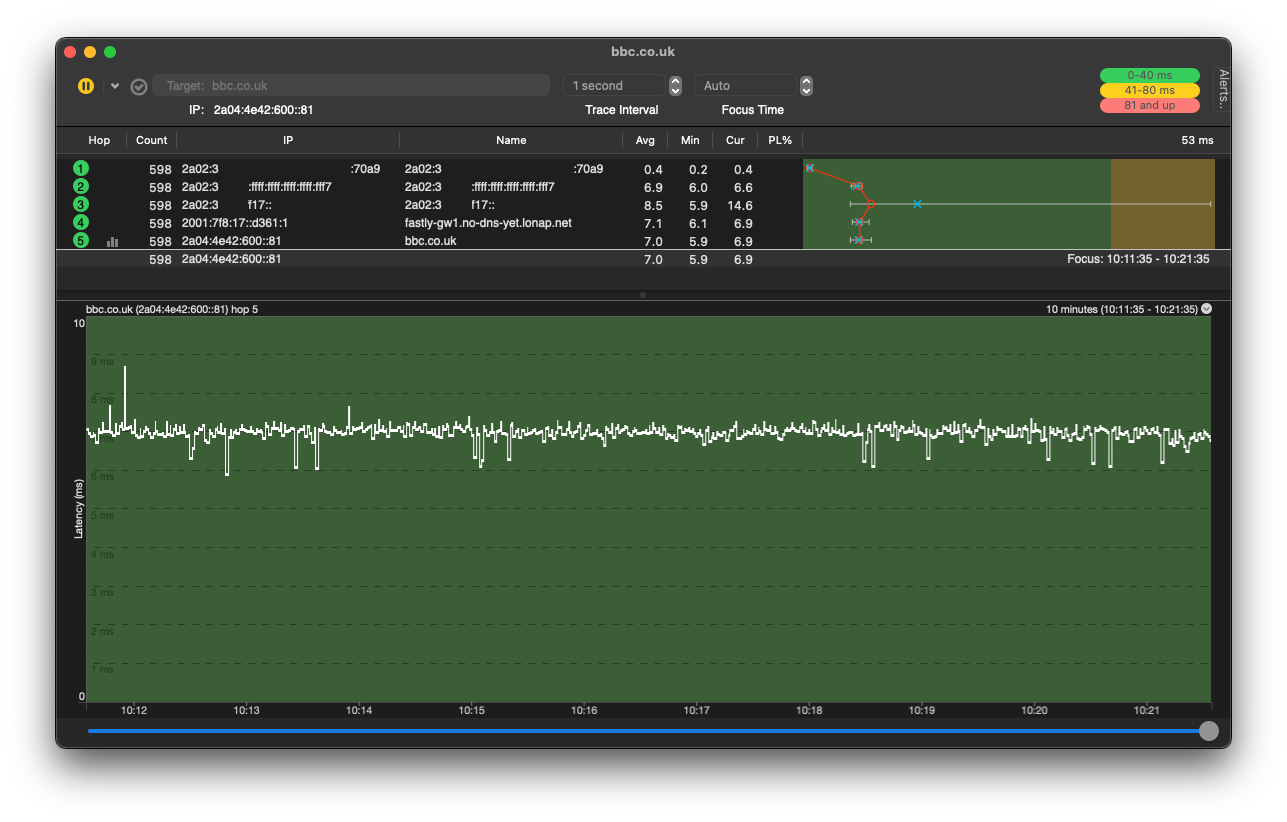
Looking into the chain is really good advice. Sometimes tools can be helpful to visualise it all and see impact pre and post the ISP's core.
This is mine from ping plotter (other tools are equally as good, this runs as a background task on a macOS server), showing the RTTs from the various hops, including the core, out to the BBC's servers:
Testing to an endpoint on a web service is only useful if it provides data on the extremes that you can then ignore if not relevant. This example is waveform.com, which is US based. I'm in the UK so reliant on their CDNs; ping outliers (extreme right of the traces) can usually be attributed to the service pulling from across the pond. The point is that these are well beyond your ISP's and your network's control:
 ️
️ -
-
@dennypage said in How to read RTTsd and why is it not the same everywhere in pfSense:
F
I could not find the math part of the FreeBSD ping but if they are the same they should indeed give the same result if they would be fed the same data. But i understand that the ping parameters are different. Still it's strange that i have this big of a difference when the ping payload and interval is different. I am not targetting a local modem (not have any my pfSense box or rather the ESX host in this case is straigt connected to the fiber) Adn i am pinging the gateway at my ips. Also i ruled out the isp gateway being the problem and did configure it for some time to ping 1.1.1.1 Which increases my average from about 3,5ms to about 5,5ms but the RTTsd graph for 8 hours stays the same funky spike shit as in the 2nd screenshot.
-
You can set dpinger to use those same 3 parameters in the advanced gateway settings. Should be easy enough to check.
-
@robbiett I tested with the same site, my location is the Netherlands so i also have the pond in between. However my results look worse.
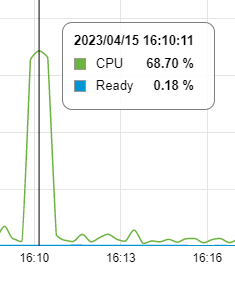
I looked at CPU usage of my pfSense during that test but that seems to be fine, it is used but not stressed.
Also installed Dpinger and did a 10 minute monitor.
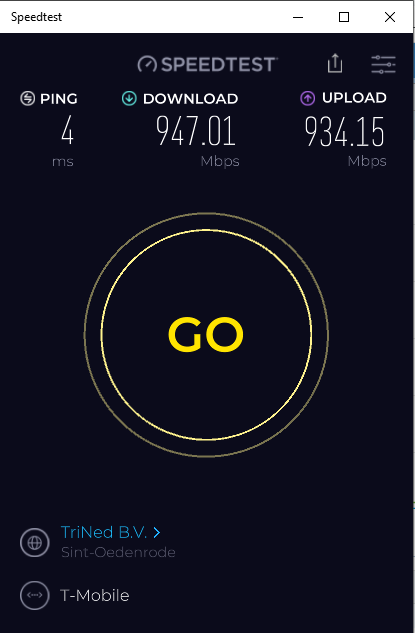
The less informative Ookla test shows also that i can max out my 1Gb connection. All local interfaces and switches are 1Gb as well so speed is not the problem.
-
@dennypage said in How to read RTTsd and why is it not the same everywhere in pfSense:
1 byte, an interval of 500ms
I cannot use 1 byte with the FreeBSD ping because it refuses to calculate any of the total result numbers if i do, i cannot get it to work with smaller then 16. This because FreeBSD ping does not return RTT information with smaller payploads for the pings.
/sbin/ping -S87.212.171.97 -c120 -i0.5 -s16 1.1.1.1
--- 1.1.1.1 ping statistics ---
120 packets transmitted, 120 packets received, 0.0% packet loss
round-trip min/avg/max/stddev = 5.129/5.380/10.037/0.441 msThe stddev is worse when i use 16 bytes as payload as opposed to the default 64 bytes could that be a hint in what is wrong with my setup/connection?
-
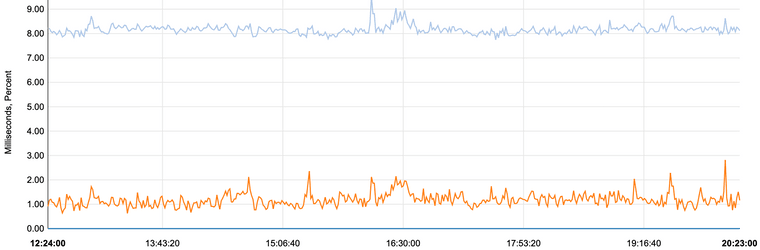
@stephenw10 Thanks i never unfolded the advanced settings in the gateway settings, because the most important like the destination to monitor are already visible. I changed the payload to 64 bytes (the default for Linux/FreeBSD) and the graph improved dramatically. Still not a flat line but it got a lot better.
Now my next question is why is ICMP with a 1 byte payload a problem? Less data to transport makes transport easier you would think. Also the destination of 1.1.1.1 should not have a problem with 1 byte ICMP?? Anyone can verify that?
-
@leon-straathof said in How to read RTTsd and why is it not the same everywhere in pfSense:
I cannot use 1 byte with the FreeBSD ping because it refuses to calculate any of the total result numbers if i do, i cannot get it to work with smaller then 16. This because FreeBSD ping does not return RTT information with smaller payploads for the pings.
Yes, I know. A minor deficiency in ping. However you can set dpinger up with the same parameters as ping if you want to go that route.
/sbin/ping -S87.212.171.97 -c120 -i0.5 -s16 1.1.1.1
--- 1.1.1.1 ping statistics ---
120 packets transmitted, 120 packets received, 0.0% packet loss
round-trip min/avg/max/stddev = 5.129/5.380/10.037/0.441 msA 5.3ms average to cloud flare. I am envious of your connection. My average to cloud flare is ~10ms.
But going back to your original graph, your average looks to be ~3.3ms. I still believe that you are pinging a local modem, or perhaps a local fiber splitter rather than a router in the regional core. If you are interested, you can post a trace route to 1.1.1.1 and 8.8.8.8 (with and without -I) and we should be able to identify the regional core. With your ping results to cloud flare, I would guess the regional core to be ~4-4.5ms away from you.
The stddev is worse when i use 16 bytes as payload as opposed to the default 64 bytes could that be a hint in what is wrong with my setup/connection?
A smaller payload will often show a higher deviation. All other things equal (which they never are) a smaller payload reduces the minimum transmission time of the packets. This means variations in latency have a higher impact on the variance.
Other than the fact you may be monitoring a local address, I haven't seen anything indicating that your connection has an actual problem. Are you trying to troubleshoot a problem with the connection?
I would recommend that you change your monitor address to 1.1.1.1. Leave it that way for a while. See what you see.
-
@dennypage Thanks, i already have set it to monitor 1.1.1.1 with 64 byte payload. I first changed it to the gateway with 64 bytes that already made a visible difference as you can see in the reply with screenshot to @stephenw10 . The gateway of my isp i monitor is not a local device as i said there is no isp modem in my house (well there is because t-mobile sends one anyway but it is still in the box, i did not even unpack it). The ip of the isp gateway is 87.212.170.1. Also when i monitor 1.1.1.1 with 1 byte icmp requests the graph is the same bad graph i did not post a picture of that but i already tried that for over a day when troubleshooting before posting anything.
I am really happy with my connection, no real complaints. But i use Geforce Now for gaming and i want to get as little delay/hicups as possible. On occasion i have a little stutter so i wanted to make sure nothing was not optimal at my end. You don't need gbit connection most of the time speed is just a nice to have, a rock solid stable connection is much more important to me.
-
@stephenw10 FWIW, the math for a standard deviation is actually simple. What is difficult, and why it looks a bit complicated in dpinger.c, is doing it using integer math. Floating point math is much simpler.
-
@dennypage ah that makes sense, i am used to converting math to FP as it is a more 1:1 approach and easier to see the original formula in it.
-
@leon-straathof said in How to read RTTsd and why is it not the same everywhere in pfSense:
I am really happy with my connection, no real complaints. But i use Geforce Now for gaming and i want to get as little delay/hicups as possible. On occasion i have a little stutter so i wanted to make sure nothing was not optimal at my end. You don't need gbit connection most of the time speed is just a nice to have, a rock solid stable connection is much more important to me.
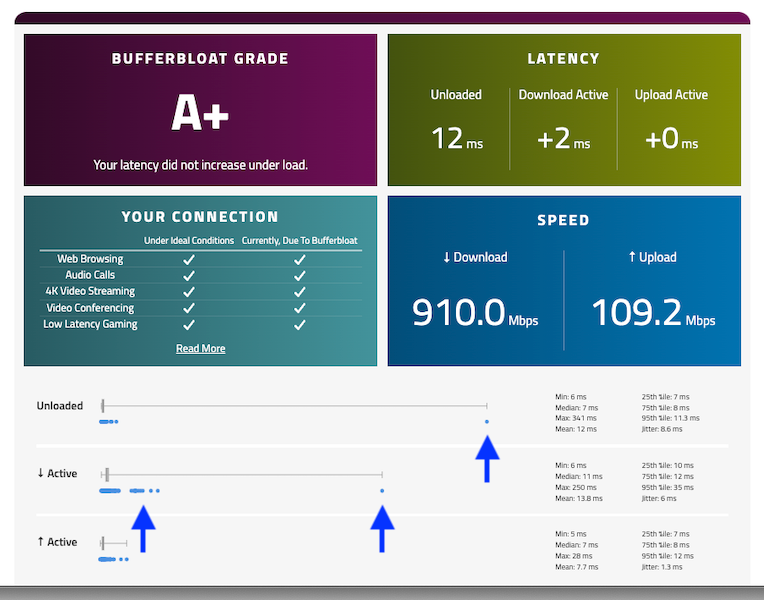
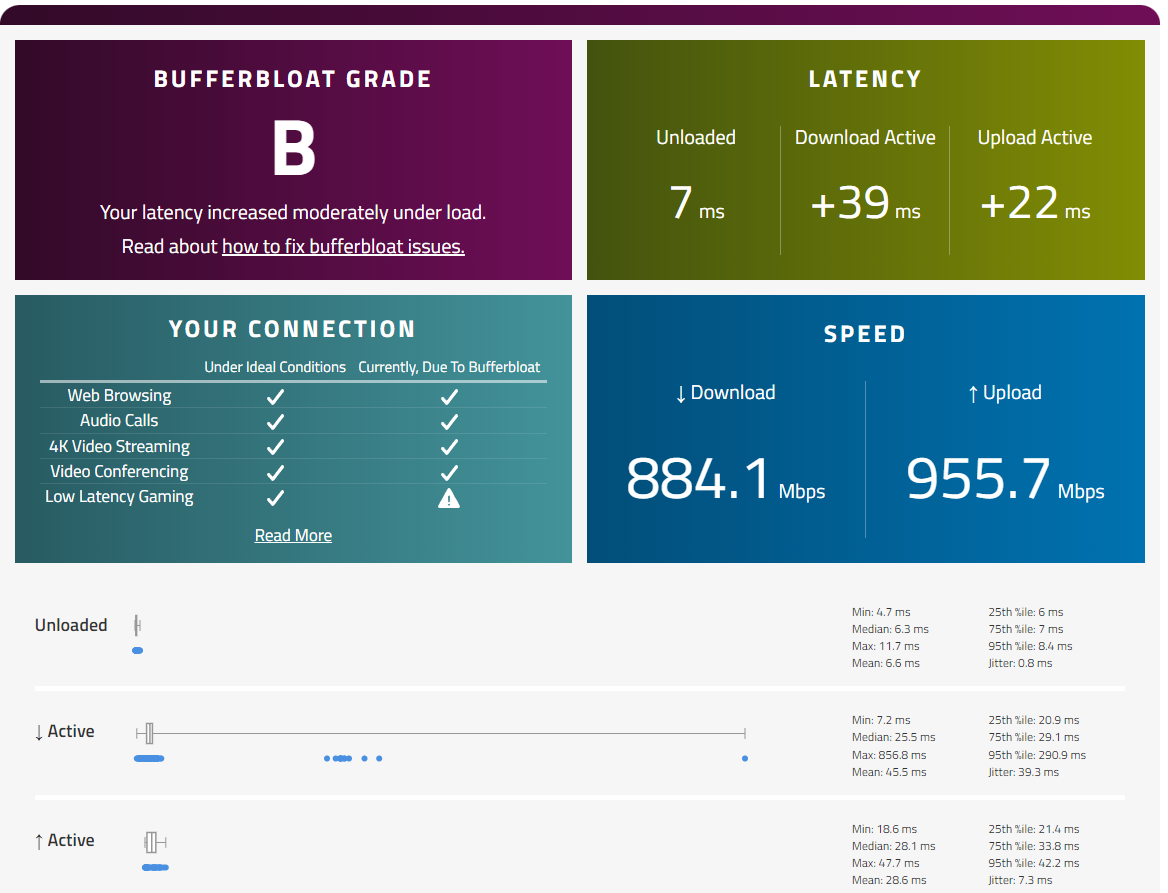
Ok, sounds like you need to setup a QoS such as FQ_CoDel. I'm envious of your upload bandwidth but without FQ_CoDel running my buffer-bloat grade would be the same as yours, or worse.
I have to run my connection pretty hard at times and I have some propriety things going on that are latency and jitter sensitive. As such, QoS management is vital to me. If you always have bandwidth to spare then, other than during speedtests or major file transfers, you are unlikely to see a QoS or buffer-bloat issues in real-world usage, given your 1 GbE symmetrical service.
️