How to read RTTsd and why is it not the same everywhere in pfSense
-
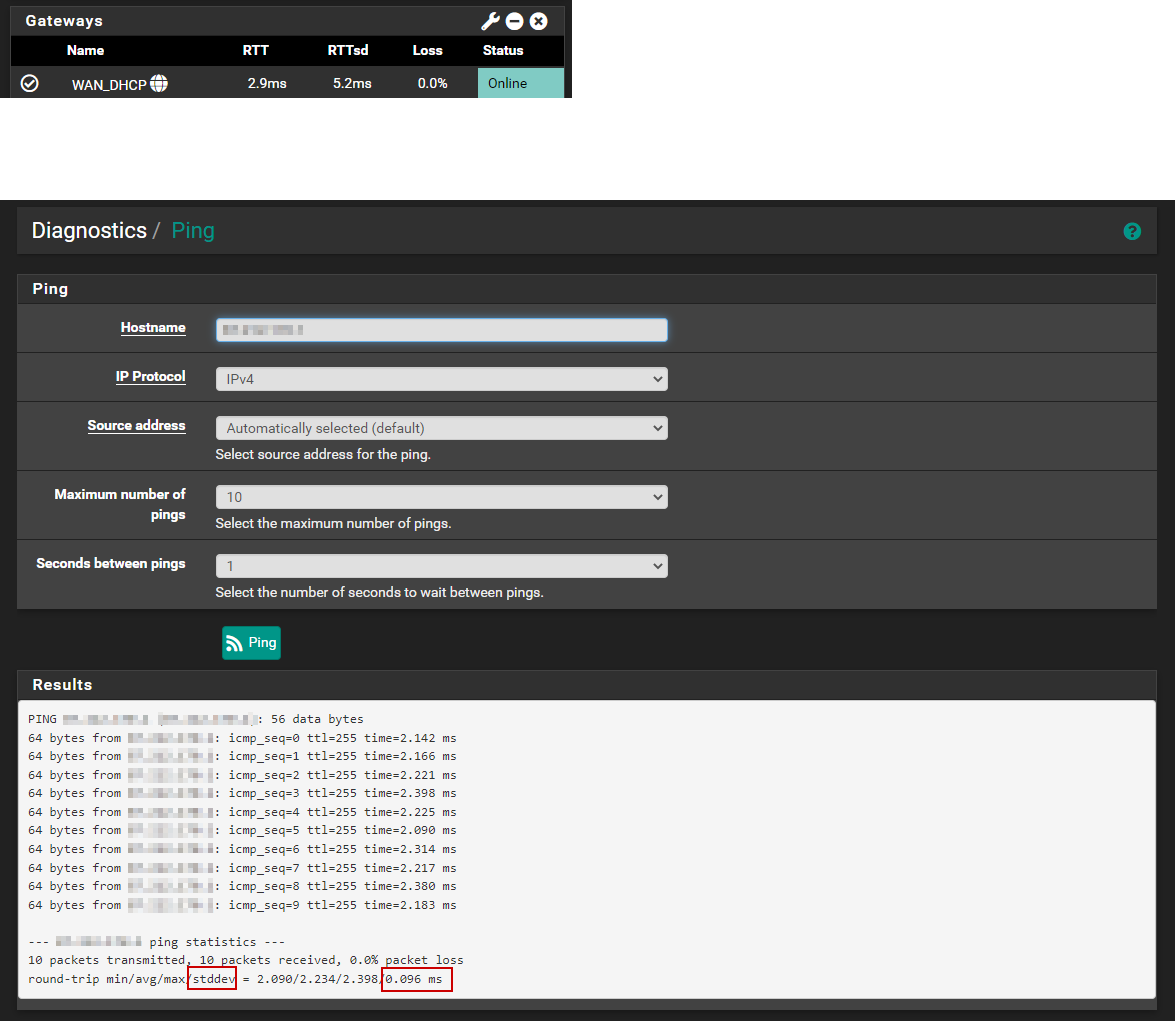
@robbiett I tested with the same site, my location is the Netherlands so i also have the pond in between. However my results look worse.
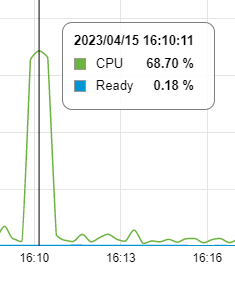
I looked at CPU usage of my pfSense during that test but that seems to be fine, it is used but not stressed.
Also installed Dpinger and did a 10 minute monitor.
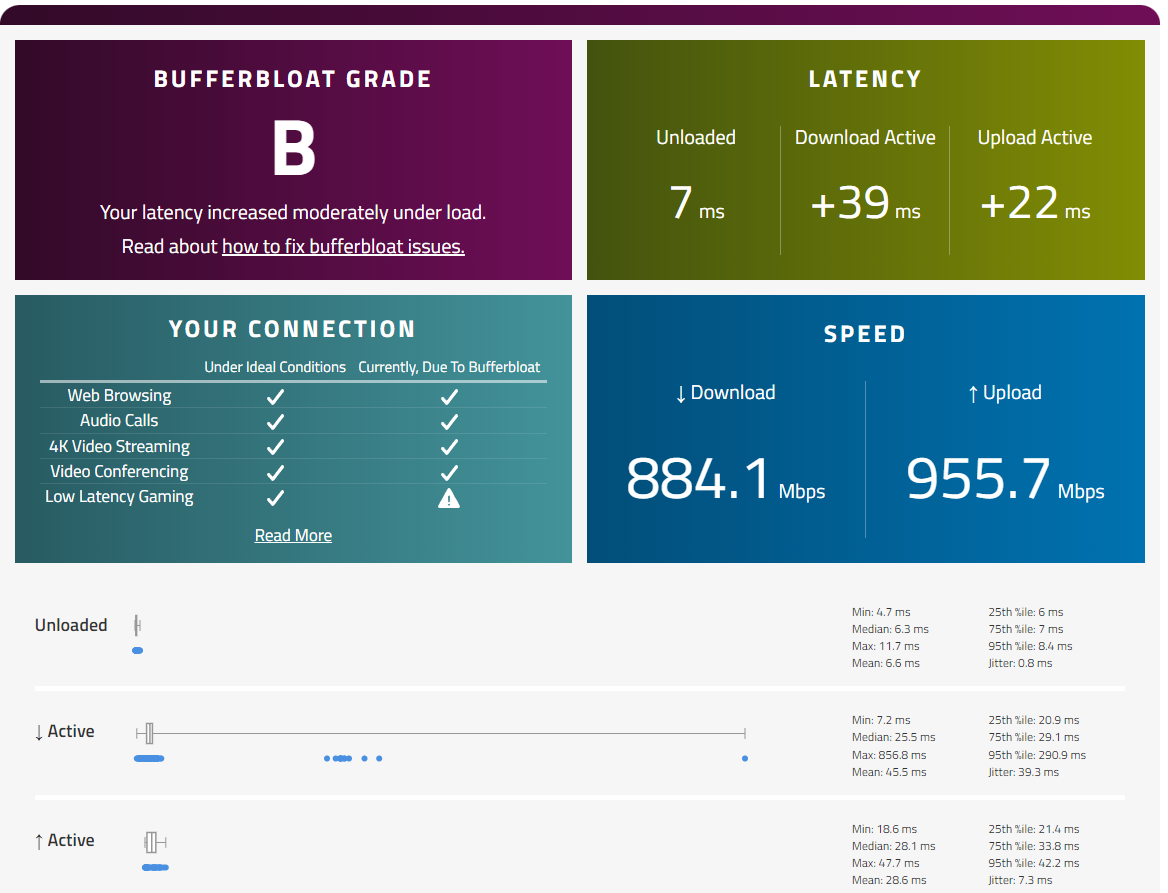
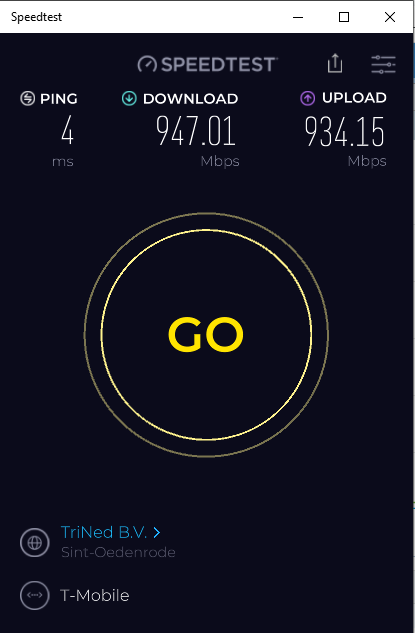
The less informative Ookla test shows also that i can max out my 1Gb connection. All local interfaces and switches are 1Gb as well so speed is not the problem.
-
@dennypage said in How to read RTTsd and why is it not the same everywhere in pfSense:
1 byte, an interval of 500ms
I cannot use 1 byte with the FreeBSD ping because it refuses to calculate any of the total result numbers if i do, i cannot get it to work with smaller then 16. This because FreeBSD ping does not return RTT information with smaller payploads for the pings.
/sbin/ping -S87.212.171.97 -c120 -i0.5 -s16 1.1.1.1
--- 1.1.1.1 ping statistics ---
120 packets transmitted, 120 packets received, 0.0% packet loss
round-trip min/avg/max/stddev = 5.129/5.380/10.037/0.441 msThe stddev is worse when i use 16 bytes as payload as opposed to the default 64 bytes could that be a hint in what is wrong with my setup/connection?
-
@stephenw10 Thanks i never unfolded the advanced settings in the gateway settings, because the most important like the destination to monitor are already visible. I changed the payload to 64 bytes (the default for Linux/FreeBSD) and the graph improved dramatically. Still not a flat line but it got a lot better.
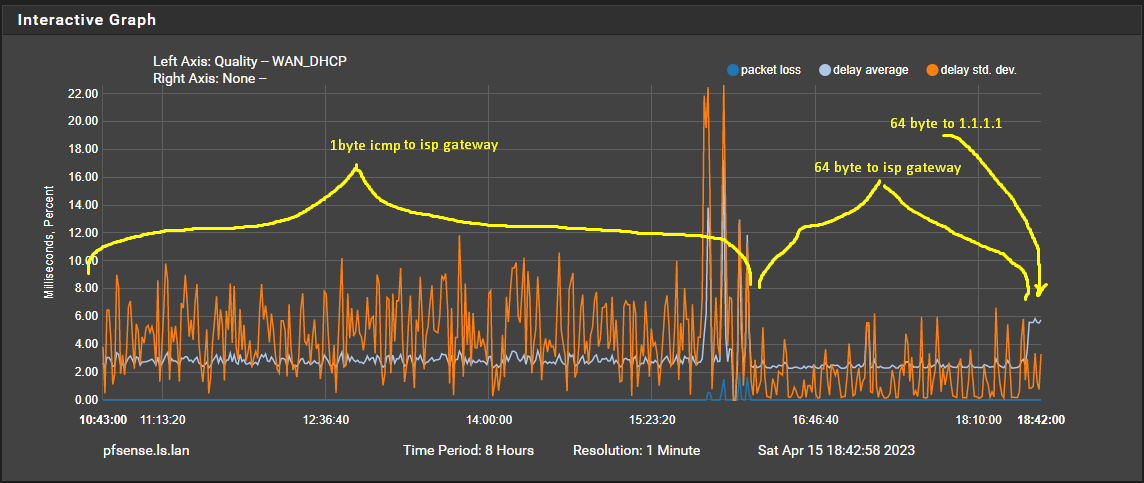
Now my next question is why is ICMP with a 1 byte payload a problem? Less data to transport makes transport easier you would think. Also the destination of 1.1.1.1 should not have a problem with 1 byte ICMP?? Anyone can verify that?
-
@leon-straathof said in How to read RTTsd and why is it not the same everywhere in pfSense:
I cannot use 1 byte with the FreeBSD ping because it refuses to calculate any of the total result numbers if i do, i cannot get it to work with smaller then 16. This because FreeBSD ping does not return RTT information with smaller payploads for the pings.
Yes, I know. A minor deficiency in ping. However you can set dpinger up with the same parameters as ping if you want to go that route.
/sbin/ping -S87.212.171.97 -c120 -i0.5 -s16 1.1.1.1
--- 1.1.1.1 ping statistics ---
120 packets transmitted, 120 packets received, 0.0% packet loss
round-trip min/avg/max/stddev = 5.129/5.380/10.037/0.441 msA 5.3ms average to cloud flare. I am envious of your connection. My average to cloud flare is ~10ms.
But going back to your original graph, your average looks to be ~3.3ms. I still believe that you are pinging a local modem, or perhaps a local fiber splitter rather than a router in the regional core. If you are interested, you can post a trace route to 1.1.1.1 and 8.8.8.8 (with and without -I) and we should be able to identify the regional core. With your ping results to cloud flare, I would guess the regional core to be ~4-4.5ms away from you.
The stddev is worse when i use 16 bytes as payload as opposed to the default 64 bytes could that be a hint in what is wrong with my setup/connection?
A smaller payload will often show a higher deviation. All other things equal (which they never are) a smaller payload reduces the minimum transmission time of the packets. This means variations in latency have a higher impact on the variance.
Other than the fact you may be monitoring a local address, I haven't seen anything indicating that your connection has an actual problem. Are you trying to troubleshoot a problem with the connection?
I would recommend that you change your monitor address to 1.1.1.1. Leave it that way for a while. See what you see.
-
@dennypage Thanks, i already have set it to monitor 1.1.1.1 with 64 byte payload. I first changed it to the gateway with 64 bytes that already made a visible difference as you can see in the reply with screenshot to @stephenw10 . The gateway of my isp i monitor is not a local device as i said there is no isp modem in my house (well there is because t-mobile sends one anyway but it is still in the box, i did not even unpack it). The ip of the isp gateway is 87.212.170.1. Also when i monitor 1.1.1.1 with 1 byte icmp requests the graph is the same bad graph i did not post a picture of that but i already tried that for over a day when troubleshooting before posting anything.
I am really happy with my connection, no real complaints. But i use Geforce Now for gaming and i want to get as little delay/hicups as possible. On occasion i have a little stutter so i wanted to make sure nothing was not optimal at my end. You don't need gbit connection most of the time speed is just a nice to have, a rock solid stable connection is much more important to me.
-
@stephenw10 FWIW, the math for a standard deviation is actually simple. What is difficult, and why it looks a bit complicated in dpinger.c, is doing it using integer math. Floating point math is much simpler.
-
@dennypage ah that makes sense, i am used to converting math to FP as it is a more 1:1 approach and easier to see the original formula in it.
-
@leon-straathof said in How to read RTTsd and why is it not the same everywhere in pfSense:
I am really happy with my connection, no real complaints. But i use Geforce Now for gaming and i want to get as little delay/hicups as possible. On occasion i have a little stutter so i wanted to make sure nothing was not optimal at my end. You don't need gbit connection most of the time speed is just a nice to have, a rock solid stable connection is much more important to me.
Ok, sounds like you need to setup a QoS such as FQ_CoDel. I'm envious of your upload bandwidth but without FQ_CoDel running my buffer-bloat grade would be the same as yours, or worse.
I have to run my connection pretty hard at times and I have some propriety things going on that are latency and jitter sensitive. As such, QoS management is vital to me. If you always have bandwidth to spare then, other than during speedtests or major file transfers, you are unlikely to see a QoS or buffer-bloat issues in real-world usage, given your 1 GbE symmetrical service.
 ️
️ -
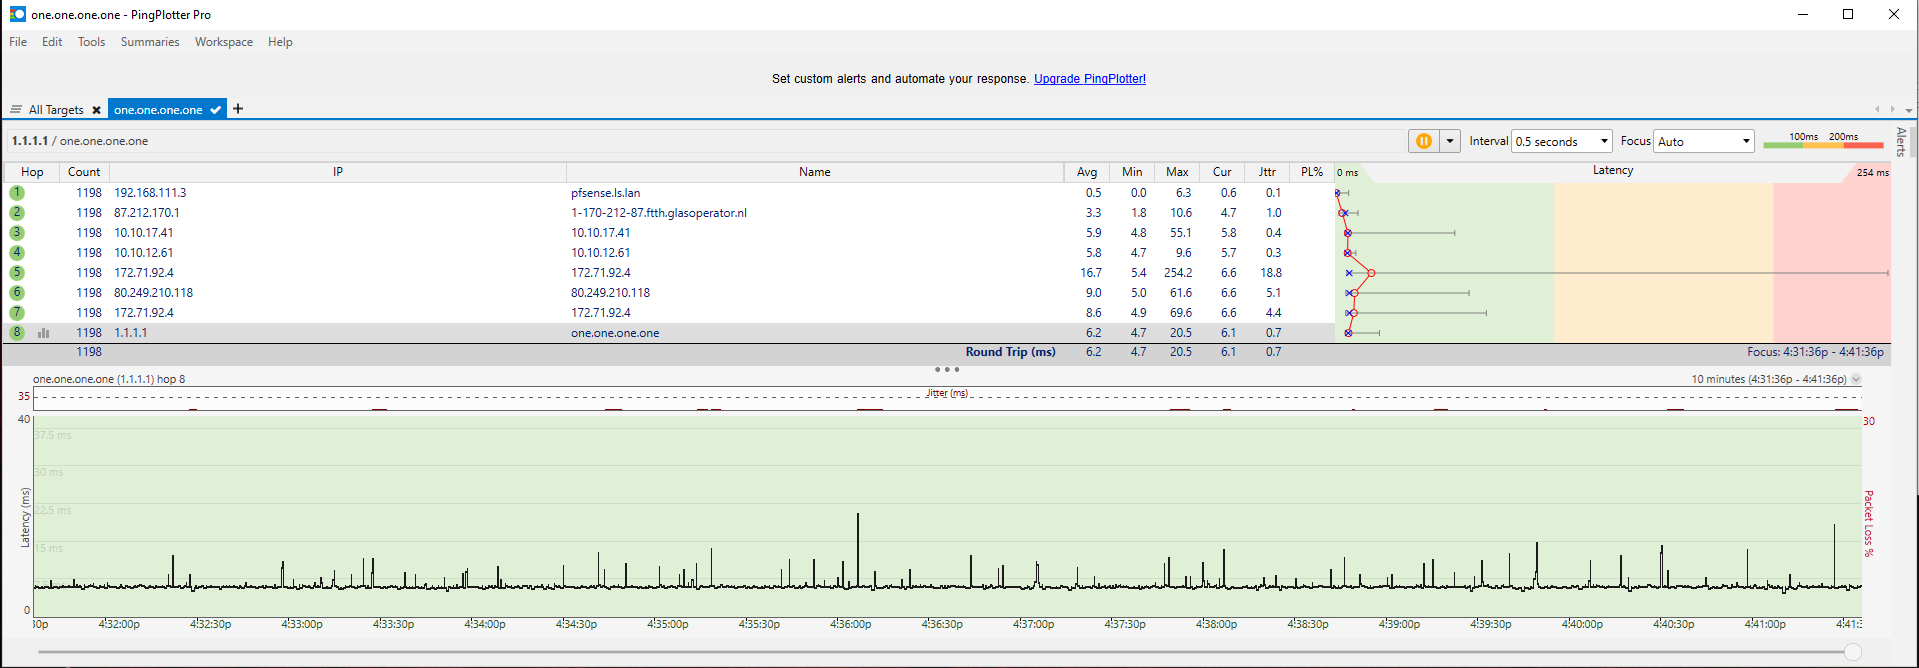
@dennypage Not sure what to look for in the traceroutes but here they are. Also i monitor 1.1.1.1 now with 64 byte payload and it looks better then before but still lots of spikes as can be seen in the screenshot. And this is without any mayor traffic, most of the time less then 1Mbit.
traceroute 1.1.1.1
traceroute to 1.1.1.1 (1.1.1.1), 64 hops max, 40 byte packets
1 1-170-212-87.ftth.glasoperator.nl (87.212.170.1) 2.631 ms 2.082 ms 1.891 ms
2 10.10.17.41 (10.10.17.41) 5.152 ms 5.066 ms 5.208 ms
3 10.10.12.61 (10.10.12.61) 5.213 ms 4.924 ms 5.251 ms
4 172.70.44.4 (172.70.44.4) 37.996 ms
141.101.65.14 (141.101.65.14) 34.639 ms
172.71.180.2 (172.71.180.2) 6.427 ms
5 80.249.210.118 (80.249.210.118) 6.045 ms
ams-ix.as13335.net (80.249.211.140) 5.848 ms
80.249.210.118 (80.249.210.118) 6.032 ms
6 172.71.92.2 (172.71.92.2) 13.773 ms
172.71.96.4 (172.71.96.4) 5.373 ms
172.71.180.4 (172.71.180.4) 5.379 ms
7 one.one.one.one (1.1.1.1) 5.292 ms 5.346 ms *traceroute -I 1.1.1.1
traceroute to 1.1.1.1 (1.1.1.1), 64 hops max, 48 byte packets
1 1-170-212-87.ftth.glasoperator.nl (87.212.170.1) 2.488 ms 1.947 ms 1.255 ms
2 10.10.17.41 (10.10.17.41) 5.132 ms 4.891 ms 5.207 ms
3 10.10.12.61 (10.10.12.61) 5.163 ms 5.500 ms 4.335 ms
4 172.71.92.4 (172.71.92.4) 5.914 ms 18.543 ms 6.637 ms
5 80.249.210.118 (80.249.210.118) 5.862 ms 5.289 ms 5.616 ms
6 172.71.92.4 (172.71.92.4) 5.499 ms 5.163 ms 5.578 ms
7 one.one.one.one (1.1.1.1) 5.189 ms 5.204 ms 5.325 ms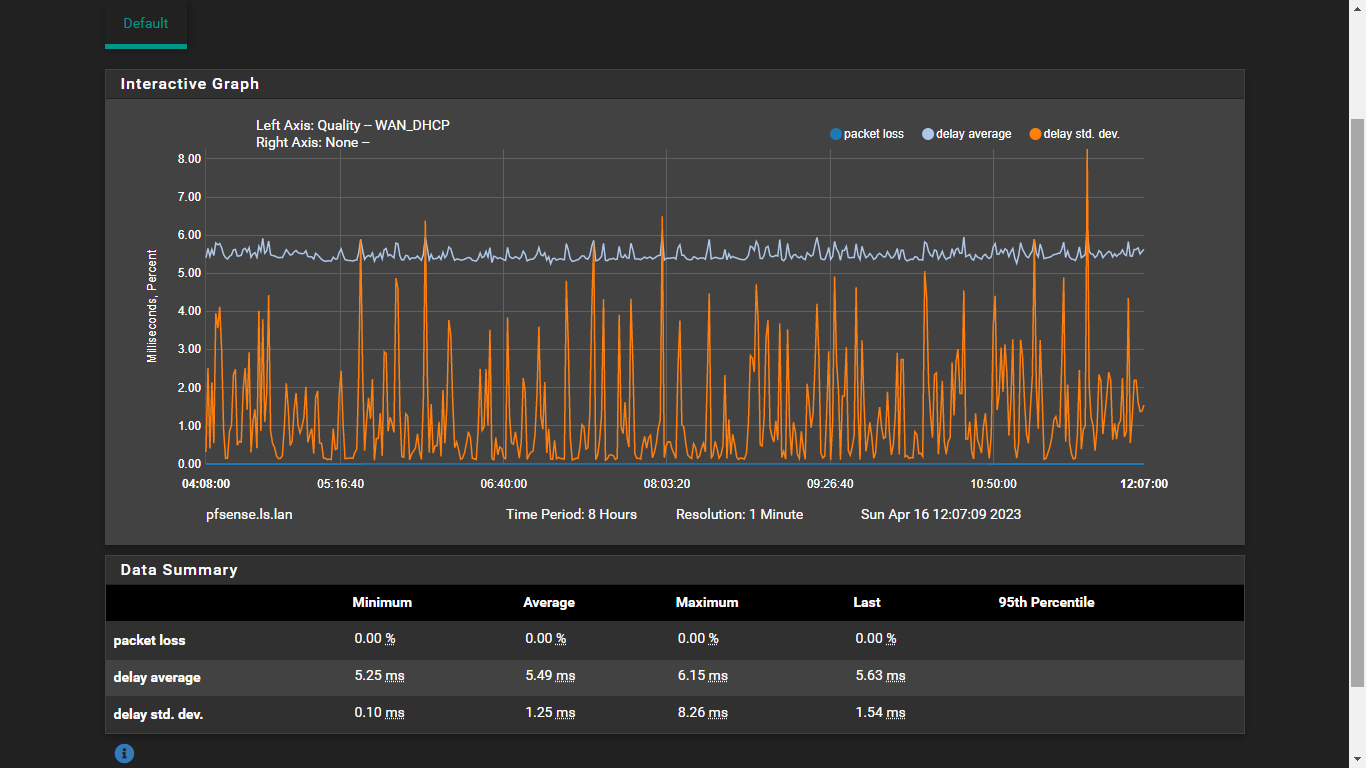
-
@robbiett Thanks for the advice of setting up QoS, i will sure do that after i am convinced that i have no other problems. I have learned when troubleshooting not to change multiple settings in one go so it's very clear if a setting did or did not do anything. However thats why i looked manually that when i posted stuff here that the traffic was very low (less then 10% of what i have should do the trick, but most of the time it was even a lot less) i should not experience bufferbloat if there is hardly any traffic.
-
@leon-straathof Yep, all sensible. Later down the line you will find that FQ_CoDel can help advance smaller packets through the stack, ahead of larger ones.
The previous advice from @dennypage still stands though, as pinging the first link with your ISP will take a great deal of the internet variables & noise out of the collect. Remember, the return of IGMP packets is pretty much at the bottom of a downstream router's priority list.
️ -
@leon-straathof said in How to read RTTsd and why is it not the same everywhere in pfSense:
traceroute 1.1.1.1
traceroute to 1.1.1.1 (1.1.1.1), 64 hops max, 40 byte packets
1 1-170-212-87.ftth.glasoperator.nl (87.212.170.1) 2.631 ms 2.082 ms 1.891 ms
2 10.10.17.41 (10.10.17.41) 5.152 ms 5.066 ms 5.208 ms
3 10.10.12.61 (10.10.12.61) 5.213 ms 4.924 ms 5.251 ms
4 172.70.44.4 (172.70.44.4) 37.996 ms
141.101.65.14 (141.101.65.14) 34.639 ms
172.71.180.2 (172.71.180.2) 6.427 ms
5 80.249.210.118 (80.249.210.118) 6.045 ms
ams-ix.as13335.net (80.249.211.140) 5.848 ms
80.249.210.118 (80.249.210.118) 6.032 ms
6 172.71.92.2 (172.71.92.2) 13.773 ms
172.71.96.4 (172.71.96.4) 5.373 ms
172.71.180.4 (172.71.180.4) 5.379 ms
7 one.one.one.one (1.1.1.1) 5.292 ms 5.346 ms *traceroute -I 1.1.1.1
traceroute to 1.1.1.1 (1.1.1.1), 64 hops max, 48 byte packets
1 1-170-212-87.ftth.glasoperator.nl (87.212.170.1) 2.488 ms 1.947 ms 1.255 ms
2 10.10.17.41 (10.10.17.41) 5.132 ms 4.891 ms 5.207 ms
3 10.10.12.61 (10.10.12.61) 5.163 ms 5.500 ms 4.335 ms
4 172.71.92.4 (172.71.92.4) 5.914 ms 18.543 ms 6.637 ms
5 80.249.210.118 (80.249.210.118) 5.862 ms 5.289 ms 5.616 ms
6 172.71.92.4 (172.71.92.4) 5.499 ms 5.163 ms 5.578 ms
7 one.one.one.one (1.1.1.1) 5.189 ms 5.204 ms 5.325 msI didn't realize that you were in Amsterdam. Small distances. Your time to 1.1.1.1 makes sense.
Notice the high variance in the responses? Hop #1 (87.212.170.1) shows particularly high, which is what I believe you were initially monitoring. I'm guessing that is a neighborhood splitter.
Couple of opinions I would offer based on these results: First, the first real DC hop in that list is #2 (10.10.17.41) which is a little under 5ms away. And second, I believe that the local Cloud Flare instance is very, very near to your ISP's datacenter, if not actually in the same location.
I would not recommend the nearby splitter for monitoring. Not only will this have higher variance, but more importantly it will likely continue to respond to to ICMP even if the splitter looses connection with the DC. In other words, your internet will be down but pfSense will not know.
Other than that, I wouldn't worry too much about the stddev. I would see to the buffer bloat issue though.
-
@dennypage Thanks for all the help, now you explain it yes the 87.212.170.1 i was monitoring must be a neighborhood splitter. And since the difference between 10.10.17.41 and 1.1.1.1 is so small i think i keep it pointing to 1.1.1.1. This way even a complete outage of my ISP is visible. And yes i live in the Netherlands although not next to Amsterdam (i live in the south of our country). Our country is not that big so even though the Belgium border is very close, it's only 75km (47 miles) in a straight line to Amsterdam.
I agree the bufferbloat is a more severe problem, although only visible when there is a lot of traffic, which i do not have often and if only for short periodes.
I found this: https://docs.netgate.com/pfsense/en/latest/hardware/tune.html it states to modify something when you have vmx network cards and more then 1 core assigned to the VM. Since i am coming from much slower DSL i always used just 1 core for pfSense. I increased it to 2 now i have fiber. But i guess the traffic is still handeled by 1 core this way without this tuning.
-
Yeah if you don't disable the blacklist you will only get one queue for Rx and Tx on a vmx NIC. As you say for a PPP connection that won't make any difference but for anything else it will.