pfSense 23.05 on 2100 - kernel memory leak with ZFS?
-
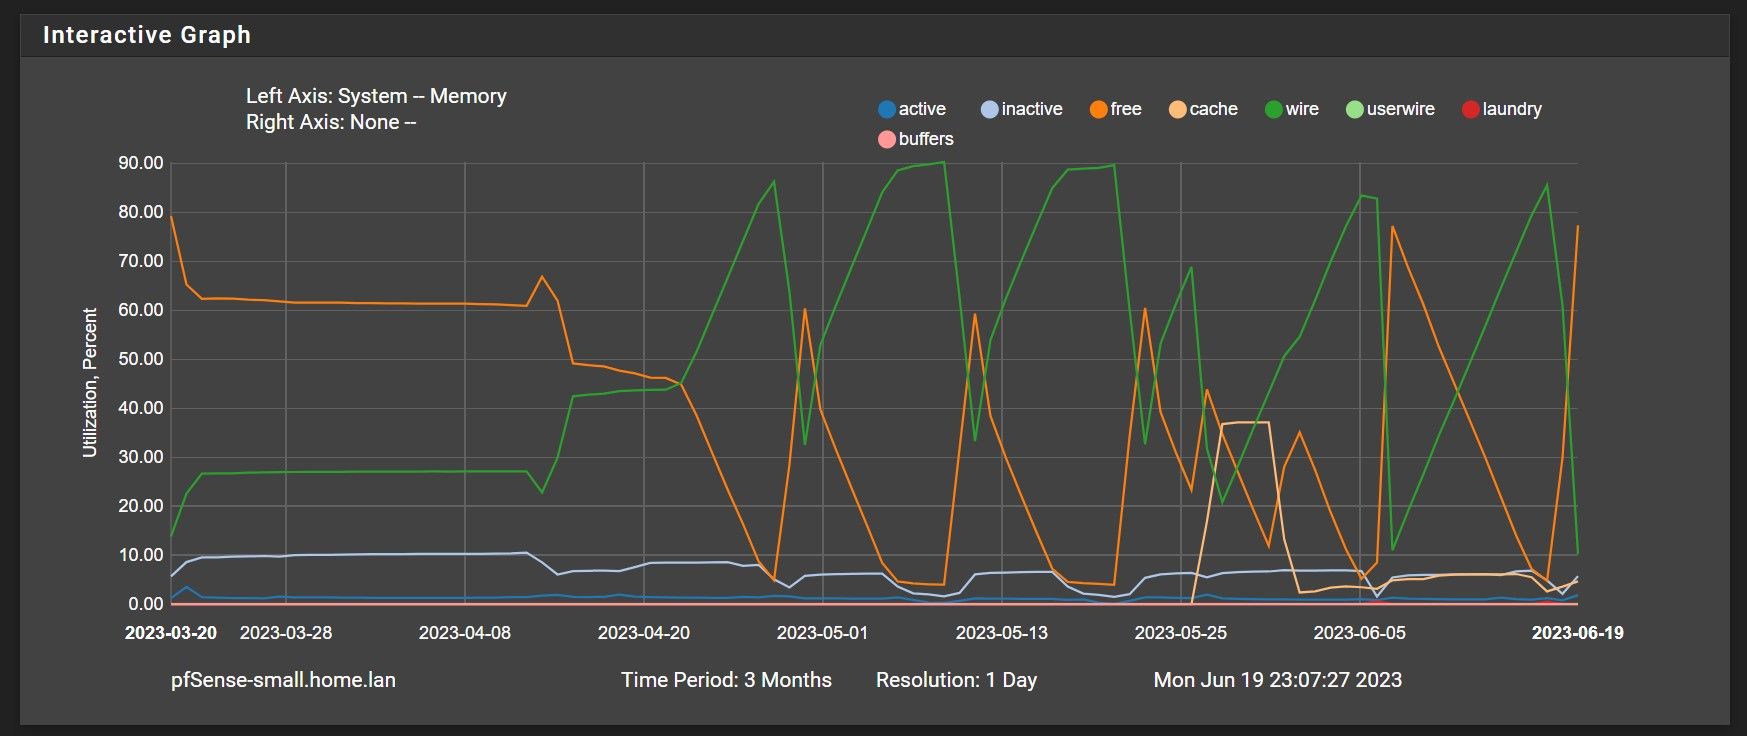
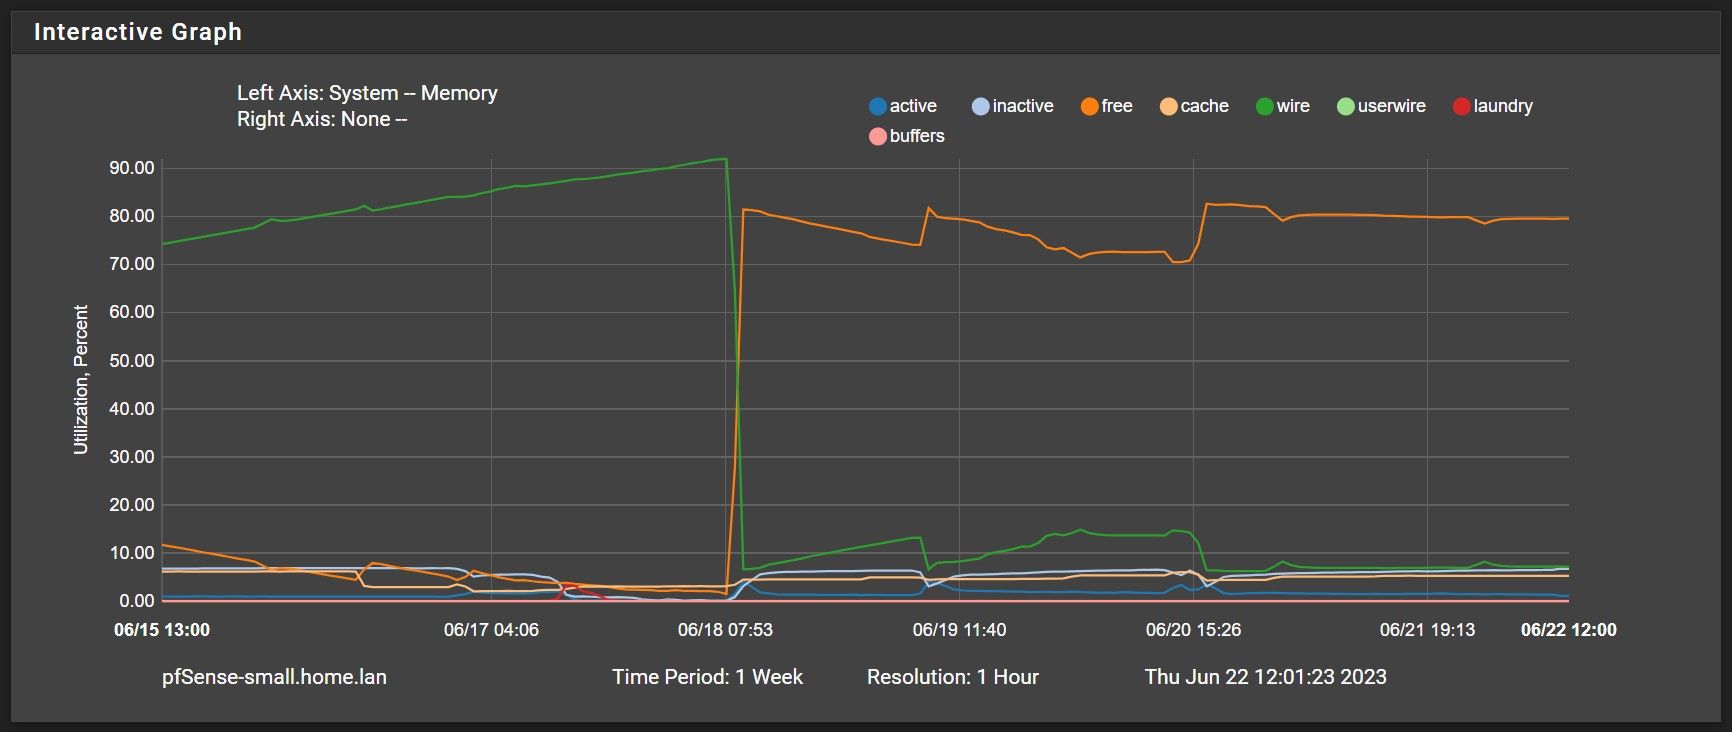
I've been running 23.05 on (2) 2100 units for about 25 days and the system seems to hang after about 10 days requiring a hard reboot. It appears that wired memory gradually increases over the course of this 10 day cycle until all memory is exhausted. So, my theory is that ZFS is not relinquishing memory and ultimately gobbles it all up not allowing other processes to acquire new/additional memory, subsequently causing the system to hang. I have not changed the ZFS kernel parameters from their default (0 - Auto), but according to the pfSense documentation, the max should never exceed 1/2 the RAM or the total RAM minus 1GB, whichever is greater. So, it appears it is not honoring the default maximum since it should never exceed 75% of available memory (4GB RAM), yet it has gone as high as 91%. As you can see from the graph below, there was a distinct difference in how memory is being managed since the upgrade to 23.01 on 4/13 and then 23.05 on 5/26 compared to 22.01 that came with the units.
My configuration is pretty basic:
pfSense 2100 4GB RAM 8GB Flash
BIOS Vendor: U-Boot, Version: 2018.03-devel-1.2.0ROGUE2-01.00.00.02+, Release Date: Fri Feb 7 2020
Version 23.05-RELEASE (arm64), built on Mon May 22 15:04:36 UTC 2023, FreeBSD 14.0-CURRENT
Interfaces: WAN, 5 VLANs
QoS: Basic traffic shaping
Firewall: 5-6 rules per interface
Services: pfBlocker, DNS resolver, OpenVPNAppreciate any assistance from the community on this issue.
Thank you,
Jon -
@johan333 You seem very confident that ZFS is the culprit. How did you determine that? because that behaviour seems more like a proper memory leak in a process. For ZFS to use your memory like that would require not only a memory flaw in the process, but also a very liniearly steady read from your SSD (to fill the ZFS cache). Did you try top to see if you can get a little more info?
https://docs.netgate.com/pfsense/en/latest/monitoring/status/system-activity.html -
This is simplified, a lot of details left out.
ZFS memory use is tied primarily to ARC. ARC is used to cache read data, so you need something doing a lot of reading from the filesystem, lots different stuff.
I think the typical pattern on a pfSense box would be lots of reads at startup, then mostly writes to logs. Writes to the device obviously flow through different memory structures and if the physical device is not responding, there may be an increase until things time out, but they should then be getting freed.from the gui, diagnostics, command prompt you can get zfs specific values:
sysctl -a | grep zfs | grep arcstats -
On 23.05 the ZFS ARC usage on that graph is under Cache, not Wire, so it seems unlikely that ZFS would be the culprit based on what little information has been given.
You should monitor the system by keeping a console and/or ssh session open and watch what is using the memory with something like
top -aS -o res.Also if you have something else that might be using RAM configured, such as RAM disks for
/tmpand/varthat's worth looking into. If you have/varin a RAM disk and something is going nuts with log files and using a bunch of space that way it could contribute to the issue. -
Re: pfSense 23.05 on 2100 - kernel memory leak with ZFS?
Thanks gents for the responses and I completely agree that my theory may be prematurely incriminating ZFS. I based this on my research on this forum where others saw a signature memory leak type of scenario on 23.01/23.05 and it pointed to ZFS and ARC. I'm new to the pfSense platform (and BSD), but I'm fairly computer savvy so I sincerely appreciate any help in diagnosing this problem. I've included output below from what you guys requested, but please chime in with what else I might want to use to build a better mouse trap as I expect I'm going to have to monitor this over time - as with most memory leak issues.
Here are two 'top -atSzo res -s 3' snapshots taken 16 hours apart. As far as I can see, no system or user level process is demonstrating a memory leak scenario. The only increase I see is with ARC, but I do not know how to diagnose what is driving it's usage to ultimately find a culprit.
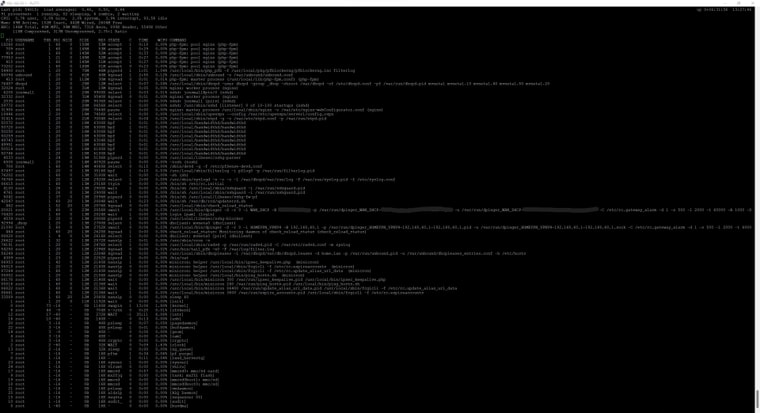
Snapshot #1 - 6/19/23 @ 13:27 PT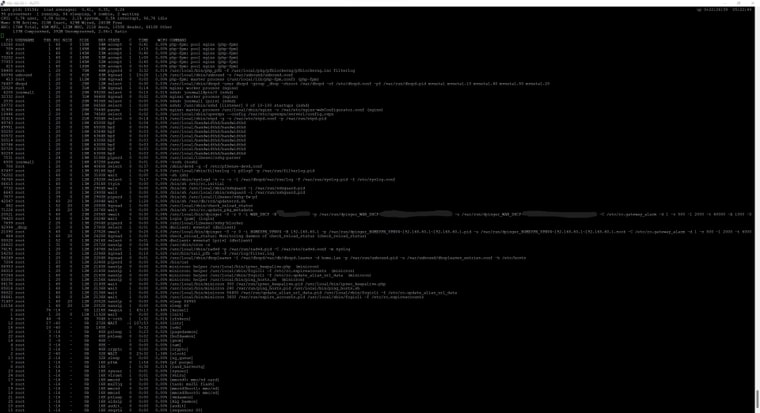
Snapshot #2 - 6/20/23 @ 05:22 PTHere is a snapshot of the ARC stats:
kstat.zfs.misc.arcstats.abd_chunk_waste_size: 31232
kstat.zfs.misc.arcstats.cached_only_in_progress: 0
kstat.zfs.misc.arcstats.arc_raw_size: 0
kstat.zfs.misc.arcstats.arc_sys_free: 0
kstat.zfs.misc.arcstats.arc_need_free: 0
kstat.zfs.misc.arcstats.demand_iohit_prescient_prefetch: 24
kstat.zfs.misc.arcstats.demand_hit_prescient_prefetch: 24
kstat.zfs.misc.arcstats.prescient_prefetch: 48
kstat.zfs.misc.arcstats.demand_iohit_predictive_prefetch: 123
kstat.zfs.misc.arcstats.demand_hit_predictive_prefetch: 737
kstat.zfs.misc.arcstats.predictive_prefetch: 2524
kstat.zfs.misc.arcstats.async_upgrade_sync: 59
kstat.zfs.misc.arcstats.arc_meta_min: 16777216
kstat.zfs.misc.arcstats.arc_meta_max: 45561080
kstat.zfs.misc.arcstats.arc_dnode_limit: 185929113
kstat.zfs.misc.arcstats.arc_meta_limit: 1859291136
kstat.zfs.misc.arcstats.arc_meta_used: 39604200
kstat.zfs.misc.arcstats.arc_prune: 0
kstat.zfs.misc.arcstats.arc_loaned_bytes: 0
kstat.zfs.misc.arcstats.arc_tempreserve: 0
kstat.zfs.misc.arcstats.arc_no_grow: 0
kstat.zfs.misc.arcstats.memory_available_bytes: 2446315520
kstat.zfs.misc.arcstats.memory_free_bytes: 2520383488
kstat.zfs.misc.arcstats.memory_all_bytes: 3552796672
kstat.zfs.misc.arcstats.memory_indirect_count: 0
kstat.zfs.misc.arcstats.memory_direct_count: 0
kstat.zfs.misc.arcstats.memory_throttle_count: 0
kstat.zfs.misc.arcstats.l2_rebuild_log_blks: 0
kstat.zfs.misc.arcstats.l2_rebuild_bufs_precached: 0
kstat.zfs.misc.arcstats.l2_rebuild_bufs: 0
kstat.zfs.misc.arcstats.l2_rebuild_asize: 0
kstat.zfs.misc.arcstats.l2_rebuild_size: 0
kstat.zfs.misc.arcstats.l2_rebuild_lowmem: 0
kstat.zfs.misc.arcstats.l2_rebuild_cksum_lb_errors: 0
kstat.zfs.misc.arcstats.l2_rebuild_dh_errors: 0
kstat.zfs.misc.arcstats.l2_rebuild_io_errors: 0
kstat.zfs.misc.arcstats.l2_rebuild_unsupported: 0
kstat.zfs.misc.arcstats.l2_rebuild_success: 0
kstat.zfs.misc.arcstats.l2_data_to_meta_ratio: 0
kstat.zfs.misc.arcstats.l2_log_blk_count: 0
kstat.zfs.misc.arcstats.l2_log_blk_asize: 0
kstat.zfs.misc.arcstats.l2_log_blk_avg_asize: 0
kstat.zfs.misc.arcstats.l2_log_blk_writes: 0
kstat.zfs.misc.arcstats.l2_hdr_size: 0
kstat.zfs.misc.arcstats.l2_asize: 0
kstat.zfs.misc.arcstats.l2_size: 0
kstat.zfs.misc.arcstats.l2_io_error: 0
kstat.zfs.misc.arcstats.l2_cksum_bad: 0
kstat.zfs.misc.arcstats.l2_abort_lowmem: 0
kstat.zfs.misc.arcstats.l2_free_on_write: 0
kstat.zfs.misc.arcstats.l2_evict_l1cached: 0
kstat.zfs.misc.arcstats.l2_evict_reading: 0
kstat.zfs.misc.arcstats.l2_evict_lock_retry: 0
kstat.zfs.misc.arcstats.l2_writes_lock_retry: 0
kstat.zfs.misc.arcstats.l2_writes_error: 0
kstat.zfs.misc.arcstats.l2_writes_done: 0
kstat.zfs.misc.arcstats.l2_writes_sent: 0
kstat.zfs.misc.arcstats.l2_write_bytes: 0
kstat.zfs.misc.arcstats.l2_read_bytes: 0
kstat.zfs.misc.arcstats.l2_rw_clash: 0
kstat.zfs.misc.arcstats.l2_feeds: 0
kstat.zfs.misc.arcstats.l2_bufc_metadata_asize: 0
kstat.zfs.misc.arcstats.l2_bufc_data_asize: 0
kstat.zfs.misc.arcstats.l2_mfu_asize: 0
kstat.zfs.misc.arcstats.l2_mru_asize: 0
kstat.zfs.misc.arcstats.l2_prefetch_asize: 0
kstat.zfs.misc.arcstats.l2_misses: 0
kstat.zfs.misc.arcstats.l2_hits: 0
kstat.zfs.misc.arcstats.uncached_evictable_metadata: 0
kstat.zfs.misc.arcstats.uncached_evictable_data: 0
kstat.zfs.misc.arcstats.uncached_size: 0
kstat.zfs.misc.arcstats.mfu_ghost_evictable_metadata: 0
kstat.zfs.misc.arcstats.mfu_ghost_evictable_data: 0
kstat.zfs.misc.arcstats.mfu_ghost_size: 0
kstat.zfs.misc.arcstats.mfu_evictable_metadata: 1089024
kstat.zfs.misc.arcstats.mfu_evictable_data: 36472832
kstat.zfs.misc.arcstats.mfu_size: 48907264
kstat.zfs.misc.arcstats.mru_ghost_evictable_metadata: 0
kstat.zfs.misc.arcstats.mru_ghost_evictable_data: 0
kstat.zfs.misc.arcstats.mru_ghost_size: 0
kstat.zfs.misc.arcstats.mru_evictable_metadata: 2090496
kstat.zfs.misc.arcstats.mru_evictable_data: 99806720
kstat.zfs.misc.arcstats.mru_size: 123869184
kstat.zfs.misc.arcstats.anon_evictable_metadata: 0
kstat.zfs.misc.arcstats.anon_evictable_data: 0
kstat.zfs.misc.arcstats.anon_size: 151552
kstat.zfs.misc.arcstats.other_size: 6773040
kstat.zfs.misc.arcstats.bonus_size: 1121600
kstat.zfs.misc.arcstats.dnode_size: 4335728
kstat.zfs.misc.arcstats.dbuf_size: 1315712
kstat.zfs.misc.arcstats.metadata_size: 31754240
kstat.zfs.misc.arcstats.data_size: 141173760
kstat.zfs.misc.arcstats.hdr_size: 1076920
kstat.zfs.misc.arcstats.overhead_size: 28936192
kstat.zfs.misc.arcstats.uncompressed_size: 411830784
kstat.zfs.misc.arcstats.compressed_size: 143991808
kstat.zfs.misc.arcstats.size: 180809192
kstat.zfs.misc.arcstats.c_max: 2479054848
kstat.zfs.misc.arcstats.c_min: 111024896
kstat.zfs.misc.arcstats.c: 283686656
kstat.zfs.misc.arcstats.p: 141843840
kstat.zfs.misc.arcstats.hash_chain_max: 2
kstat.zfs.misc.arcstats.hash_chains: 22
kstat.zfs.misc.arcstats.hash_collisions: 13561
kstat.zfs.misc.arcstats.hash_elements_max: 5494
kstat.zfs.misc.arcstats.hash_elements: 5245
kstat.zfs.misc.arcstats.evict_l2_skip: 0
kstat.zfs.misc.arcstats.evict_l2_ineligible: 0
kstat.zfs.misc.arcstats.evict_l2_eligible_mru: 0
kstat.zfs.misc.arcstats.evict_l2_eligible_mfu: 0
kstat.zfs.misc.arcstats.evict_l2_eligible: 0
kstat.zfs.misc.arcstats.evict_l2_cached: 0
kstat.zfs.misc.arcstats.evict_not_enough: 0
kstat.zfs.misc.arcstats.evict_skip: 0
kstat.zfs.misc.arcstats.access_skip: 0
kstat.zfs.misc.arcstats.mutex_miss: 0
kstat.zfs.misc.arcstats.deleted: 0
kstat.zfs.misc.arcstats.uncached_hits: 0
kstat.zfs.misc.arcstats.mfu_ghost_hits: 0
kstat.zfs.misc.arcstats.mfu_hits: 4685498
kstat.zfs.misc.arcstats.mru_ghost_hits: 0
kstat.zfs.misc.arcstats.mru_hits: 1616339
kstat.zfs.misc.arcstats.prefetch_metadata_misses: 351
kstat.zfs.misc.arcstats.prefetch_metadata_iohits: 681
kstat.zfs.misc.arcstats.prefetch_metadata_hits: 857
kstat.zfs.misc.arcstats.prefetch_data_misses: 658
kstat.zfs.misc.arcstats.prefetch_data_iohits: 0
kstat.zfs.misc.arcstats.prefetch_data_hits: 25
kstat.zfs.misc.arcstats.demand_metadata_misses: 1193
kstat.zfs.misc.arcstats.demand_metadata_iohits: 107
kstat.zfs.misc.arcstats.demand_metadata_hits: 3393539
kstat.zfs.misc.arcstats.demand_data_misses: 2548
kstat.zfs.misc.arcstats.demand_data_iohits: 56
kstat.zfs.misc.arcstats.demand_data_hits: 2907416
kstat.zfs.misc.arcstats.misses: 4750
kstat.zfs.misc.arcstats.iohits: 844
kstat.zfs.misc.arcstats.hits: 6301837
I am not using any RAM disks on the system:
[23.05-RELEASE][jonsmall@pfSense-small.home.lan]/home/jonsmall: mount
pfSense/ROOT/default on / (zfs, local, noatime, nfsv4acls)
devfs on /dev (devfs)
pfSense/var on /var (zfs, local, noatime, nfsv4acls)
pfSense/tmp on /tmp (zfs, local, noatime, nosuid, nfsv4acls)
pfSense/home on /home (zfs, local, noatime, nfsv4acls)
pfSense/var/log on /var/log (zfs, local, noatime, noexec, nosuid, nfsv4acls)
pfSense/var/db on /var/db (zfs, local, noatime, noexec, nosuid, nfsv4acls)
pfSense/var/cache on /var/cache (zfs, local, noatime, noexec, nosuid, nfsv4acls)
pfSense/var/tmp on /var/tmp (zfs, local, noatime, nosuid, nfsv4acls)
pfSense/ROOT/default/cf on /cf (zfs, local, noatime, noexec, nosuid, nfsv4acls)
pfSense/ROOT/default/var_cache_pkg on /var/cache/pkg (zfs, local, noatime, noexec, nosuid, nfsv4acls)
pfSense/ROOT/default/var_db_pkg on /var/db/pkg (zfs, local, noatime, noexec, nosuid, nfsv4acls)
tmpfs on /var/run (tmpfs, local)
devfs on /var/dhcpd/dev (devfs)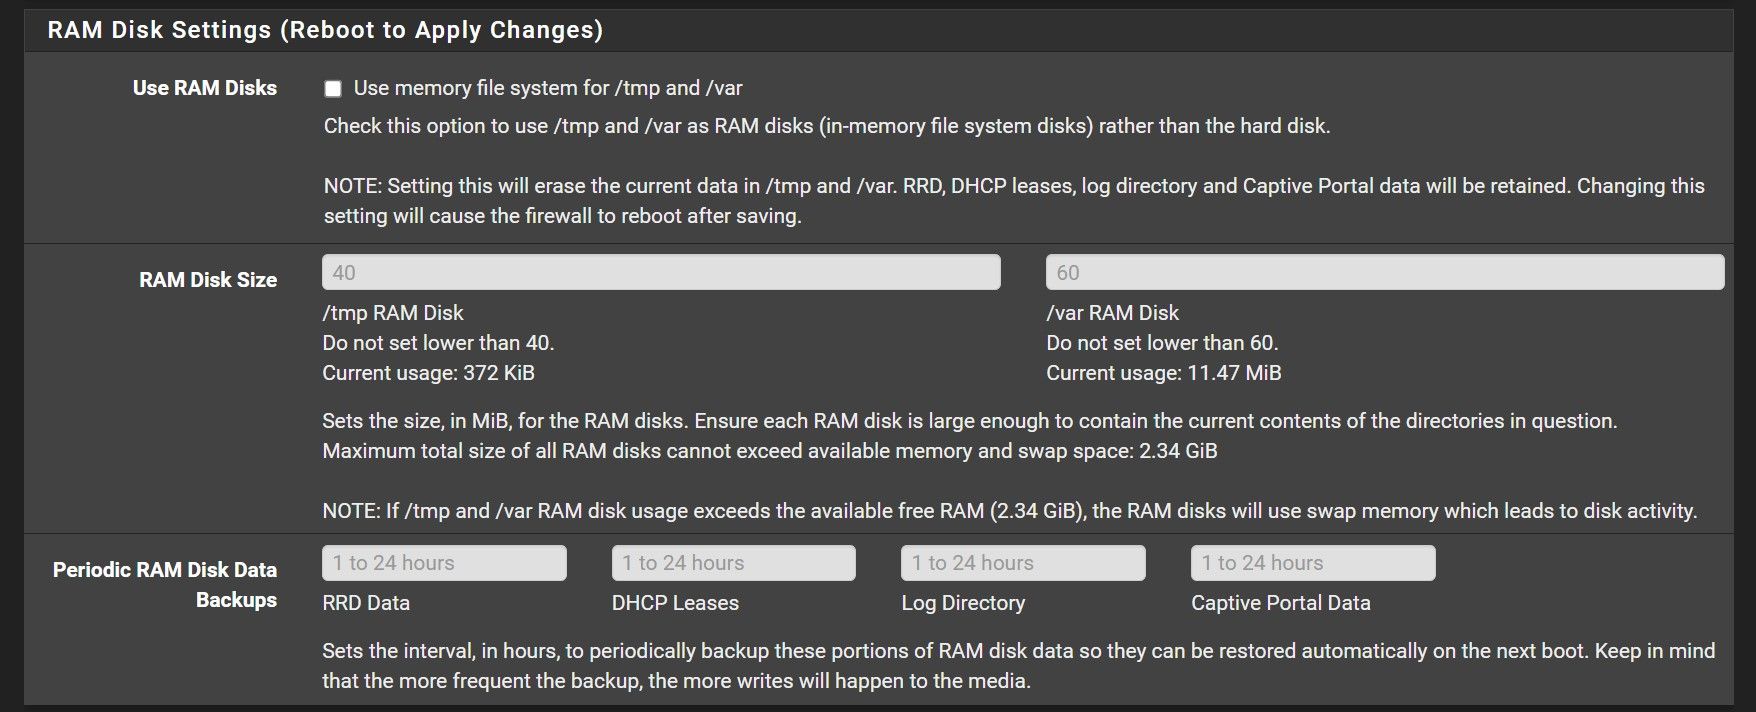
-
@johan333 FWIW this page links to a ZFS tuning doc: https://docs.netgate.com/pfsense/en/latest/hardware/memory.html
Haven’t seen hanging 2100s, and haven’t done any memory tuning. Can you view the console while it happens?
https://docs.netgate.com/pfsense/en/latest/solutions/netgate-2100/connect-to-console.html -
@SteveITS Thanks for the reference to memory tuning and I'll check it out. You know, I was thinking the same thing, but I don't currently have the console connected to anything. I've got a spare Raspberry PI I think I'll throw in the cabinet and connect it to the 2100 console port.
-
I just wanted to follow up on this post and provide some closure as I believe I've identified the issue. When researching problems in forums like this, it can be so frustrating to read through 20 pages of dialogue only to find no closure. It is as if someone tore out the last pages of a great novel!
Also, please allow me to also apologize to the community for prematurely blaming ZFS or the kernel as I'm 90% certain that isn't the case. This is out of character for me and no different than a typical doctor/patient exam. I should've started with describing the symptoms and allowed experts to interrogate with more detailed questions, determine a prognosis, and treatment plan. Again, my humble apologies.
Now, onto what I've discovered after carefully scrutinizing the system through the lens of what is different about my systems vs other 2100s running 23.05 that aren't raising flags about memory leaks. I found some anecdotal things such as running pfBlockerNG-devel (3.2.0_5) instead of pfBlockerNG (3.2.0_5), but I didn't feel that would be a likely culprit as the associated process memory has always been stable. I then remembered about the constant errors I have been getting with the connected UPS systems in DMESG:
ugen1.2: <CPS ST Series> at usbus1 (disconnected)
ugen1.2: <CPS ST Series> at usbus1
See, when these systems were installed (6mo ago), I setup UPS systems on each of them and attempted to use Nut to manage the UPS interface. However, it was not stable and opted to just disable Nut for the time being and save troubleshooting for a rainy day. These messages are constant (every few secs), so I began thinking that perhaps with each disconnect/connect some kernel level memory allocation (malloc call) was happening that wasn't being released. After 10 days of this constant cycle, the system was just starved of free memory and became unstable. So, 2 days ago, I disconnected the UPS from pfSense and performed a hard restart. As you can see from the graph below, the wire and free memory are looking much more well-behaved as I would normally see a 7-8% increase in wire memory within 24 hours and so far it hasn't fluctuated more than +/- 2% over 2 days.
Again, thank you for the community's support as these troubleshooting efforts, although menacing, do provide a valuable opportunity to learn more about the system.
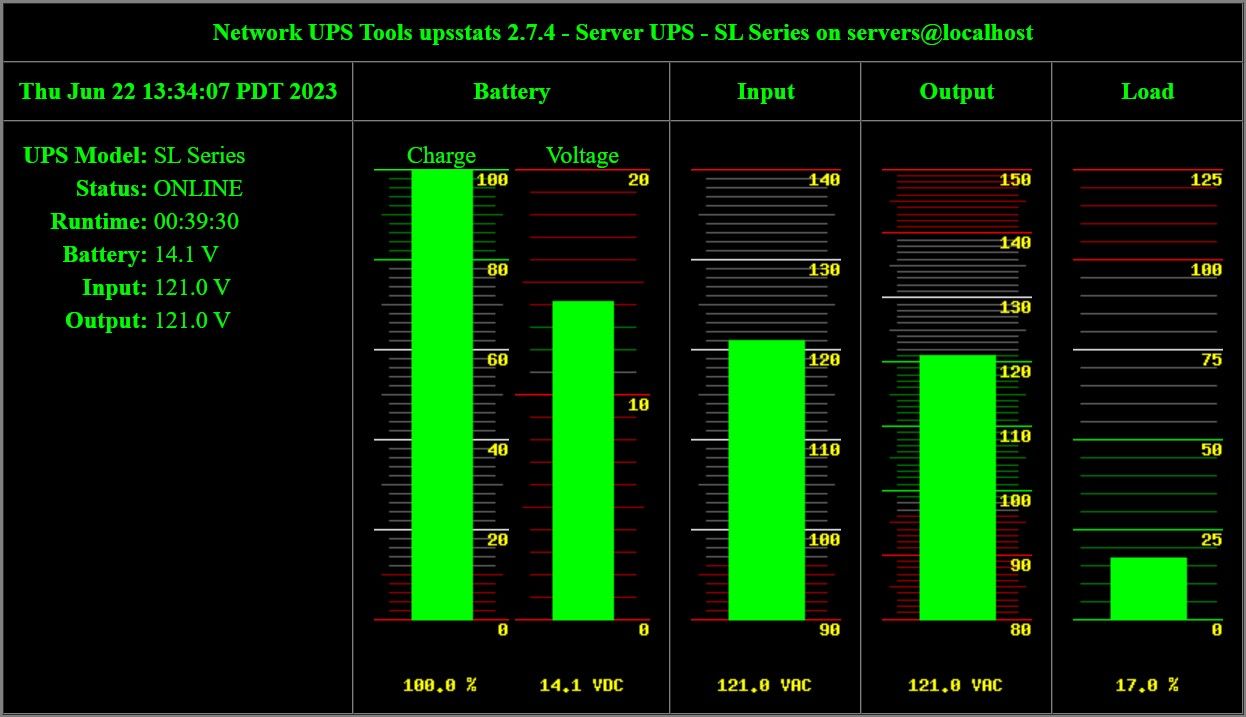
BTW - I have since connected the UPSs (and pfSense console) to a Raspberry PI running Nut and it is working great! Now the rainy day project is configuring a Nut client on pfSense to respond to triggers from the Nut server for loss of power events.
-
Nice catch!
So the UPS USB device was flapping like that with or without NUT installed/running? -
@stephenw10 Yes, using 2 different models of CyberPower UPSs (SL700U & CP425SLG) and have been experiencing this flapping since the 2100s were new with v22.05 - 6mo ago. I removed the Nut package shortly after the install when these disconnects were causing the instability of Nut. They are both HID compliant and I was using the usbhid-ups driver with Nut, but it still was flapping. As mentioned, I have them connected to a Raspberry PI with Nut and usbhid-ups driver and it is working great (see pic).
In case you're interested, I saved this output. When it disconnected, the UPS device didn't show in a usbconfig listing.
[23.05-RELEASE][jonsmall@pfSense-rider.home.lan]/home/jonsmall: sudo usbconfig
ugen0.1: <Generic XHCI root HUB> at usbus0, cfg=0 md=HOST spd=SUPER (5.0Gbps) pwr=SAVE (0mA)
ugen1.1: <Marvell EHCI root HUB> at usbus1, cfg=0 md=HOST spd=HIGH (480Mbps) pwr=SAVE (0mA)
ugen1.2: <CPS ST Series> at usbus1, cfg=0 md=HOST spd=LOW (1.5Mbps) pwr=ON (50mA)

[23.05-RELEASE][jonsmall@pfSense-rider.home.lan]/home/jonsmall: sudo usbconfig -vd ugen1.2
ugen1.2: <CPS ST Series> at usbus1, cfg=0 md=HOST spd=LOW (1.5Mbps) pwr=ON (50mA)

  bLength = 0x0012
  bDescriptorType = 0x0001
  bcdUSB = 0x0110
  bDeviceClass = 0x0000  <Probed by interface class>
  bDeviceSubClass = 0x0000
  bDeviceProtocol = 0x0000
  bMaxPacketSize0 = 0x0008
  idVendor = 0x0764
  idProduct = 0x0501
  bcdDevice = 0x0001
  iManufacturer = 0x0003  <CPS>
  iProduct = 0x0001  <ST Series>
  iSerialNumber = 0x0000  <no string>
  bNumConfigurations = 0x0001


 Configuration index 0

    bLength = 0x0009
    bDescriptorType = 0x0002
    wTotalLength = 0x0022
    bNumInterfaces = 0x0001
    bConfigurationValue = 0x0001
    iConfiguration = 0x0000  <no string>
    bmAttributes = 0x00a0
    bMaxPower = 0x0019

    Interface 0
      bLength = 0x0009
      bDescriptorType = 0x0004
      bInterfaceNumber = 0x0000
      bAlternateSetting = 0x0000
      bNumEndpoints = 0x0001
      bInterfaceClass = 0x0003  <HID device>
      bInterfaceSubClass = 0x0000
      bInterfaceProtocol = 0x0000
      iInterface = 0x0000  <no string>

      Additional Descriptor

      bLength = 0x09
      bDescriptorType = 0x21
      bDescriptorSubType = 0x10
       RAW dump:
       0x00 | 0x09, 0x21, 0x10, 0x01, 0x21, 0x01, 0x22, 0x5f,
       0x08 | 0x02

     Endpoint 0
        bLength = 0x0007
        bDescriptorType = 0x0005
        bEndpointAddress = 0x0081  <IN>
        bmAttributes = 0x0003  <INTERRUPT>
        wMaxPacketSize = 0x0008
        bInterval = 0x000a
        bRefresh = 0x0000
        bSynchAddress = 0x0000