dpinger latency vs. ping from command ping?
-
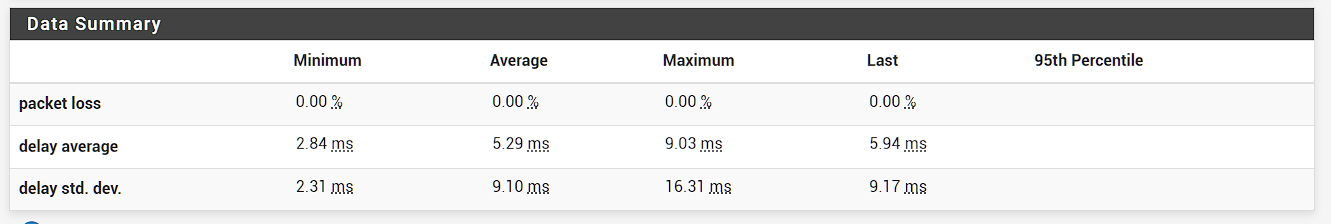
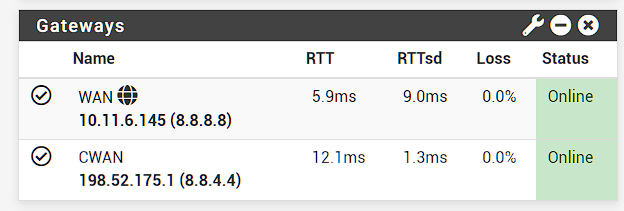
Any ideas why dpinger reports a higher RTT and RTTsd than a command prompt ping?
When pinging from the command prompt I consistently get 2ms pings.
It seems dpinger has much higher latency?
PING 8.8.4.4 (8.8.4.4): 56 data bytes
64 bytes from 8.8.4.4: icmp_seq=0 ttl=118 time=2.514 ms
64 bytes from 8.8.4.4: icmp_seq=1 ttl=118 time=2.859 ms
64 bytes from 8.8.4.4: icmp_seq=2 ttl=118 time=2.846 ms--- 8.8.4.4 ping statistics ---
3 packets transmitted, 3 packets received, 0.0% packet loss
round-trip min/avg/max/stddev = 2.514/2.740/2.859/0.160 msAlso any ideas why when running a traceroute from pfSense's command prompt looks a bit odd - the first top hops are missing:
[23.09-RELEASE][admin@pfsense]/root: traceroute 8.8.4.4 traceroute to 8.8.4.4 (8.8.4.4), 64 hops max, 40 byte packets 1 * *traceroute to 8.8.4.4 (8.8.4.4), 64 hops max, 40 byte packets 1 * * * 2 * * * 3 142.124.127.68 (142.124.127.68) 4.460 ms 4.548 ms 4.477 ms 4 cr01-toroonxnhe9-bundle-ether3.net.bell.ca (142.124.127.163) 4.000 ms 3.66 0 ms 3.516 ms 5 bx3-torontoxn_hundredgige0-1-0-0.net.bell.ca (64.230.97.145) 2.939 ms 4.56 1 ms 3.001 ms 6 google_bx3-torontoxn.net.bell.ca (184.150.181.147) 2.462 ms 2.315 ms 2.47 9 ms 7 74.125.244.161 (74.125.244.161) 3.314 ms 108.170.250.225 (108.170.250.225) 3.026 ms 108.170.250.241 (108.170.250.241) 3.535 ms -
Is it using the same WAN? Check the state table whilst pinging.
Steve
-
@stephenw10 Yes - it's going through the correct WAN connection. I pinged on pfSense directly, which I think has static routes to the monitoring IPs right?
I also replicated the tests on my Windows PC and confirmed in the state table it's routing to the correct WAN.
-
Perhaps the anycast target changed since dpinger opened the state. If you restart dpinger does it then match local pings?
-
@coolspot said in dpinger latency vs. ping from command ping?:
the first top hops are missing:
This is not uncommon - there are many "hops" on the internet that do not answer.. Have you tried different traceroute - normally it uses udp, have you tried icmp.
As to just an off the cuff theory to why those number could be different.. dpinger is doing what every half second, and your typical ping is doing what every 1 second.. You get some high levels of jitter with specific pings and those numbers could be vastly different..
Also keep in mind dpinger is doing it all the time - not sure how much history is being used history is being used to come up with those numbers.. Your command line ping is what 4 over 4 seconds.. Pretty small sample..
Get a ping going for say a few hours, and then go about your normal internet use.. As your pipe is used, you are actually moving real traffic, etc. your ping times are going to change most likely.. This will effect the averages posted there..
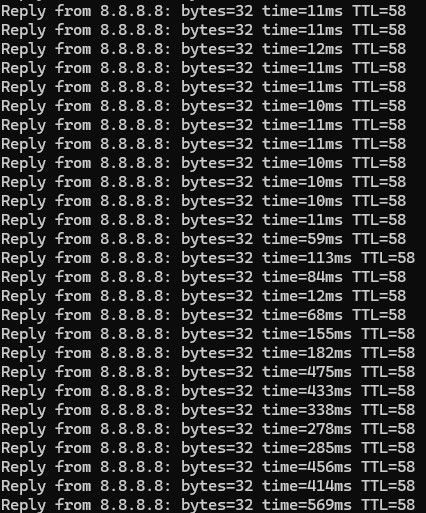
To show this - get a ping going, then download something big or start streaming video from netflix or something - does your ping time now fluctuate, go up in value?
Here can you tell where I started downloading a large file ;)
edit
Here shown another way - looking at my quality monitor graph over the last hour - can you tell when I started that large download ;)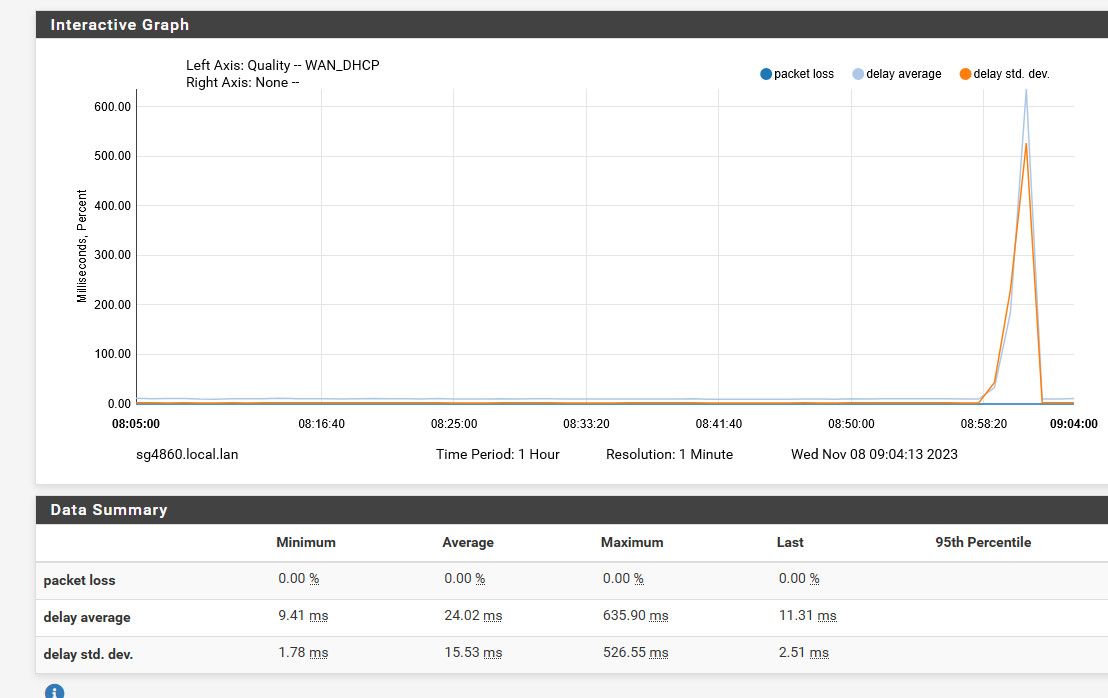
-
@coolspot said in dpinger latency vs. ping from command ping?:
Any ideas why dpinger reports a higher RTT and RTTsd than a command prompt ping?
-
You always need to set the source IP for ping to ensure you are using the expected interface regardless of routes. See the -S option to ping. NB: Static routes are optional. See System / Advanced / Miscellaneous / Gateway Monitoring.
-
With default parameters for command line ping, you are averaging a small number of packets, once per second. With default parameters for dpinger, you are averaging 116-120 packets spread over 60 seconds. The packets are also dramatically different sizes.
-
Google's 8.8.8.8 and 8.8.4.4 are not really very good for monitoring anymore. Lots of variance, particularly on 8.8.8.8. If you really need to go out across the internet, try Cloudflare (1.1.1.1) instead.
-
That you have such a high standard deviation on your WAN indicates that something between you and the monitoring target is not very stable.
-